0049
Visual contrast levels modulate excitation and inhibition in the human visual cortex – a combined fMRI-MR Spectroscopy study at 7 Tesla1Wellcome Centre for Integrative Neuroimaging, FMRIB Division, Nuffield Department of Clinical Neurosciences, University of Oxford, Oxford, United Kingdom, 2Department of Physiology, Anatomy & Genetics, University of Oxford, Oxford, United Kingdom, 3College of Health and Human Sciences, Purdue University, West Lafayette, IN, United States
Synopsis
We used 7 Tesla combined fMRI-MRS to show that simultaneously measured hemodynamic and neurochemical responses in the human visual cortex changed as a function of visual contrast. BOLD change increased linearly to rise in visual contrast, glutamate increased and GABA decreased. Quantification of this change using an excitation:inhibition index demonstrated a switch from inhibitory-dominant to excitatory-dominant neurochemical response. Our results are a step towards disambiguating contributions of cortical excitation and inhibition to stimulus evoked hemodynamic response.
Introduction
A key challenge to the field of BOLD-imaging is that the BOLD-signal is ambiguous regarding the relative contributions of neuronal excitation and inhibition. Recent studies showing modulation of glutamate (1) and GABA (2) to sensory activity suggest that 1H Magnetic Resonance spectroscopy (MRS) could provide the critical information to disambiguate the BOLD-signal. We aimed to identify how hemodynamics and neurochemistry change over a range of stimulus intensities by using the combined fMRI-MRS sequence (3) at 7T.Methods
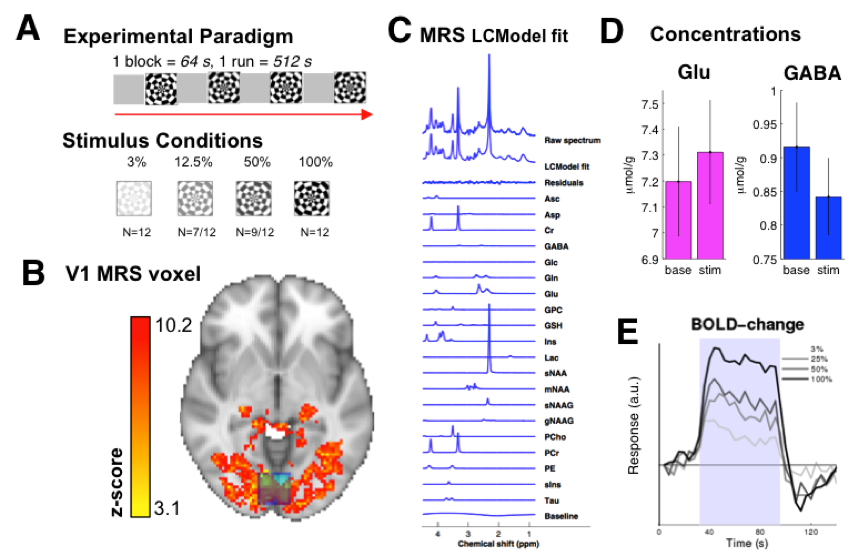
Twelve volunteers took part in the study using a whole body MR system (Siemens, Erlangen) equipped with a NOVA Medical 32-channel coil. A dielectric pad containing Barium Titanate and deuterated water (BaTiO3) was placed behind the occiput of each participant to improve the extent of the effective transmit field. Data were acquired from a 2x2x2 cm VOI centered at the midline and on the calcarine sulcus. Combined fMRI-MRS data were acquired in the same TR of 4 s over a 512 s scan (3D EPI, resolution= 4.3 x 4.3 x 4.3 mm; flip angle=5°, repetition time TRepi=40 ms, TE=25 ms, FOV=240 mm, 16 slices). MRS data were acquired using short-echo semi-LASER pulse sequence (TE=36 ms, TRmrs=4 s) with VAPOR water suppression and outer volume suppression. Participants viewed 64s stimulus blocks of flashing checkerboards defined in one out of four stimulus contrasts (3, 12.5, 50, 100%), alternating with a blank mid-gray screen in separate counter-balanced runs. BOLD-correction on metabolite spectra was applied using line width changes identified on the total Creatine singlet at 3.03 ppm.Results
Stimuli were presented in a block design (Fig. 1A). All participants took part in experiments where contrast levels 3% and 100% were presented in separate runs. In the same session, intermediate contrasts 12.5% (N= 7/12) and 50% (N= 9/12) were collected for a subset of participants. Presentation of a flashing checkerboard evoked reliable BOLD-responses (Fig. 1B). Response to the flashing checkerboard increased BOLD-activation to 1.59±0.234% compared to baseline. Estimated metabolites are shown in Fig. 1C, with concentration levels of major excitatory neurotransmitter Glutamate (Glu) and inhibitory neurotransmitter γ-aminobutyric acid (GABA) during baseline and stimulation periods shown in Figure 1D. BOLD changes to all contrast levels were measureable in the V1 MRS voxel (Fig 1E).
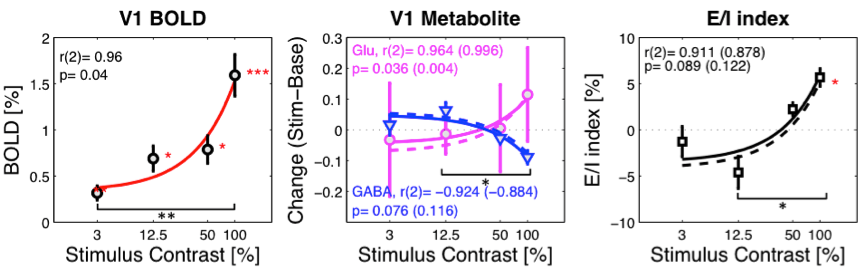
Increase in visual contrast generated a proportionate increase in BOLD-signal (Fig. 2A, r = 0.959, p= 0.04), with a significant difference between 3 and 100% contrast (paired unequal samples t-test, p< 0.05, Bonferroni corrected alpha= 0.0083). Figure 2B shows opposite trends for excitation and inhibition: relative to baseline, glutamate increased (r= 0.996, p= 0.004) and GABA decreased (r = -0.884 p= 0.116) with rising stimulus contrast. To ensure that these changes were not driven by general changes in metabolite spectra, we performed the same analysis on the tCr signal. The tCr signal was not correlated to contrast (r= -0.105, p= 0.895). An E/I-ratio (4) was calculated to quantify the interplay between excitation and inhibition. The change in E/I index was well described by a linear model, with excitatory drive peaking at 100% contrast (Figure 2C, p < 0.05, one-sample T-test, Bonferroni-corrected α= 0.0125 on BOLD-corrected metabolite data). A main effect of stimulus contrast is identified between 12.5 and 100% contrast (unequal samples t-test, Bonferroni corrected, alpha= 0.0083).
Conclusion
We provide the first identification of a dynamic interplay between excitation and inhibition during functional activation to visual contrast in the human primary visual cortex. Our results are a step towards disambiguating contributions of cortical excitation and inhibition to stimulus evoked hemodynamic response.Acknowledgements
This research was funded by Medical Research Council (MR/K014382/1), The Royal Society (University Research Fellowship to HB) and the Wellcome Trust.References
1. Bednarik P, Tkac I, Giove F, DiNuzzo M, Deelchand DK, Emir UE, et al. Neurochemical and BOLD responses during neuronal activation measured in the human visual cortex at 7 Tesla. Journal of cerebral blood flow and metabolism : official journal of the International Society of Cerebral Blood Flow and Metabolism. 2015 Apr;35(4):601-10. PubMed PMID: 25564236. Pubmed Central PMCID: 4420878.
2. Chen C, Sigurdsson HP, Pepes SE, Auer DP, Morris PG, Morgan PS, et al. Activation induced changes in GABA: Functional MRS at 7T with MEGA-sLASER. NeuroImage. 2017 Aug 01;156:207-13. PubMed PMID: 28533117.
3. Ip IB, Berrington A, Hess AT, Parker AJ, Emir UE, Bridge H. Combined fMRI-MRS acquires simultaneous glutamate and BOLD-fMRI signals in the human brain. NeuroImage. 2017 Jul 15;155:113-9. PubMed PMID: 28433623. Pubmed Central PMCID: 5519502.
4. Shibata K, Sasaki Y, Bang JW, Walsh EG, Machizawa MG, Tamaki M, et al. Overlearning hyperstabilizes a skill by rapidly making neurochemical processing inhibitory-dominant. Nature neuroscience. 2017 Mar;20(3):470-5. PubMed PMID: 28135242. Pubmed Central PMCID: 5323354.
Figures