0048
Visually evoked negative BOLD signal coupled with silenced neuronal activity; an fMRI and intra-cranial electrocorticography study in humansAlessio Fracasso1, Anna Gaglianese2, Serge O Dumoulin1, Nick F Ramsey2, and Natalia Petridou2
1Spinoza Centre for Neuroimaging, Amsterdam, Netherlands, 2University Medical Centre Utrecht, Utrecht, Netherlands
Synopsis
Neuroimaging techniques provide a unique window on the study of human brain function in healthy as well as pathological conditions. Intra-cranial electrocorticography (ECoG) at high frequency broadband power is associated with positive blood-oxygenation-level-dependent signal, but the electrophysiological correlates of negative BOLD signals are are less well understood. Here we investigate the relationship between negative BOLD and neuronal population activity measured with ECoG, in humans, using a paradigm that excludes blood stealing as a source of negative BOLD signal.
Introduction
Modern neuroimaging techniques such as functional magnetic resonance imaging (fMRI) and intra-cranial electrocorticography (ECoG) provide a unique window on the study of human brain function in healthy as well as pathological conditions. ECoG signals, particularly in the high frequency broadband power (HFB) relate to neuronal population firing activity. FMRI on the other hand measures hemodynamic changes in response to neuronal activity, most commonly using the blood-oxygenation-level-dependent (BOLD) contrast. Several studies investigated the relationship between HFB and BOLD fMRI signals in the case of evoked activity, demonstrating that the two signals are positively correlated1,2. Specifically, power increases between 65 Hz and 95 Hz are more correlated with BOLD amplitude than power changes in other bands3. The electrophysiological correlates of negative BOLD signals however are less well understood. Multiple mechanisms have been described as a source of negative BOLD. Decreases in BOLD signal in response to visual stimuli have been associated with both decreased neural firing rate as well as a decrease in multi-unit activity below spontaneous activity in monkey primary visual cortex. However, also blood stealing from neighboring locations can play a role4,5. Here we investigate the relationship between negative BOLD and neuronal population activity measured with ECoG, in a human subject, using a paradigm that excludes blood stealing as a source of negative BOLD signal.Materials and methods
ECoG: The participant underwent implantation of subdural electrode grids (interelectrode spacing: 1 cm, electrode diameter: 2.3 mm; Data recording system: 128 channels, 512 Hz sampling rate, 0.15–134.4 Hz band-pass filter, Micromed, Italy) to determine the site of epileptic foci for the purpose of possible surgical removal of the epileptogenic tissue. Implanted grids extended to healthy tissue in the occipital pole of the left hemisphere. The participant gave written informed consent to participate in the study in compliance with the Declaration of Helsinki (2013). Electrodes with epileptic artifacts were rejected and signals were re-referenced to the common average of all remaining electrodes. fMRI: Pre-operative fMRI data were acquired on a Philips Achieva 3T scanner using 3D PRESTO and a 32-channel head coil, with the following parameters: FOV 99X256X256mm, resolution of 3mm isotropic, 33 slices, flip angle: 10 deg, TE/TR: 38.7/27ms. repetition time 810 ms. Stimuli: the stimuli were generated in Matlab. Participants fixated in the center of the screen. The contrast-defined stimulus consisted of a unilateral dart-board pattern avoiding a central circular region (0.4° of visual angle) and displaced by 20° of polar angle from the vertical meridian, left and right visual field stimulation were alternated, with an interleaving 15s baseline This paradigm allows us to record responses dominated by positive and negative BOLD response amplitudes from the same portion of visual cortex in the same fMRI run. Analysis fMRI: Active voxels were selected based on the contrast right hemifield – left hemifield (T values > 2,p<0.05, uncorrected). Analysis ECoG: Power spectral density (1–134 Hz) was estimated for each trial every 1 Hz by Welch’s periodogram averaging method with a 1 s window. Electrodes exhibiting the highest significant spectral power augmentation above baseline in the 65–95 Hz HFB during task presentation (paired t test, P<0.05) and located within the occipital pole were selected (14 electrodes)
Results
Robust positive and negative BOLD signals were elicited during the contralateral and ipsilateral stimulation conditions, respectively (Fig1). The average shape of the positive and the negative HRFs are reported in Fig1D. Contra-lateral stimulation elicited a strong HFB power response in the left hemisphere as expected (Figure 1G&H). Ipsi-lateral stimulation elicited a reliable negative BOLD response, and no significant HFB power response (Fig1G&H) in the same hemisphere. Results are summarized in Fig2. A positive correlation between HFB responses and BOLD responses for contralateral stimulation was shown (p<0.04). Negative BOLD values were associated with no HFB responses (Fig2A).Discussion
It has been shown that negative BOLD response in monkey primary visual cortex is closely associated with decreases in neuronal activity measured with spiking and multi-unit activity. Both these measures reflect direct neuronal firing. In our experiment we coupled positive and negative BOLD response with measured HFB in humans, showing a positive correlation between positive BOLD and HFB power while a negative BOLD was accompanied with an absence of HFB power response. Our data shows that negative BOLD is associated with silenced local neuronal population activity as measured by ECoG, in the absence of blood stealing effects, hence corroborating the neurophysiological contributions to negative BOLD. Power in alpha does not appear to explain negative BOLD effects.Acknowledgements
No acknowledgement found.References
1. Siero, Jeroen CW, et al. "BOLD consistently matches electrophysiology in human sensorimotor cortex at increasing movement rates: a combined 7T fMRI and ECoG study on neurovascular coupling." Journal of Cerebral Blood Flow & Metabolism 33.9 (2013): 1448-1456. 2. Gaglianese, Anna, et al. "Correspondence between fMRI and electrophysiology during visual motion processing in human MT+." NeuroImage (2017). 3. Hermes, Dora, et al. "Stimulus dependence of gamma oscillations in human visual cortex." Cerebral cortex 25.9 (2014): 2951-2959. 4. Shmuel, Amir, et al. "Negative functional MRI response correlates with decreases in neuronal activity in monkey visual area V1." Nature neuroscience 9.4 (2006): 569-577. 5. Goense, Jozien, Hellmut Merkle, and Nikos K. Logothetis. "High-resolution fMRI reveals laminar differences in neurovascular coupling between positive and negative BOLD responses." Neuron 76.3 (2012): 629-639.Figures
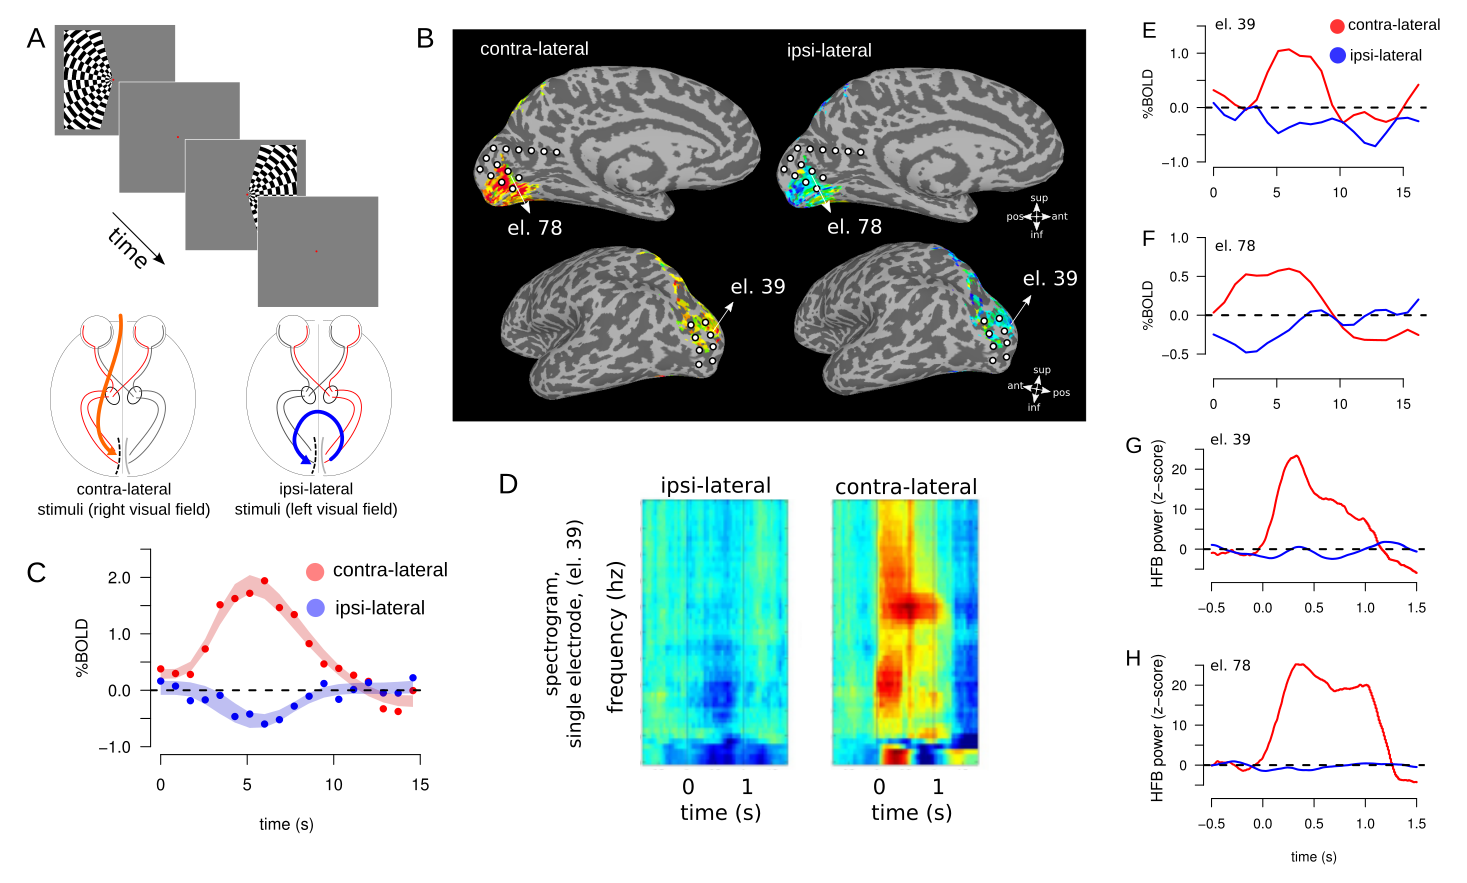
Panel A. different
visual hemifields were stimulated by a contrast-defined lateralized
dart-board pattern.
β
coefficient maps elicited by viewing the stimulus. Activation maps
consist of signal amplitude (cluster>20, threshold by T>2,
p<0.05, uncorrected). Panel C, estimated HRFs from contra- and
ipsi-lateral conditions. Panel D, single electrode spectrogram
obtained from ipsi- and contra- conditions. Panel E,F HRF for
locations corresponding to two representative selected electrodes.
Panel G,H HFB responses for the two representative electrodes. Both
electrode 39 and 78 show increased HFB response for the contralateral
but not for ipsi-lateral conditions.
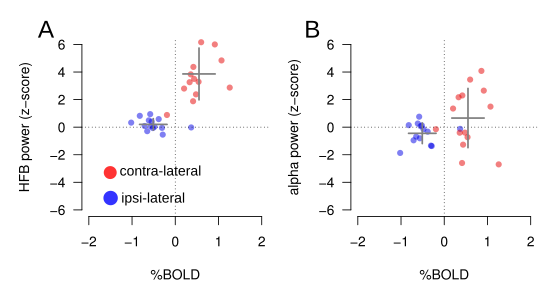
Summary
results. Panel A, HFB results for the contra-lateral (red dots) and
ipsi-lateral (blue dots) conditions compared to the BOLD response for
each electrode (each dot represents one electrode). Positive BOLD
response is associated with an HFB power increase. Negative BOLD is
observed in the absence of HFB power. Panel B, alpha power for the
contra-lateral and ipsi-lateral conditions as a function of BOLD
response for each electrode with negative BOLD associated with a
decrease in alpha (as compared to the contra-condition). Alpha
responses vary greatly across electrodes.