0047
Mechanisms underlying negative fMRI response in the striatum1Neurology & Biomedical Research Imaging Center, University of North Carolina at Chapel Hill, Chapel Hill, NC, United States, 2University of North Carolina at Chapel Hill, Chapel Hill, NC, United States, 3Duke University, Durham, NC, United States, 4Stanford University, Stanford, CA, United States, 5National Institute of Environmental Health Sciences, Durham, NC, United States, 6Psychiatry, University of North Carolina at Chapel Hill, Chapel Hill, NC, United States
Synopsis
Optogenetic stimulation of striatal neurons and several afferents evoke robust negative fMRI responses in the striatum, while striatal electrophysiological recordings during the same stimulations show increases in neuronal activity. Pharmacological manipulations during D1MSN-induced negative striatal responses suggest responses are downstream of MSN activity, but not interneurons or local DA release. Fiber-photometry data from D2MSNs shows a similar pattern of neurovascular uncoupling/negative coupling. This negative fMRI response is also apparent in the human brain. Our results indicate that positive BOLD in the striatum is mediated through DA release, and that negative BOLD in the striatum is induced by local neuronal activations.
INTRODUCTION
The striatum receives excitatory inputs from cortex and thalamus, serves as the major hub of the basal ganglia system, and is important in cognition, motivation, reward, sensorimotor function and many neuropsychiatric disorders. A recent PubMed search identified ~12,000 studies examining striatal function using fMRI. Data from our lab and others indicates that applying traditional neurovascular coupling to striatum may be erroneous,1,9 and we have discounted explanations of the striatum response by major theories of negative fMRI signal such as deactivation,1,2 vascular steal,1,2,3,4 or excessive oxygen consumption.3,5 This prompts the question: What if interpretations of striatal BOLD have been wrong, or even diametrically opposed to underlying neuronal activity? To further illuminate the mechanisms of fMRI signal generation in the striatum, we performed optogenetic fMRI of 7 distinct circuits related to the striatum, recorded electrophysiological signals, measured dopamine release and manipulated neurotransmission using concurrent intracranial pharmacology and fMRI, performed multispectral fiberphotometry to assess striatal neurovascular coupling, and finally, conducted human translational studies.METHODS
Our investigations into fMRI signal origins in the striatum utilized established procedures and neuroscience tools including: optogenetic-fMRI,6-9 electrophysiology,10 electrical deep-brain stimulation (DBS),6,7 and fast-scan cyclic voltammetry (FSCV)11,12 in wildtype male Sprague-Dawley or TH-Cre Long-Evans rats, and dual-spectral fiber-photometry for GCaMP and CBV measurement in awake A2A-Cre C57B/6 mice.13,14 Further, we developed an intracranial pharmacological-fMRI system for 0.5uL/10min microinfusions of drug via plastic cannula into striatum using a MR-compatible setup. We performed a human fMRI paradigm with transcutaneous electrical nerve stimulation (TENS)15,16 and transcranial magnetic stimulation (TMS).17 Rat fMRI studies were performed on a Bruker 9.4-Tesla/30-cm scanner. Rats were maintained on light sedation.6,19,20 Feraheme (30mg/kg i.v.) was used for CBV-fMRI, acquired by a gradient echo-EPI sequence. fMRI data was preprocessed and analyzed using established pipelines.6-8,21,22RESULTS and DISCUSSION:
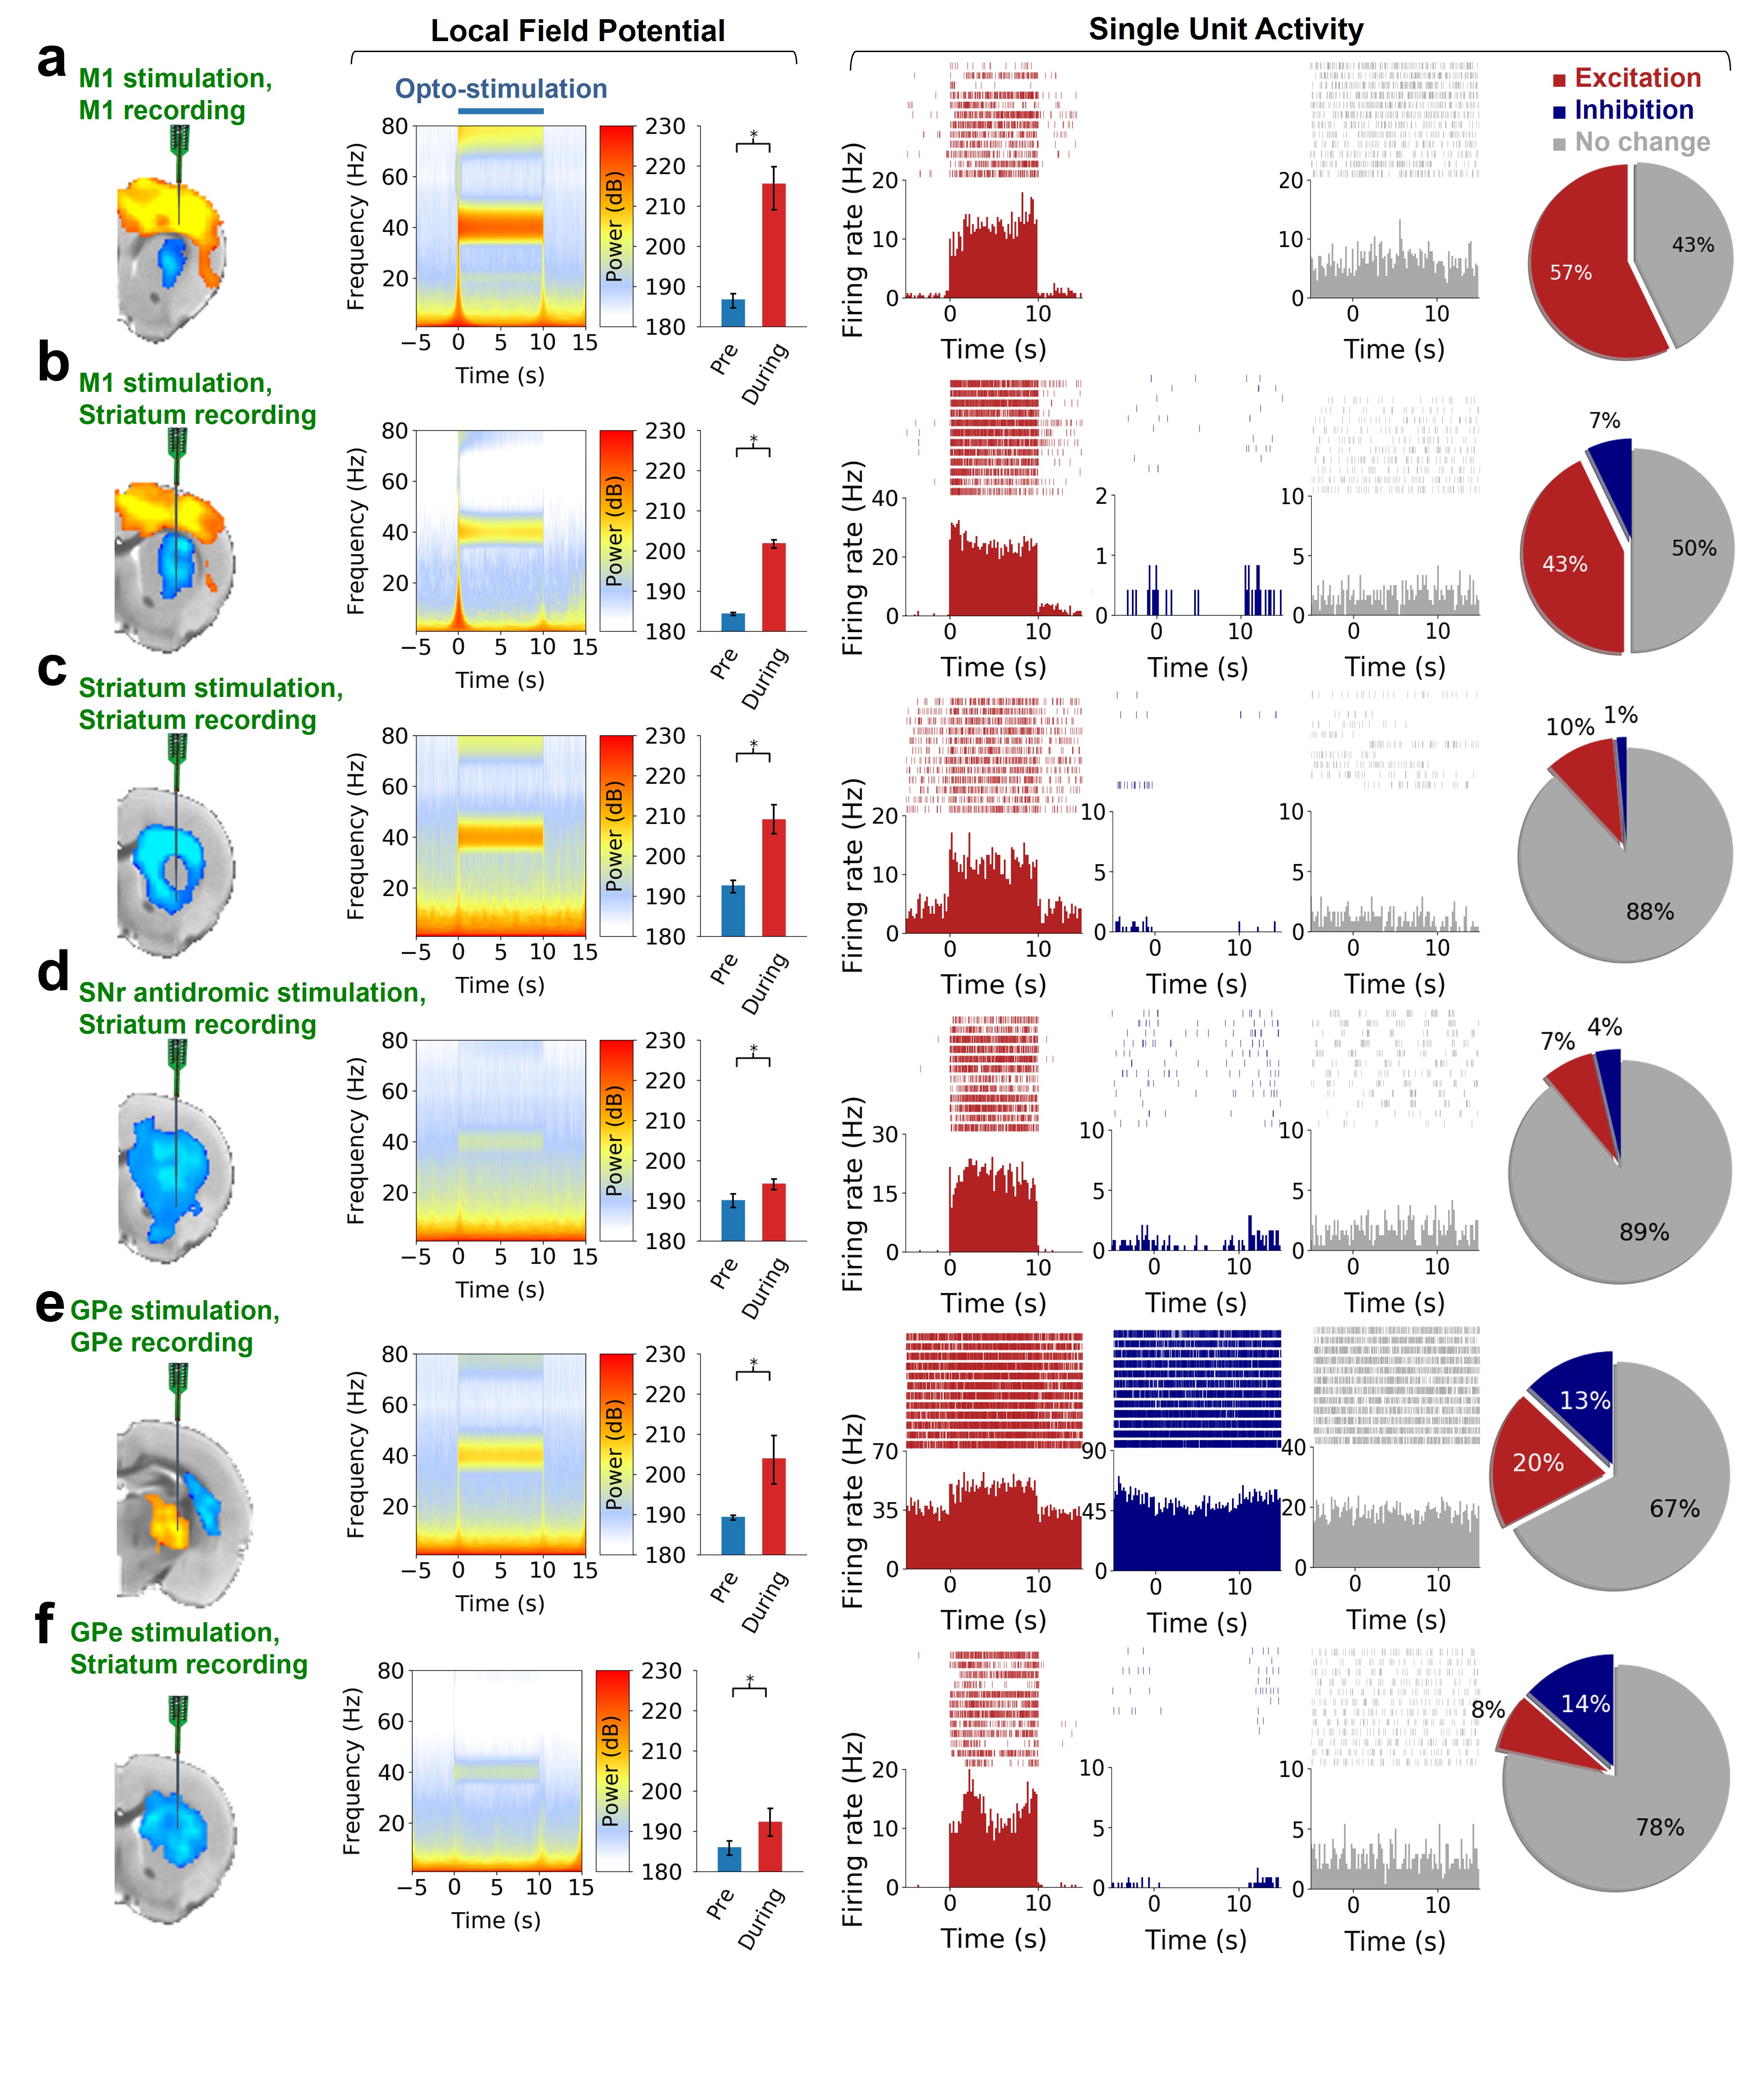
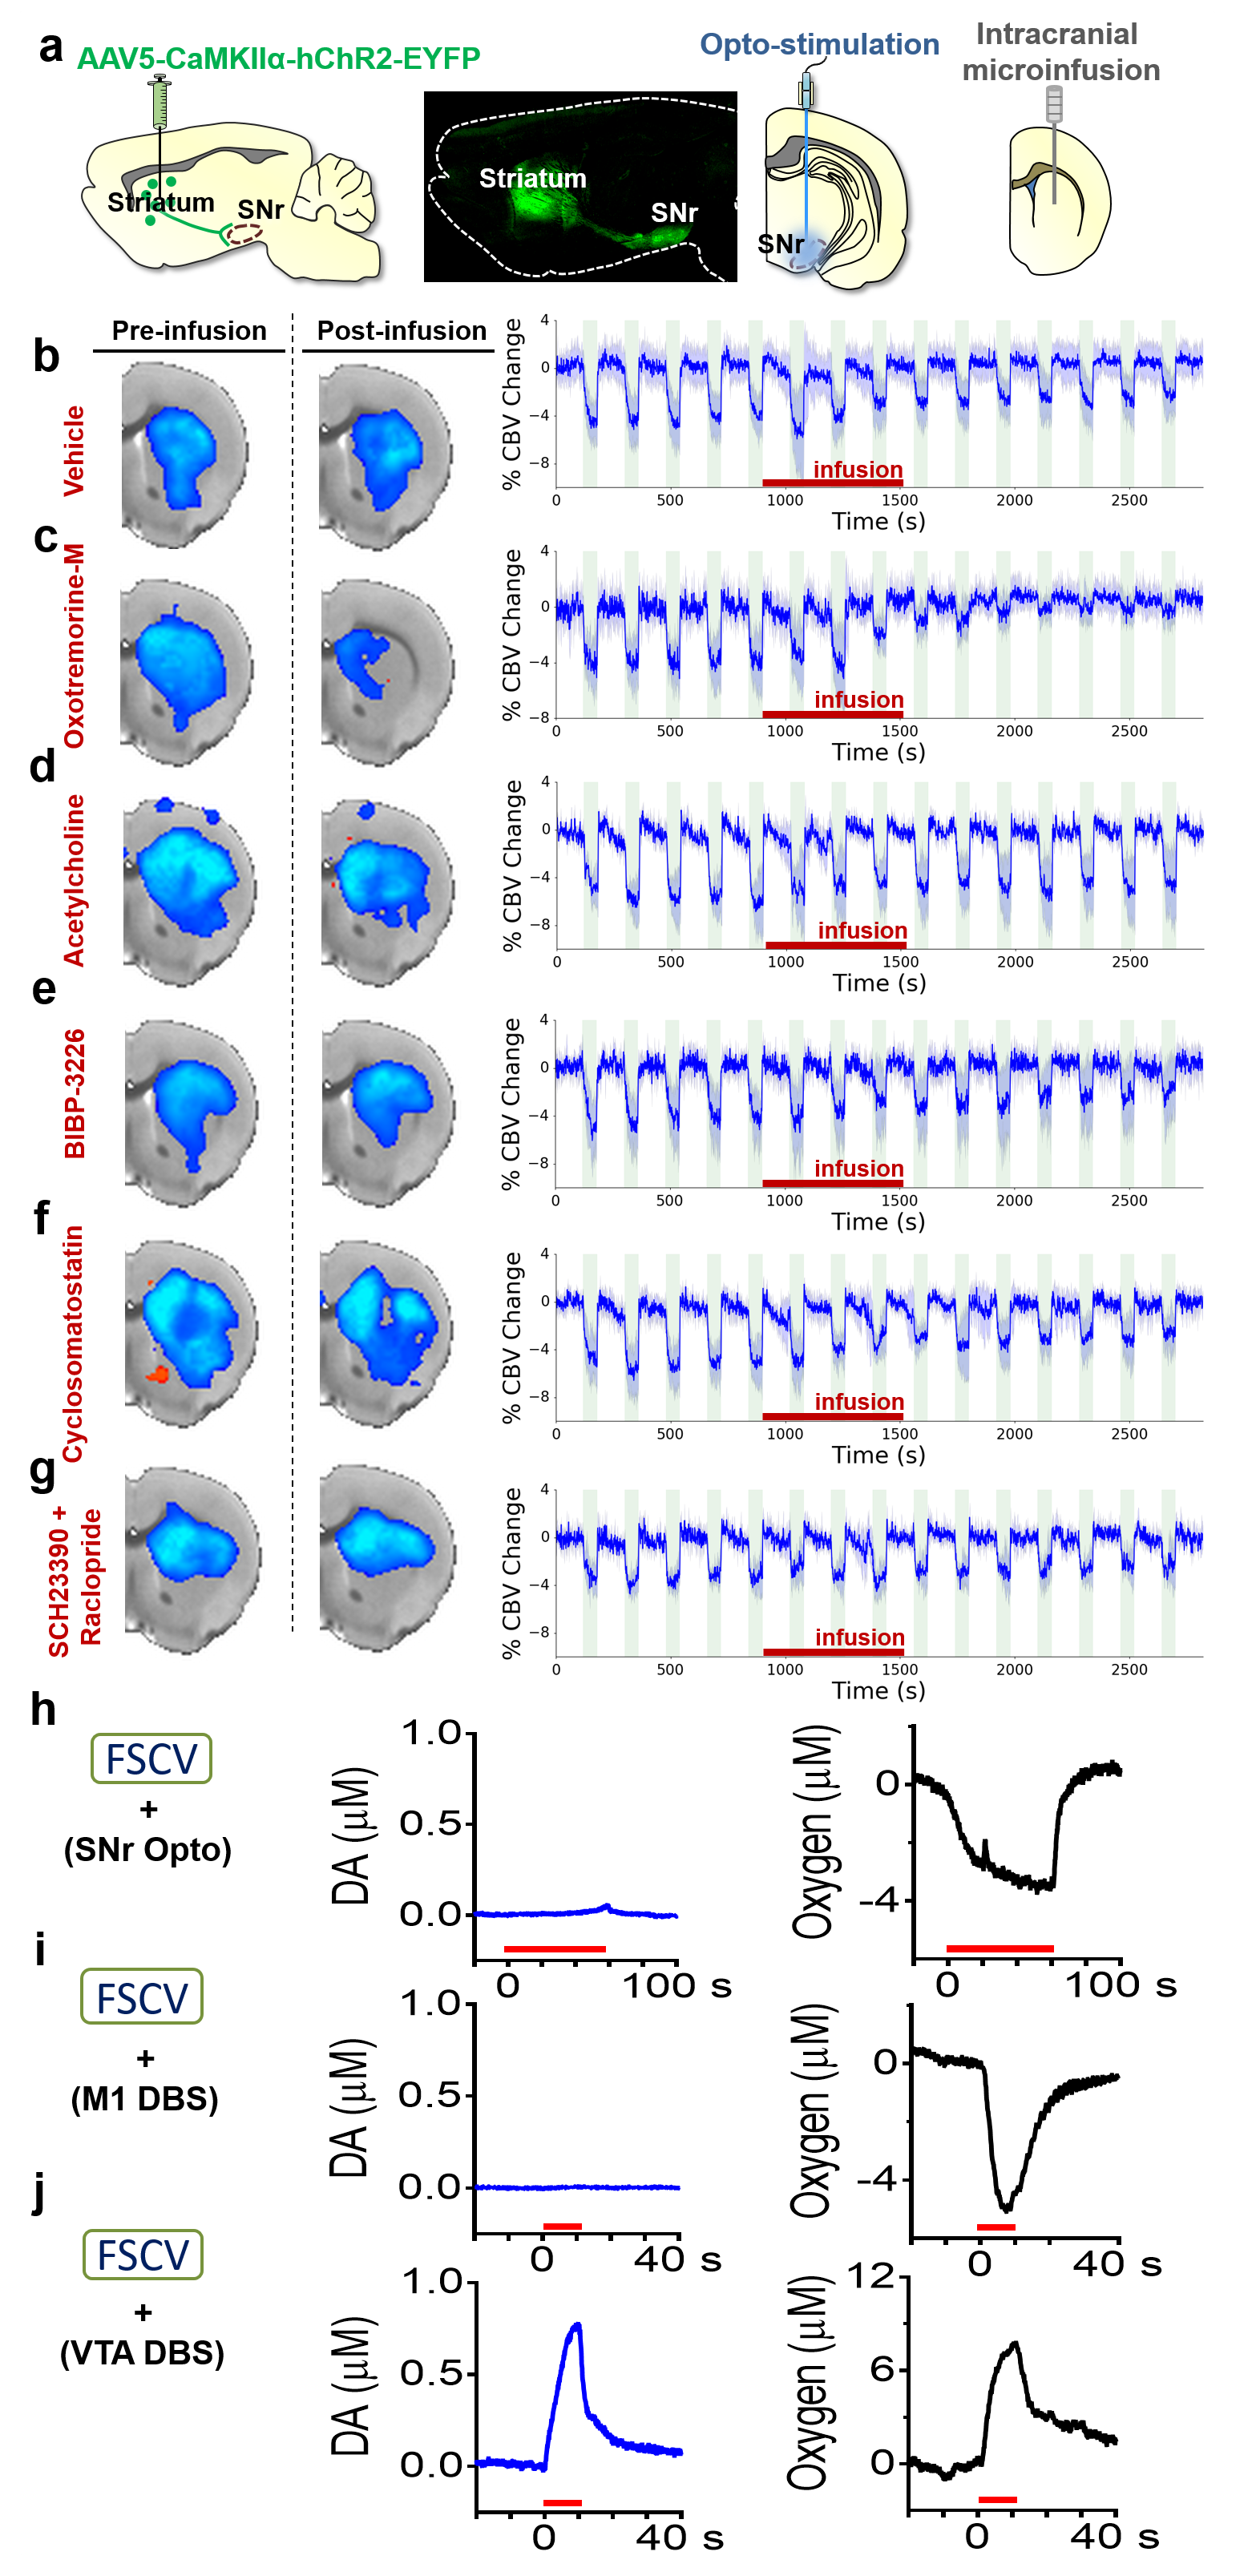
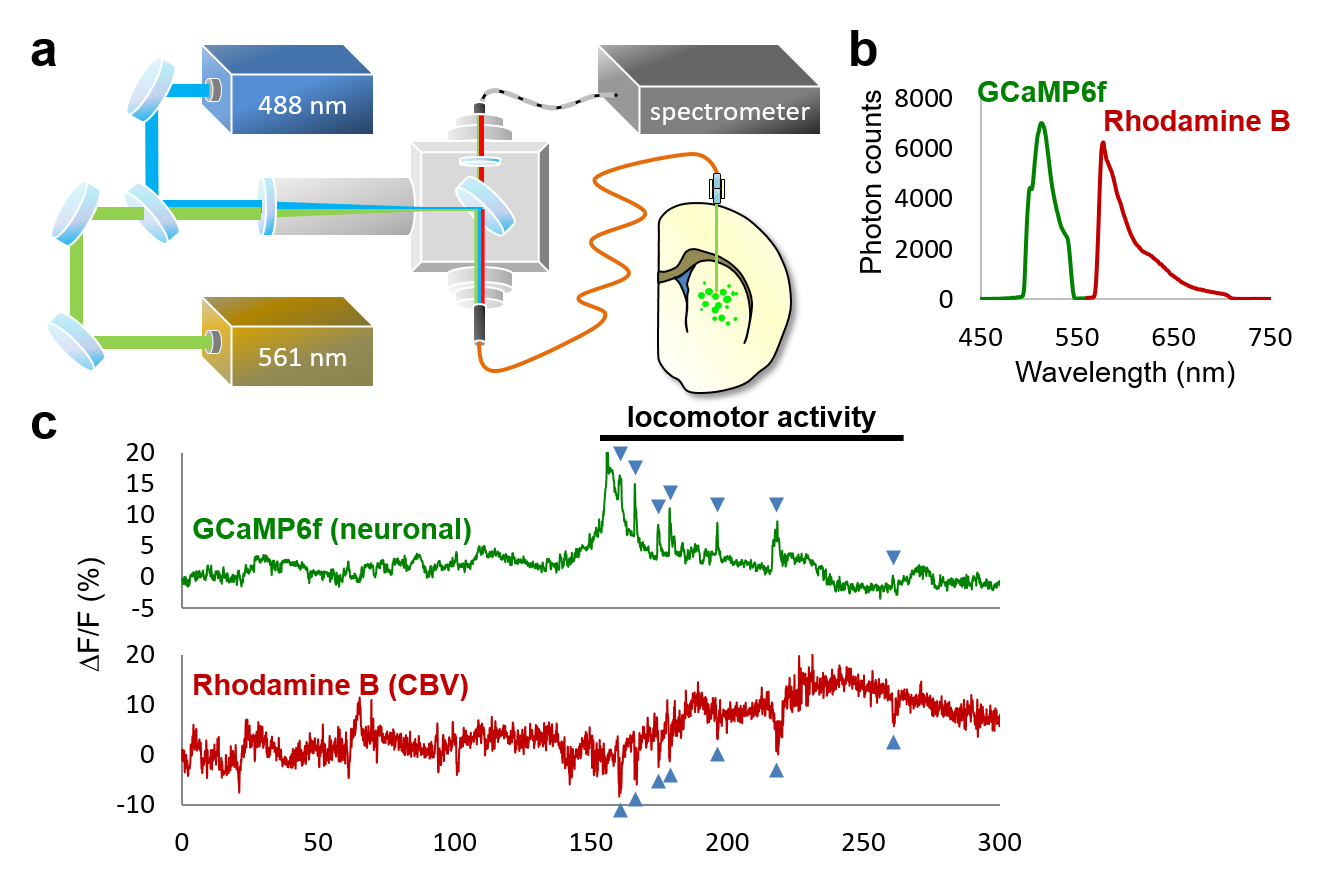
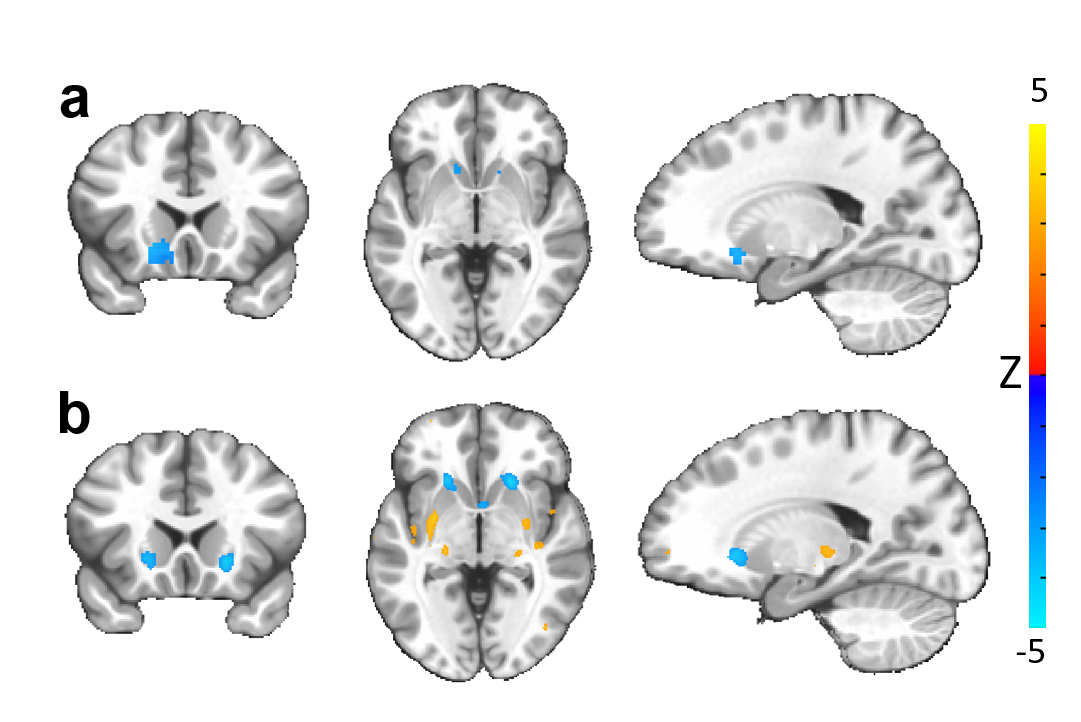
Our optogenetic-fMRI studies (Figure 1) revealed several circuits capable of driving robust negative CBV changes in the striatum, including: stimulation of direct excitatory input to striatum via the parafascicular thalamus (Pf) and primary motor cortex (M1),23 indirect excitatory input from the anterior insula,24 direct activation of striatal medium spiny neurons (MSNs), antidromic activation of D1-receptor-expressing-MSNs (D1MSNs) via terminals in substantia nigra pars reticulata (SNr),25 and activation of external globus pallidus (GPe) principle neurons. Only stimulation of DAergic neurons in the ventral tegmental area(VTA)/substantia nigra pars compacta in TH-Cre rats evoked a positive CBV response. We used acute electrophysiology to record neuronal activity during a subset of optogenetic stimulation procedures (Figure 2). Increased local field potential (LFP) power in both striatum and respective stimulation sites was observed during stimulation of all targets (M1, striatum, SNr and GPe), and all areas except striatum during GPe stimulation displayed predominantly excitatory single-unit activity. These findings exclude the existence of conventional neurovascular coupling in the striatum. To probe the involvement of DA and other vasoactive neurotransmitters in striatal neurovascular coupling, we utilized intracranial pharmacological-fMRI and FSCV (Figure 3). Negative striatal CBV-fMRI responses were created with antidromic stimulation of D1MSNs via the SNr to bypass confounding light/heating artifacts in fMRI.26,27 Compared to vehicle, only oxotremorine-M, an M4 muscarinic ACh receptor agonist,28,29 attenuated the negative response. ACh infusions had no effect, suggesting that MSN activity is responsible. Furthermore, antagonists of the vasoconstrictors somatostatin or neuropeptide-Y, released by persistent, low-threshold spiking (LTS) interneurons,30-33 had no effect. D1R+D2R antagonist cocktail also had no effect. FSCV revealed that optogenetic antidromic SNr-D1MSN stimulation and M1 DBS evoke negative tissue oxygen without DA concentration changes, while VTA DBS evokes positive oxygen and positive DA. Thus, negative striatal fMRI signals are likely downstream of MSN activity, but not cholinergic or LTS interneurons or DA, and positive signals are downstream of DA. We used multispectral fiber-photometry to measure striatal CBV and D2MSN activity simultaneously in awake A2A-Cre mice (Figure 4). Spontaneous locomotor activityevoked simultaneous increases in D2MSN activity with local CBV decreases, indicating that negative striatal CBV can be downstream of D1MSN and D2MSN activity. Finally, we found a bilateral negative striatal fMRI response to bilateral median nerve TENS, and an ipsilateral negative response in striatum to TMS at the left posterior middle frontal gyrus in humans (Figure 5). This indicates that atypical striatal neurovascular coupling is conserved across conditions and species, and should translate to humans.CONCLUSION
Our results suggest revising interpretation of positive fMRI responses in the striatum from neuronal activation to DA release, and negative fMRI responses in the striatum from neuronal inhibition to activation. These findings should apply to other brain areas with atypical coupling, and more broadly to neuroimaging techniques using vascular responses as a surrogate marker of neuronal activity.Acknowledgements
We thank members of the Shih lab for valuable discussions concerning the studies described in this abstract. Our team is supported by NIMH R01MH111429, R41MH113252, R21 MH106939, NINDS R01NS091236, NIAAA U01AA020023, R01AA025582, NICHD U54HD079124, NINDS T32NS007431, NINDS F31NS087909, NIDA F31041104, NHLBI T32HL069768 American Heart Association 15SDG23260025, and Brain & Behavior Research Foundation.References
[1] Shih YY, Chen CC, Shyu BC, Lin ZJ, Chiang YC, Jaw FS, Chen YY & Chang C. A new scenario for negative functional magnetic resonance imaging signals: endogenous neurotransmission. J Neurosci 29, 3036-3044 (2009). [2] Shih YY, Huang S, Chen YY, Lai HY, Kao YC, Du F, Hui ES & Duong TQ. Imaging neurovascular function and functional recovery after stroke in the rat striatum using forepaw stimulation. J Cereb Blood Flow Metab 34, 1483-1492 (2014). [3] Shih YY, Wey HY, De La Garza BH, Duong TQ. Striatal and cortical BOLD, blood flow, blood volume, oxygen consumption, and glucose consumption changes in noxious forepaw electrical stimulation. Journal of Cerebral Blood Flow and Metabolism 2011;31(3):832-841. [4] Harel N, Lee S-P, Nagaoka T, Kim D-S, Kim SG. Origin of Negative Blood Oxygenation Level—Dependent fMRI Signals. Journal of Cerebral Blood Flow and Metabolism 2002;22(8):908-917. [5] Schridde U, Khubchandani M, Motelow JE, Sanganahalli BG, Hyder F, Blumenfeld H. Negative BOLD with large increases in neuronal activity. Cerebral Cortex 2008;18(8):1814-1827. [6] Albaugh DL, Salzwedel A, Van Den Berge N, Gao W, Stuber GD, Shih Y-YI. Functional magnetic resonance imaging of electrical and optogenetic deep brain stimulation at the rat nucleus accumbens. Scientific Reports 2016;6. [7] Albaugh DL, Van Den Berge N, Salzwedel A, Gao W, Stuber GD, Shih YY. Deciphering the Functional Connectome of the External Globus Pallidus with Electrical and Optogenetic Deep Brain Stimulation-fMRI. Proc Intl Soc Mag Reson Med (Oral Presentation; Summa Cum Laude Merit Awarded Abstract), http://wwwismrmorg/16/program_files/O38htm 2016. [8] Decot HK, Namboodiri VM, Gao W, et al. Coordination of Brain-Wide Activity Dynamics by Dopaminergic Neurons. Neuropsychopharmacology 2017;42(3):615-627. [9] Ryali S, Shih YY, Chen T, et al. Combining optogenetic stimulation and fMRI to validate a multivariate dynamical systems model for estimating causal brain interactions. Neuroimage 2016;132:398-405. [10] Shih YY, Chen YY, Lai HY, Kao YC, Shyu BC, Duong TQ. Ultra high-resolution fMRI and electrophysiology of the rat primary somatosensory cortex. Neuroimage 2013;73:113-120. [11] Kristensen EW, Wilson RL, Wightman RM. Dispersion in flow injection analysis measured with microvoltammetric electrodes. Analytical Chemistry 1986;58(4):986-988. [12] Zimmerman JB, Wightman RM. Simultaneous electrochemical measurements of oxygen and dopamine in vivo. Analytical Chemistry (Washington) 1991;63(1):24-28. [13] Cui G, Jun SB, Jin X, et al. Concurrent activation of striatal direct and indirect pathways during action initiation. Nature 2013;494(7436):238-242. [14] Cui G, Jun SB, Jin X, et al. Deep brain optical measurements of cell type-specific neural activity in behaving mice. Nat Protoc 2014;9(6):1213-1228. [15] Smith GV, Alon G, Roys SR, Gullapalli RP. Functional MRI determination of a dose-response relationship to lower extremity neuromuscular electrical stimulation in healthy subjects. Experimental brain research 2003;150(1):33-39. [16] Davis KD, Wood ML, Crawley AP, Mikulis DJ. fMRI of human somatosensory and cingulate cortex during painful electrical nerve stimulation. Neuroreport 1995;7(1):321-325. [17] Liston C, Chen AC, Zebley BD, et al. Default Mode Network Mechanisms of Transcranial Magnetic Stimulation in Depression. Biological Psychiatry 2014;76(7):517-526. [18] Van Den Berge N, Albaugh DL, Salzwedel A, et al. Functional circuit mapping of striatal output nuclei using simultaneous deep brain stimulation and fMRI. Neuroimage 2017;146:1050-1061. [19] Handwerker DA, Gonzalez-Castillo J, D'esposito M, Bandettini PA. The continuing challenge of understanding and modeling hemodynamic variation in fMRI. Neuroimage2012;62(2):1017-1023. [20] Buxton RB. Dynamic models of BOLD contrast. Neuroimage 2012;62(2):953-961. [21] Lai HY, Albaugh DL, Kao YC, Younce JR, Shih YY. Robust deep brain stimulation functional MRI procedures in rats and mice using an MR-compatible tungsten microwire electrode. Magn Reson Med 2015;73(3):1246-1251. [22] Shih YY, Yash TV, Rogers B, Duong TQ. fMRI of deep brain stimulation at the rat ventral posteromedial thalamus. Brain stimulation 2014. [23] Huerta-Ocampo I, Mena-Segovia J, Bolam JP. Convergence of cortical and thalamic input to direct and indirect pathway medium spiny neurons in the striatum. Brain Structure & Function 2014;219(5):1787-1800. [24] Haber SN. The primate basal ganglia: parallel and integrative networks. Journal of Chemical Neuroanatomy 2003;26(4):317-330. [25] Lanciego JL, Luquin N, Obeso JA. Functional Neuroanatomy of the Basal Ganglia. Cold Spring Harbor Perspectives in Medicine 2012;2(12):a009621. [26] Christie IN, Wells JA, Southern P, et al. fMRI response to blue light delivery in the naive brain: Implications for combined optogenetic fMRI studies. Neuroimage 2012;66C:634-641. [27] Rungta RL, Osmanski BF, Boido D, Tanter M, Charpak S. Light controls cerebral blood flow in naive animals. Nat Commun 2017;8:14191. [28] Kosillo P, Zhang YF, Threlfell S, Cragg SJ. Cortical Control of Striatal Dopamine Transmission via Striatal Cholinergic Interneurons. Cereb Cortex 2016. [29] Shin JH, Adrover MF, Wess J, Alvarez VA. Muscarinic regulation of dopamine and glutamate transmission in the nucleus accumbens. Proc Natl Acad Sci U S A 2015;112(26):8124-8129. [30] Gittis AH, Nelson AB, Thwin MT, Palop JJ, Kreitzer AC. Distinct roles of GABAergic interneurons in the regulation of striatal output pathways. J Neurosci 2010;30(6):2223-2234. [31] Gittis AH, Kreitzer AC. Striatal microcircuitry and movement disorders. Trends Neurosci 2012;35(9):557-564. [32] Uhlirova H, Kilic K, Tian P, et al. Cell type specificity of neurovascular coupling in cerebral cortex. Elife 2016;5. [33] Long JB, Rigamonti DD, Dosaka K, Kraimer JM, Martinez-Arizala A. Somatostatin causes vasoconstriction, reduces blood flow and increases vascular permeability in the rat central nervous system. J Pharmacol Exp Ther 1992;260(3):1425-1432.Figures