0046
Covariation of pulse oximetry amplitude and BOLD fMRI across vigilance states1NIH, Bethesda, MD, United States
Synopsis
While pulse oximetry (PO) is often used with fMRI to provide the timing of heart beats, few studies have focused on fluctuations in the amplitude of PO waveform in the context of fMRI signals. Here, we examine correlations between spontaneous fMRI signals and PO amplitude (POA) variations, observing a strong dependence on vigilance state. During alertness, POA-fMRI correlations were weaker but encompassed regions comprising the default-mode network. During drowsiness and NREM sleep, POA co-varied extensively with BOLD signals across the brain.
Introduction
Spontaneous BOLD signal fluctuations are known to covary with low-frequency fluctuations in peripheral physiology, including respiration volume and cardiac rate1-4. Pulse oximetry (PO) is commonly used to measure the timing of heart beats during fMRI; in contrast, much less attention has been devoted to the amplitude of the PO waveform in the context of fMRI, where it has been noted to have weak and inconsistent correlations with fMRI signals5. However, given that physiological processes are altered with vigilance levels, and that PO amplitude can be modulated with changes in sympathetic activity6-7, it is possible that the properties of PO amplitude variations (and its relationship with BOLD fMRI) may depend on vigilance state. Here, we characterize the association between PO amplitude (“POA”) and BOLD fMRI across vigilance states.Methods
fMRI Data: fMRI data were acquired in human subjects at 3T, and were drawn from two separate datasets. One consisted of scans conducted during resting state (no task) or with a sparse auditory vigilance task (binaural tones with ISI=35s±6s); TR=2.1s; resolution=3mm isotropic; duration=24.5min or 15min; 10 scans total, from 4 subjects. For all scans, subjects were instructed to keep eyes open and maintain fixation, and an infrared camera was used to monitor the eye behavior so as to derive a behavioral measure of vigilance8. Epochs of high and low arousal were defined as contiguous sections wherein the eyes remained open for >70% of the time (‘alert’, 75min total) or closed for >70% of the time (‘drowsy’, 33.21min total).
To investigate a wider range of vigilance states, we also incorporated data from an overnight EEG-fMRI sleep protocol (TR=3s, resolution=2mm isotropic) that was manually sleep-scored in 30s epochs9. We selected periods of data comprising either (a) frequent fluctuation between wake and stage-1 sleep, indicating drowsiness (36.7min total, from 2 subjects); (b) extended bouts of stage-2 sleep (45.7min total, from 3 subjects).
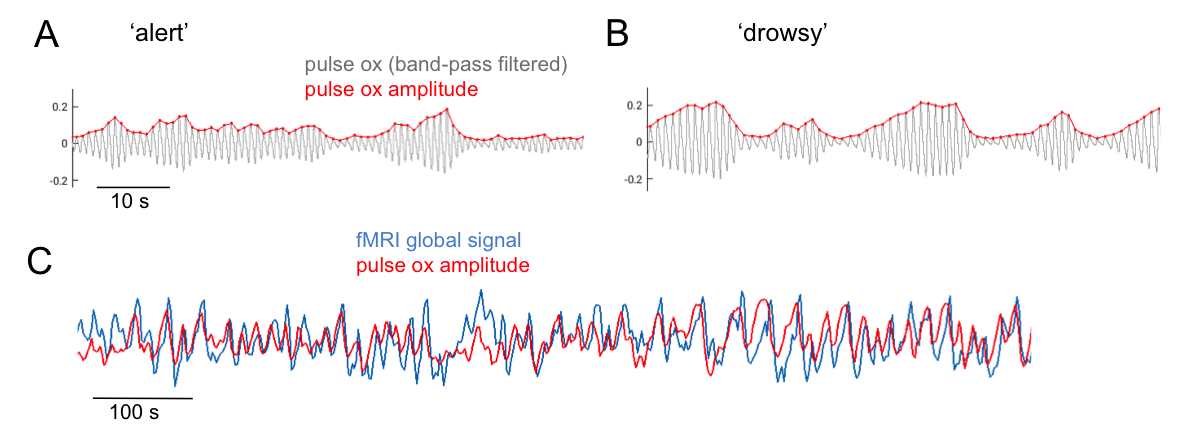
POA regressor: A signal reflecting the envelope of pulse oximetry variations (Fig. 1) recorded at the fingertip was formed by taking the moving standard deviation of the band-pass filtered (0.5-3Hz) PO waveform within a 6-s time window centered at each fMRI TR. Similar results were obtained when averaging the peak-to-trough distance of pulse waves falling within the same windows.
fMRI preprocessing consisted of motion co-registration, nuisance regression (motion parameters and 1-4th order temporal trends), spatial smoothing (4mm FWHM), and alignment to MNI space. In task scans, stimulus presentation and behavioral responses were also regressed out.
Results
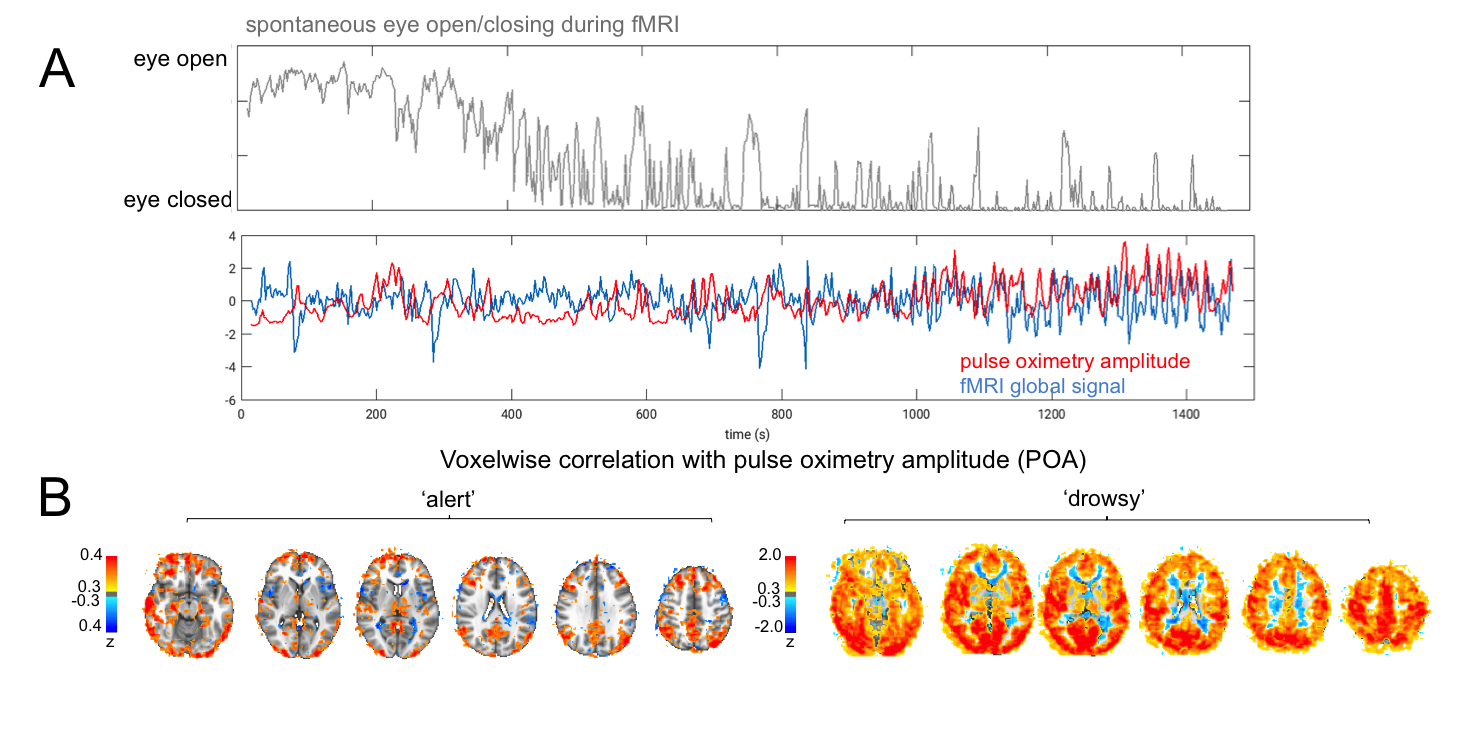
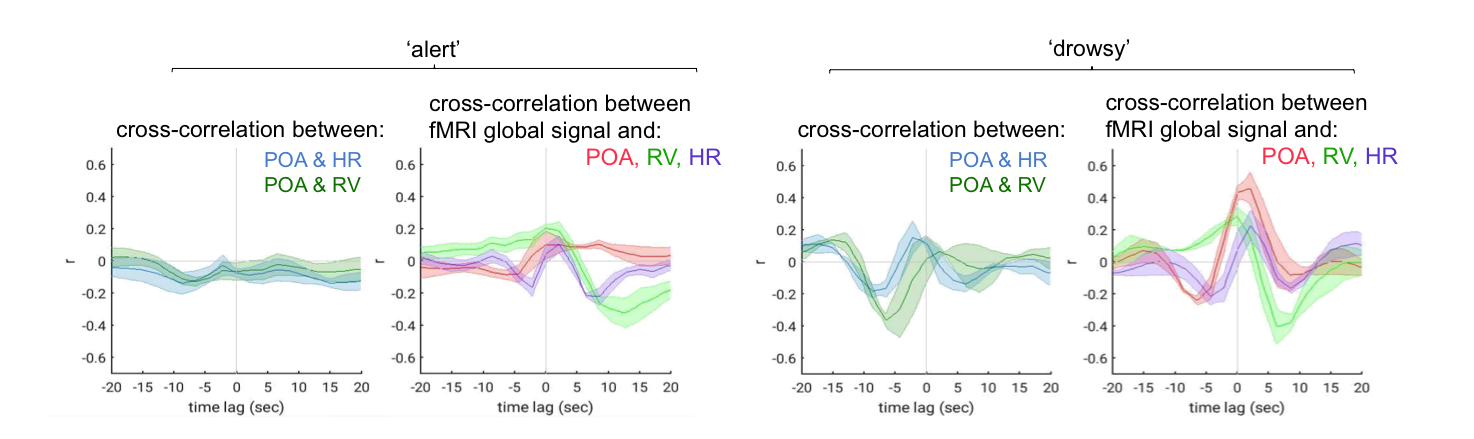
The pulse oximetry waveform exhibits fluctuations in amplitude that can correlate with BOLD fMRI signals (Fig. 1). Notably, the correlation between POA and fMRI appeared to depend heavily on vigilance state (Fig. 2). During periods of high vigilance, POA-fMRI correlations were weaker and more variable, but could be observed most reliably in areas including the default-mode network; anti-correlations were found in bilateral insula. By contrast, during epochs of lower vigilance, POA fluctuations increased in magnitude and were correlated widely with fMRI signals across gray matter, particularly in primary sensory areas, with opposite polarity in white matter. Correlations between POA, respiration volume, and heart rate also increased during low vigilance (Fig. 3).
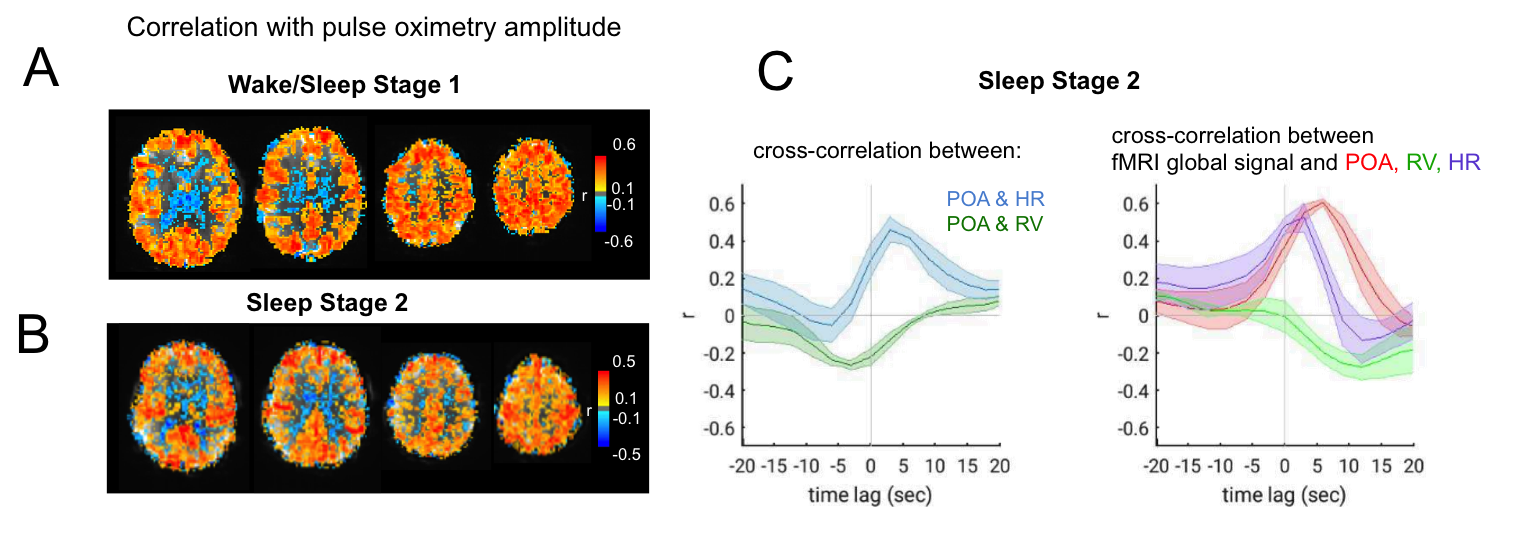
Additional data from sleep scans further supported these observations. During epochs with frequent bouts of Stage-1 sleep as well as during extended Stage-2 sleep (Fig. 4A), POA-fMRI correlation closely resembled those attributed to a “drowsy” state in the data of Fig. 4B. In Stage 2, we also observed that POA appeared more closely linked to heart rate than to respiration, and that the correlation between POA and fMRI exceeded that between respiration volume and fMRI.
Discussion
We demonstrate that variations in the pulse oximetry envelope can exhibit substantial correlation with fMRI signal fluctuations. However, the characteristics of the POA and its covariation with BOLD signals appears to depend closely on vigilance state, potentially explaining inconsistencies reported in previous literature. During apparent alertness, POA-fMRI correlations were weaker but encompassed regions comprising the default-mode network. During drowsiness and NREM sleep, POA co-varies strongly with fMRI signals across the brain. In NREM sleep, POA variations may relate to transient arousals linked with peripheral vasoconstriction (e.g. ref.7 and further supported by its link with heart rate in the present study). We are investigating the prominent white-matter anticorrelations in separate work.
The modulation of POA with vigilance suggests that it may provide useful information for discerning vigilance state during fMRI. Further, the increased coherence between POA, respiration, heart rate, and BOLD signals observed during low vigilance suggests that increased peripheral physiological modulation may contribute, in part, to the increased BOLD signal coherence and amplitude previously observed in drowsiness and light sleep (e.g.10).
Acknowledgements
References
1. Wise, R.G., et al., Resting fluctuations in arterial carbon dioxide induce significant low frequency variations in BOLD signal. Neuroimage, 2004. 21(4): p. 1652-64.
2. Birn, R.M., et al., Separating respiratory-variation-related fluctuations from neuronal-activity-related fluctuations in fMRI. Neuroimage, 2006. 31(4): p. 1536-48.
3. Shmueli, K., et al., Low-frequency fluctuations in the cardiac rate as a source of variance in the resting-state fMRI BOLD signal. Neuroimage, 2007. 38(2): p. 306-20.
4. Tong, Y., et al., Low-frequency oscillations measured in the periphery with near-infrared spectroscopy are strongly correlated with blood oxygen level-dependent functional magnetic resonance imaging signals. J Biomed Opt, 2012. 17(10): p. 106004.
5. Power, J.D., et al., Sources and implications of whole-brain fMRI signals in humans. Neuroimage, 2017. 146: p. 609-625.
6. Delessert, A., et al., Pulse wave amplitude drops during sleep are reliable surrogate markers of changes in cortical activity. Sleep, 2010. 33(12): p. 1687-92.
7. Ackner, B. and G. Pampiglione, Some relationships between peripheral vasomotor and E.E.G. changes. J Neurol Neurosurg Psychiatry, 1957. 20(1): p. 58-64.
8. Chang, C., et al., Tracking brain arousal fluctuations with fMRI. Proc Natl Acad Sci U S A, 2016. 113(16): p. 4518-23.
9. Iber C, A.-I. S., Chesson AL Jr., Quan SF. AASM manual for the scoring of sleep and associated events: Rules, terminology and technical specifications. (American Academy of Sleep Medicine, 2007).
10. Fukunaga, M., et al., Large-amplitude, spatially correlated fluctuations in BOLD fMRI signals during extended rest and early sleep stages. Magn Reson Imaging, 2006. 24(8): p. 979-92.
Figures