0045
Ultra-high resolution multi-shell dMRI and tractography of the ex vivo human brain using kT-dSTEAM at 9.4T1Cognitive Neuroscience, Maastricht University, Maastricht, Netherlands
Synopsis
Here we explore the high resolution acquisition of multi-shell and undersampled diffusion data with 9.4T kT-dSTEAM and analysis of such data for crossing fiber tractography. This permits effective usage of both high SNR and diffusion-weighting inherent to data with multiple b-values and shows superior definition of white matter tracks at ultra-high resolution for tractography. In addition, 3D undersampled acquisition allows more room in the trade-off between acquisition time, resolution, b-values and directions.
Introduction
Ex vivo diffusion MRI (dMRI) is an important research tool in the human brain for neuroanatomical investigations1-3 and the validation of in vivo diffusion MRI techniques especially with the crucial context of the complete human brain. We introduced previously the kT-dSTEAM technique for acquiring high resolution diffusion-weighted images of the entire human brain post-mortem. Here we explore 1) the high resolution acquisition of multi-shell and undersampled diffusion data and 2) analysis of such data for crossing fiber tractography.Methods
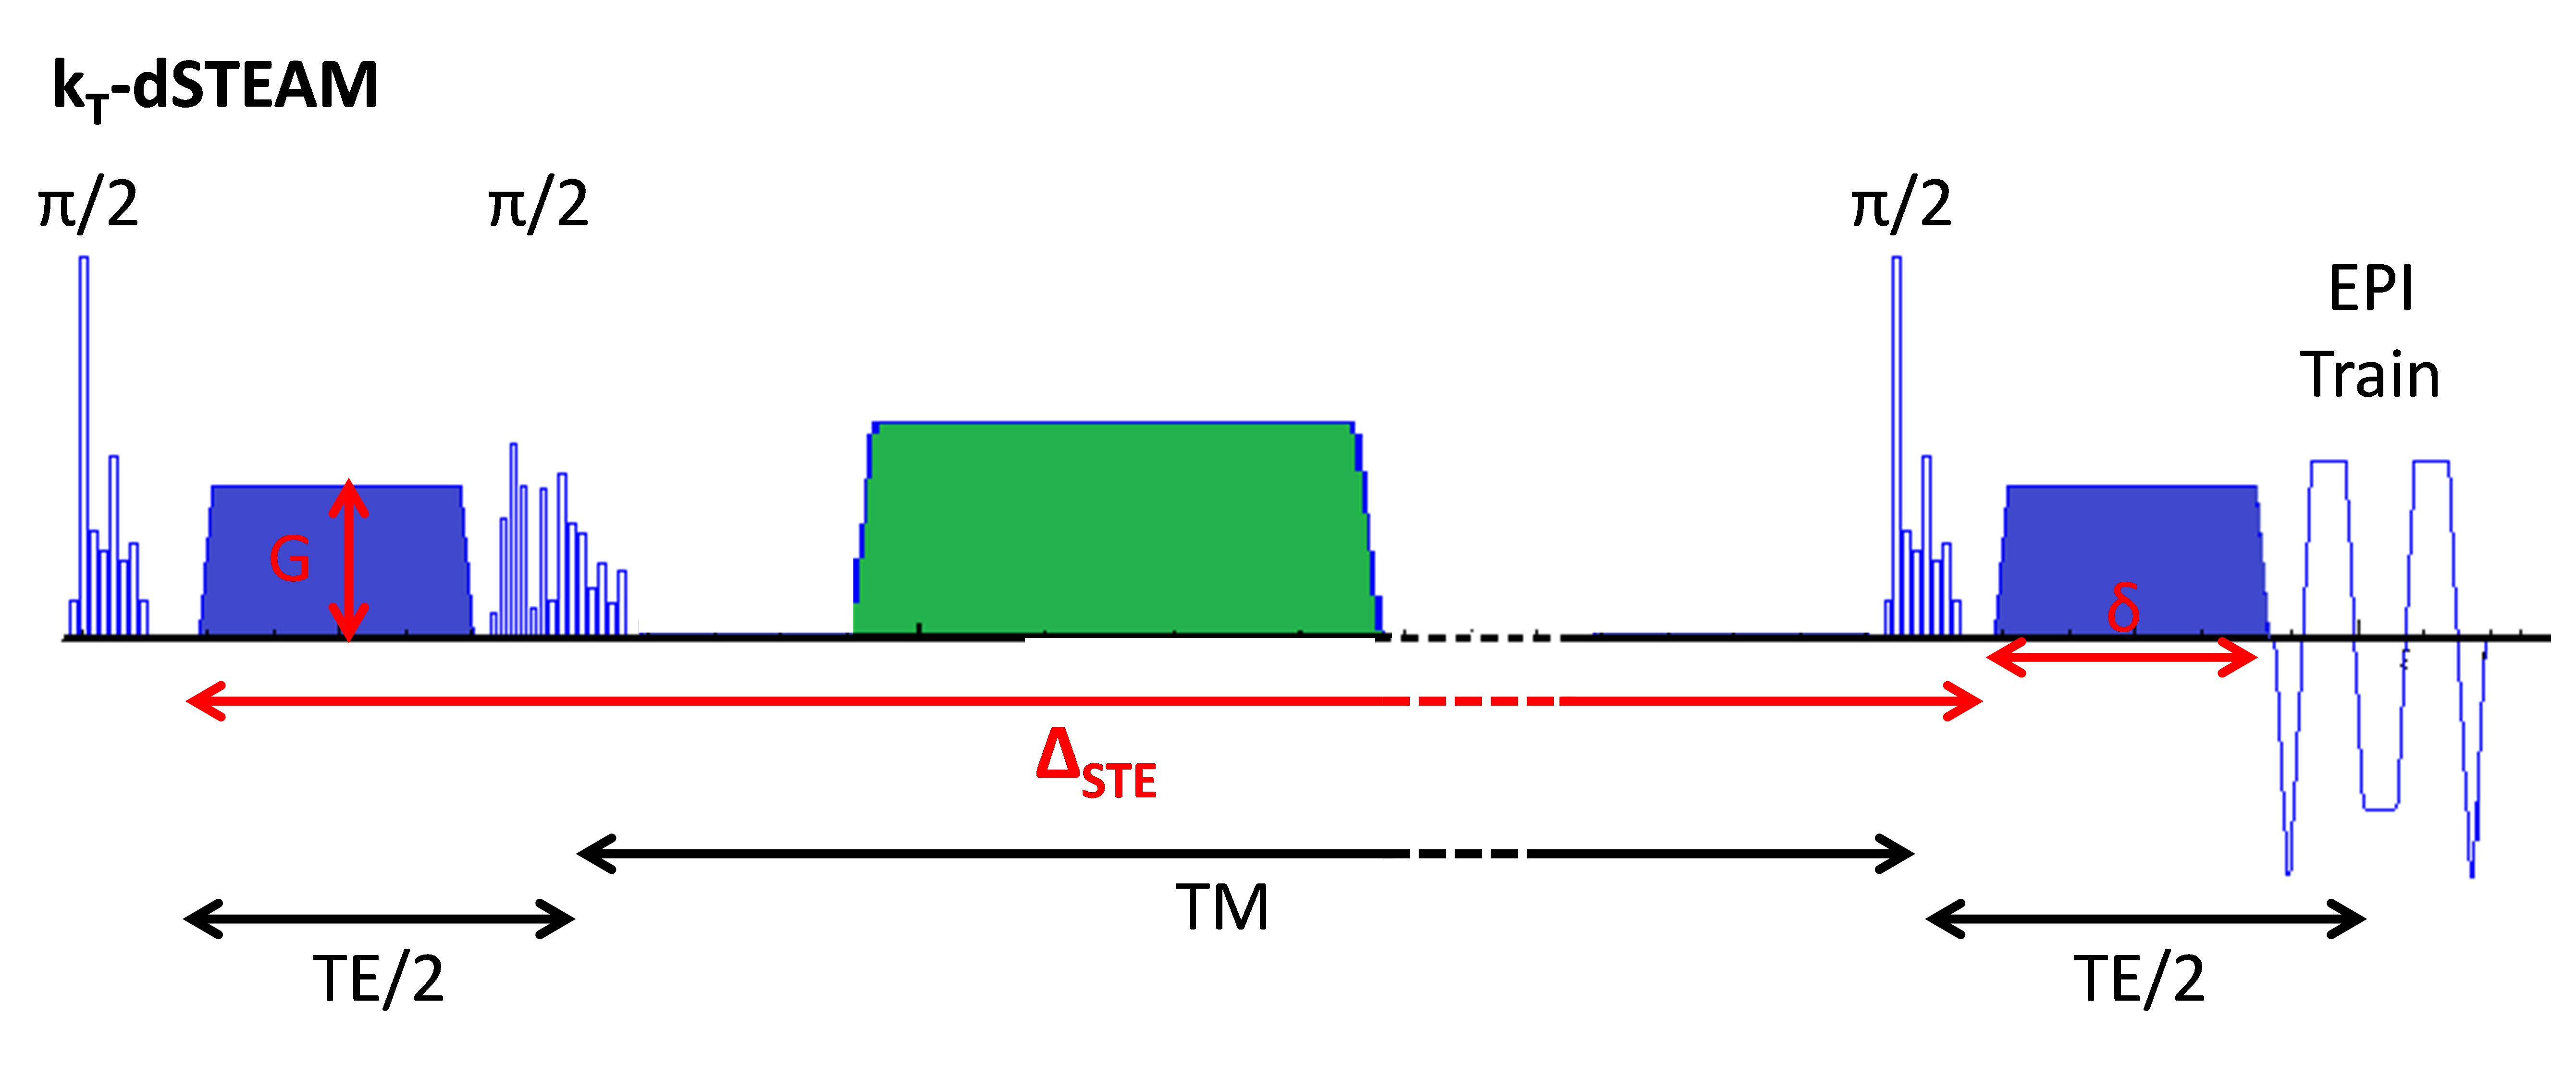
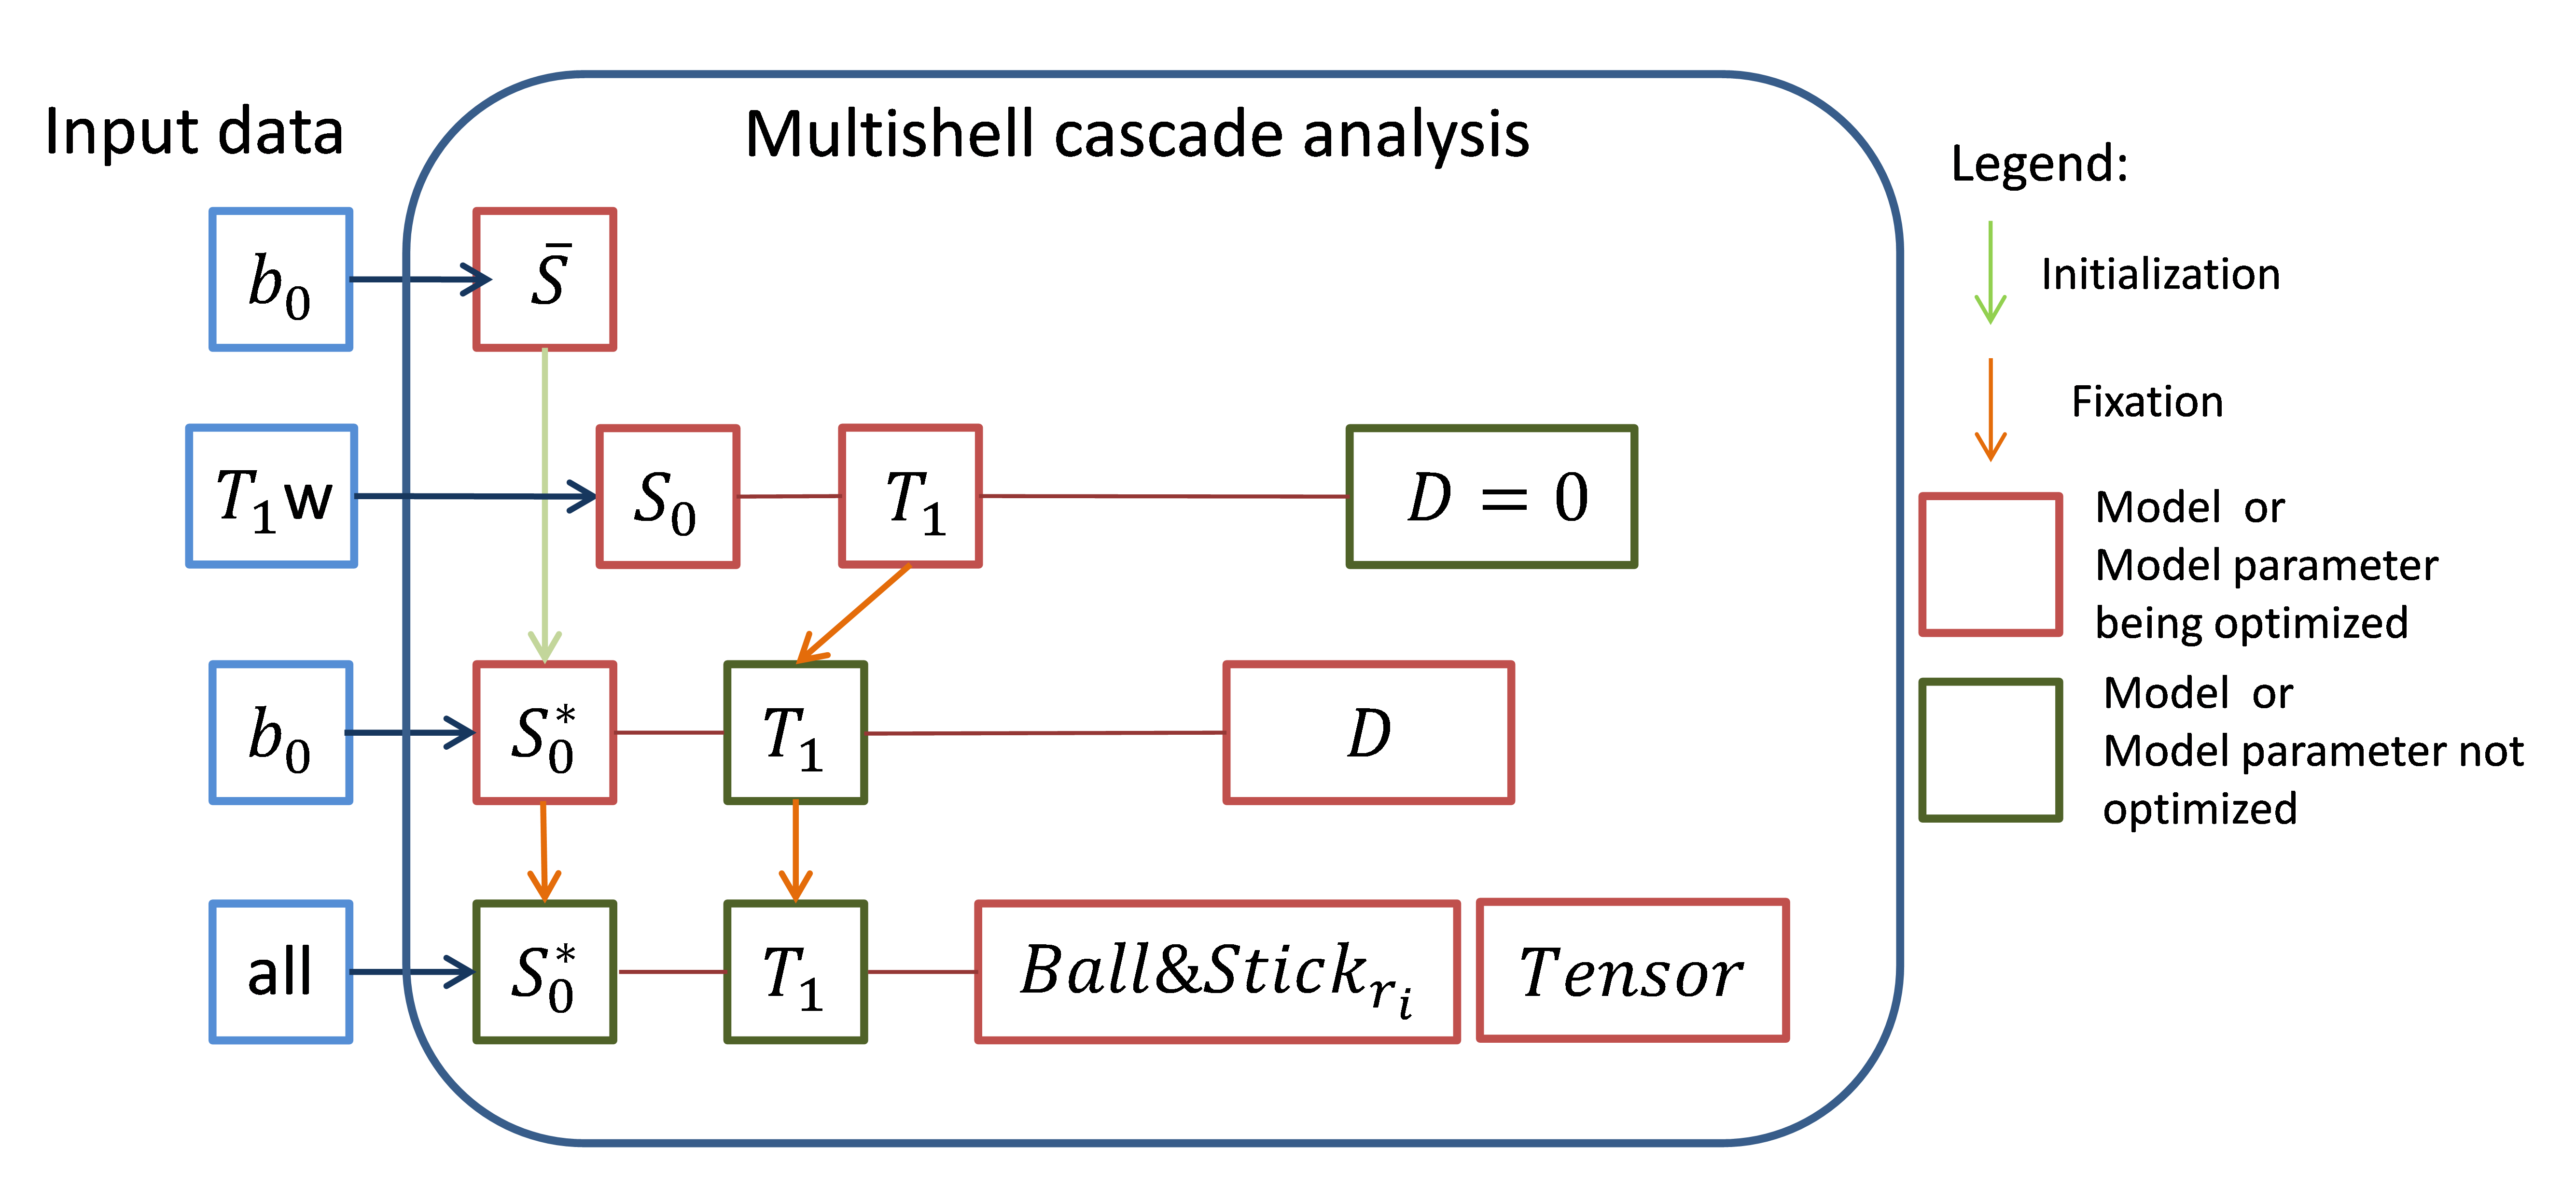
The kT-dSTEAM sequence4-5 is shown in figure 1. kT-dSTEAM was used for multi-shell diffusion data by varying mixing time (TM), spatial resolution, and undersampled acquisition in the EPI readout. High (1000μm isotropic) and ultra-high (500μm isotropic) resolution dMRI was acquired using kT-dSTEAM. One human post-mortem brain from a subject without neurological or psychiatric disease was used, enclosed in a 3D conformal container and inserted into a specialized 9.4T 8Ch parallel transmit (pTx), 24Ch receive RF-coil6. Experiments were performed on a 9.4T 82cm bore human MR system (Magnetom 9.4T, Siemens Healthcare, Erlangen, Germany). Composite Excitation, Storing and Recalling pulses were calculated by kT-points methods using an already established pipeline4,7. Diffusion data was acquired at 1000μm isotropic at b=4000s/mm2 (4k shell), TM=135ms, 36 directions and b=6000s/mm2 (6k shell), TM=205ms, 48 directions, and reconstructed offline as previously described5. For 500μm isotropic diffusion data, shells with b=2000 s/mm2 (2k shell), TM=65ms, 24 directions and b=4000s/mm2 (4k shell), TM=135ms, 36 directions were 2x undersampled along PE direction, and reconstructed offline with the EsPiRit pipeline8 in BART9. Independent qT1 relaxometry data was acquired without diffusion weighting and with TM=60, 90, 120, 260, 340 and 420ms. Data analysis was performed using the Maastricht Diffusion Toolbox (MDT)10 estimating DTI and Ball&Stick_r1&_r2 for the single shells. For the multi-shell analysis, Ball&Stick_r1&_r2 were estimated in a three-step cascade approach which accounts for T1 decay over different TMs (Figure 2) using the qT1 relaxometry4. Bayesian Index Criteria (BIC) model selection10 was performed for number of sticks voxel-wise (Ball&Stick_Sorted) and used for tractography. Deterministic streamline tractography was perfomed using the most collinear local direction, angle threshold of 40deg, 4th-order Runge-Kutta integration and trilinear interpolation.Results and discussion
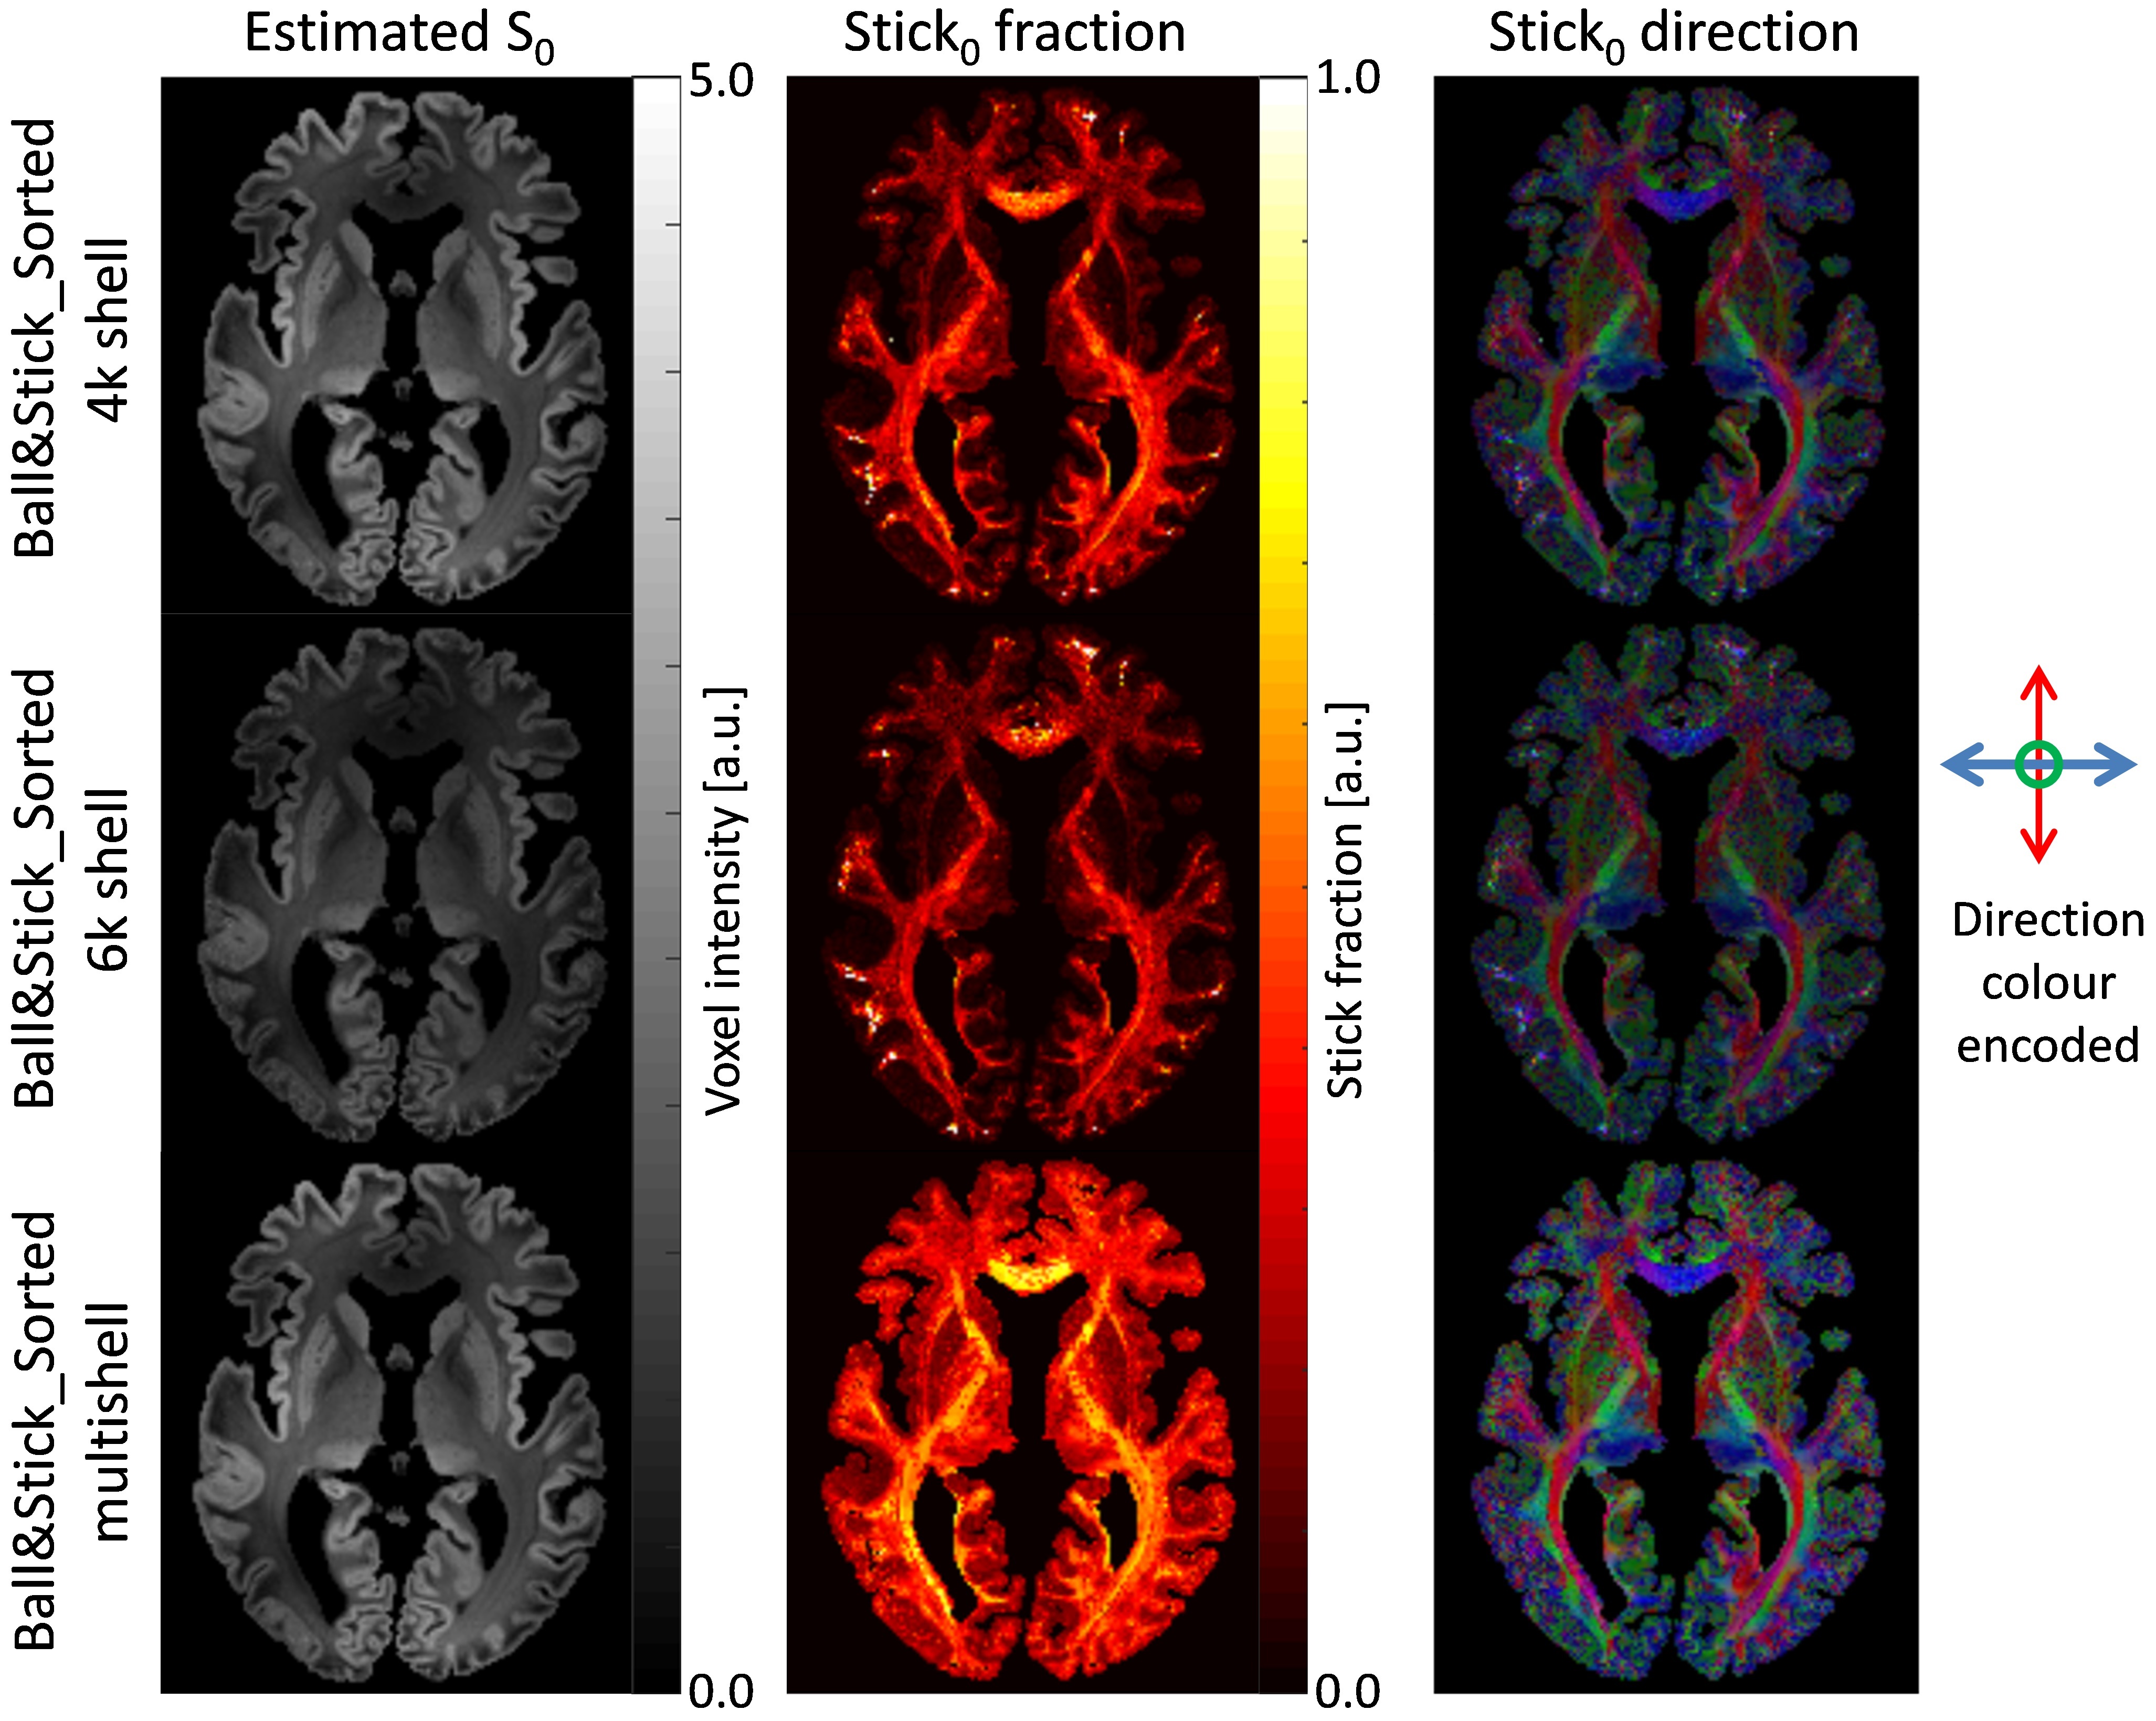
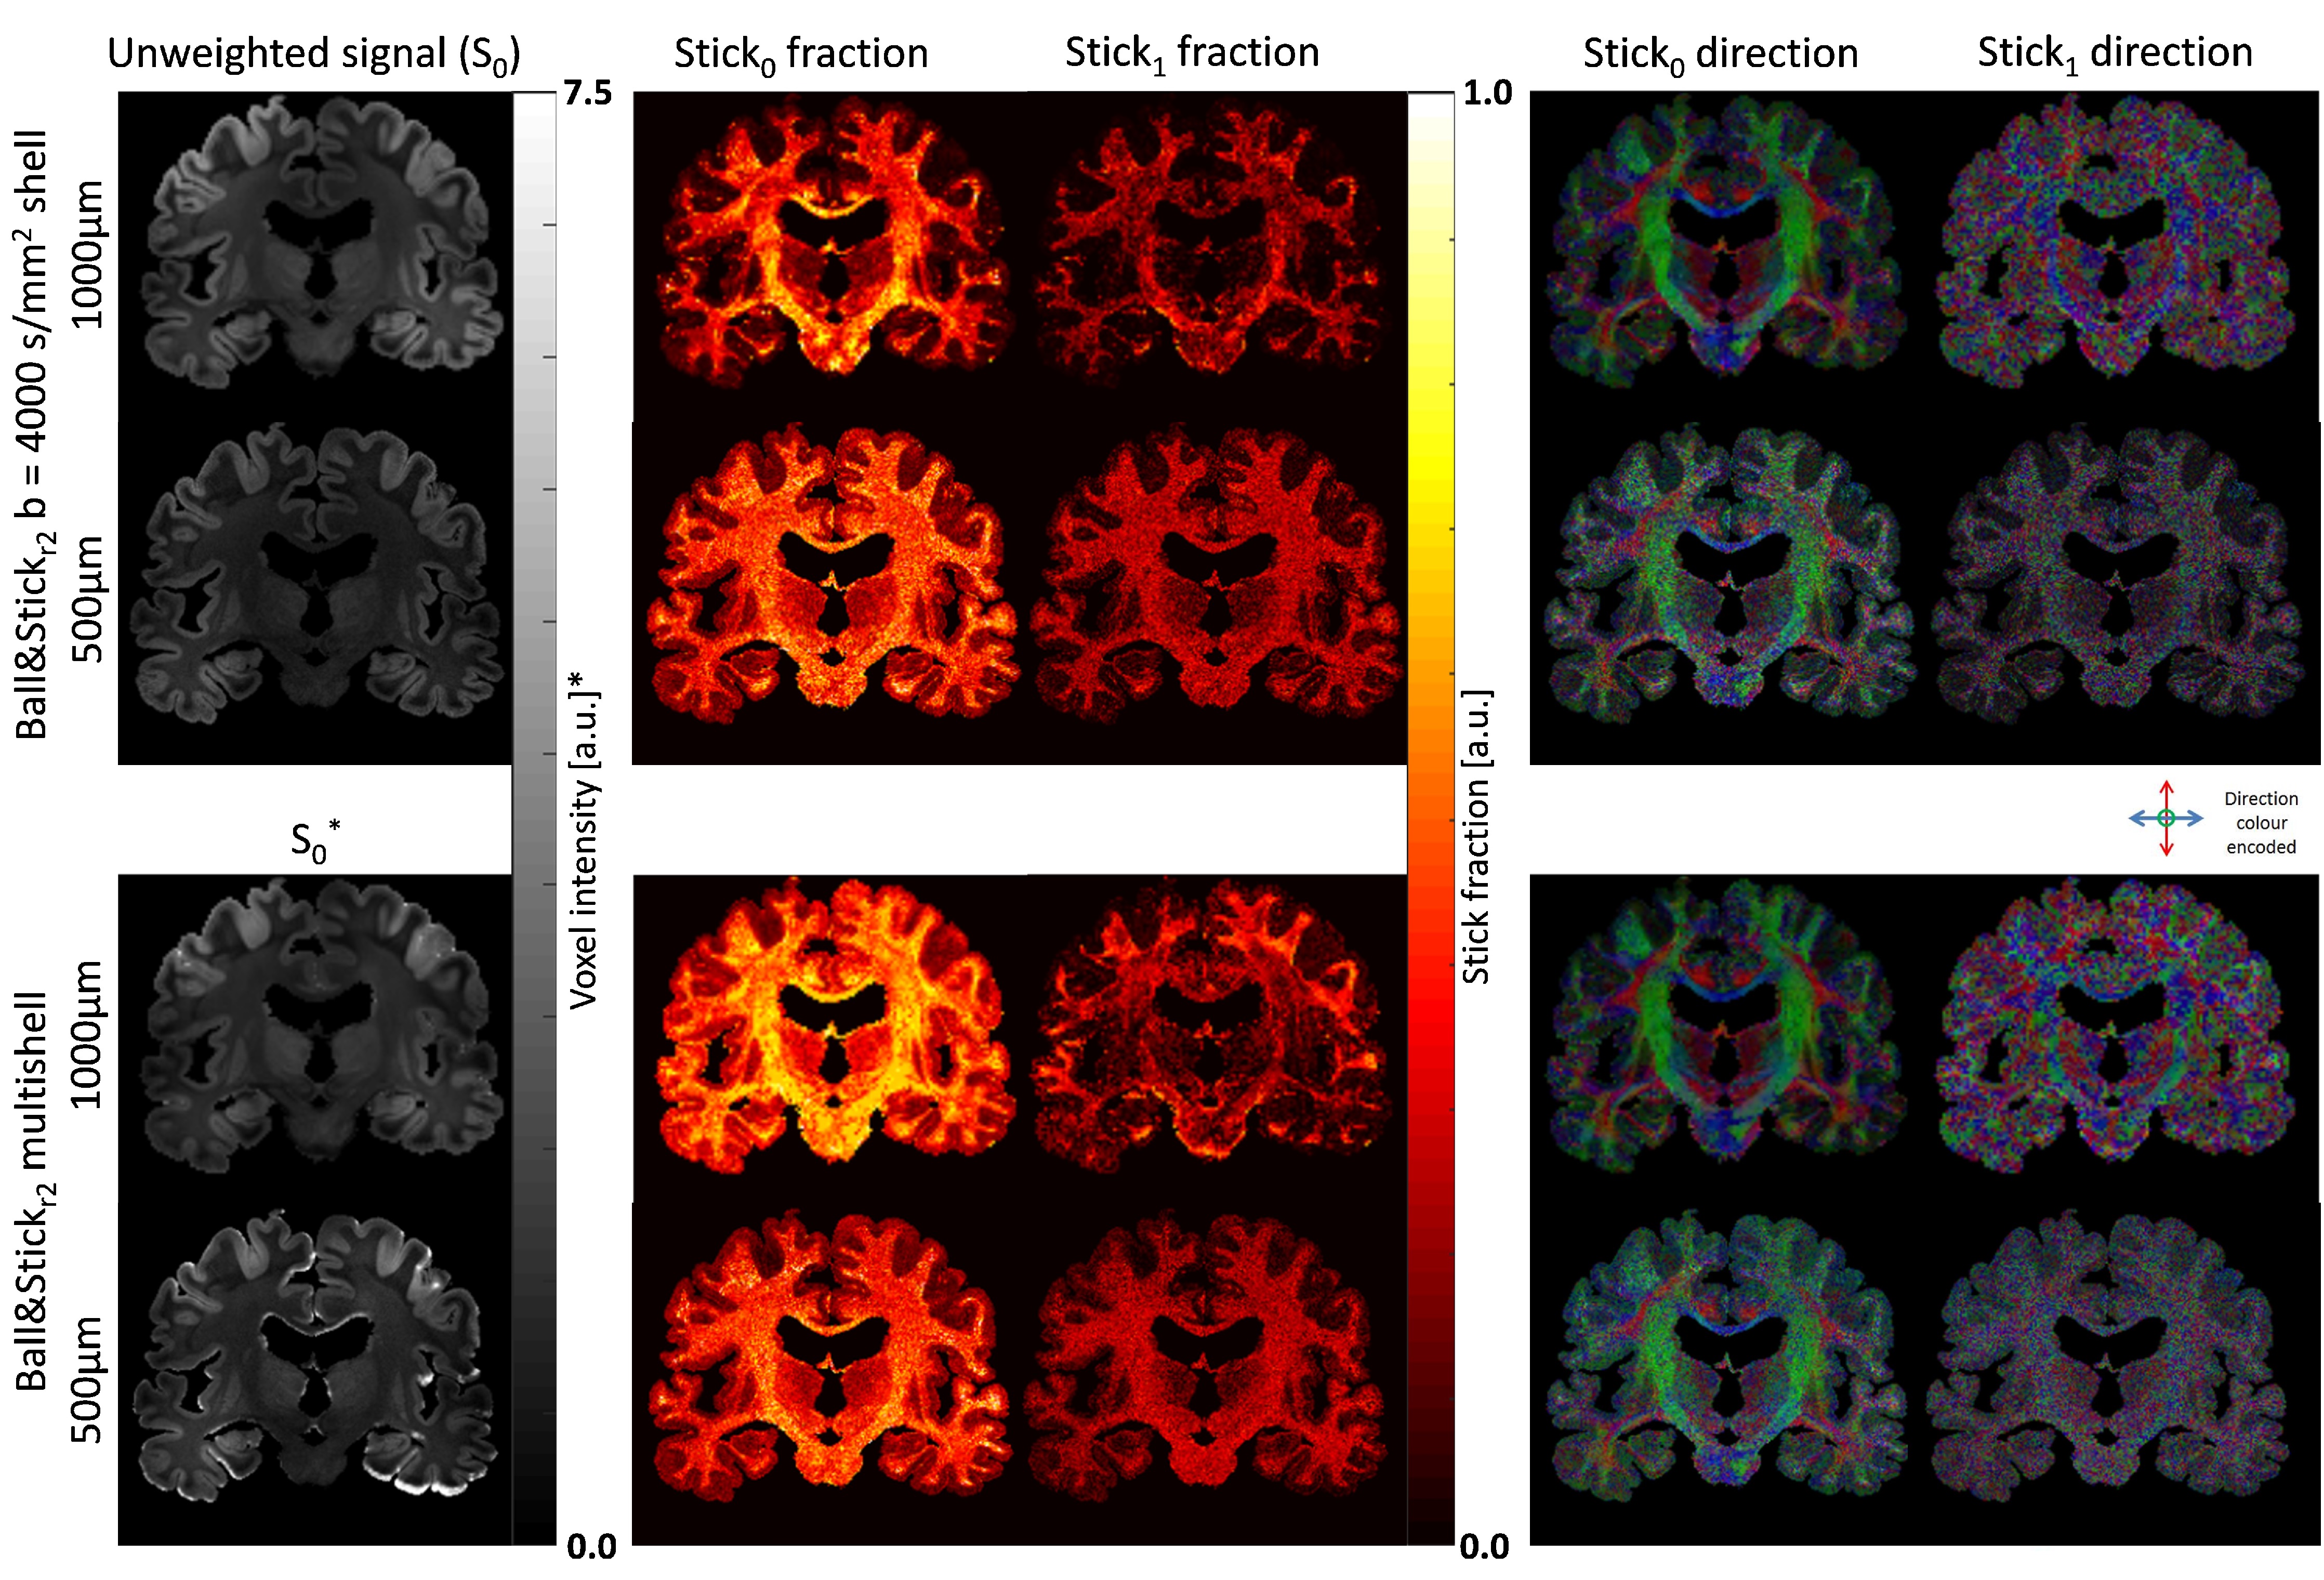
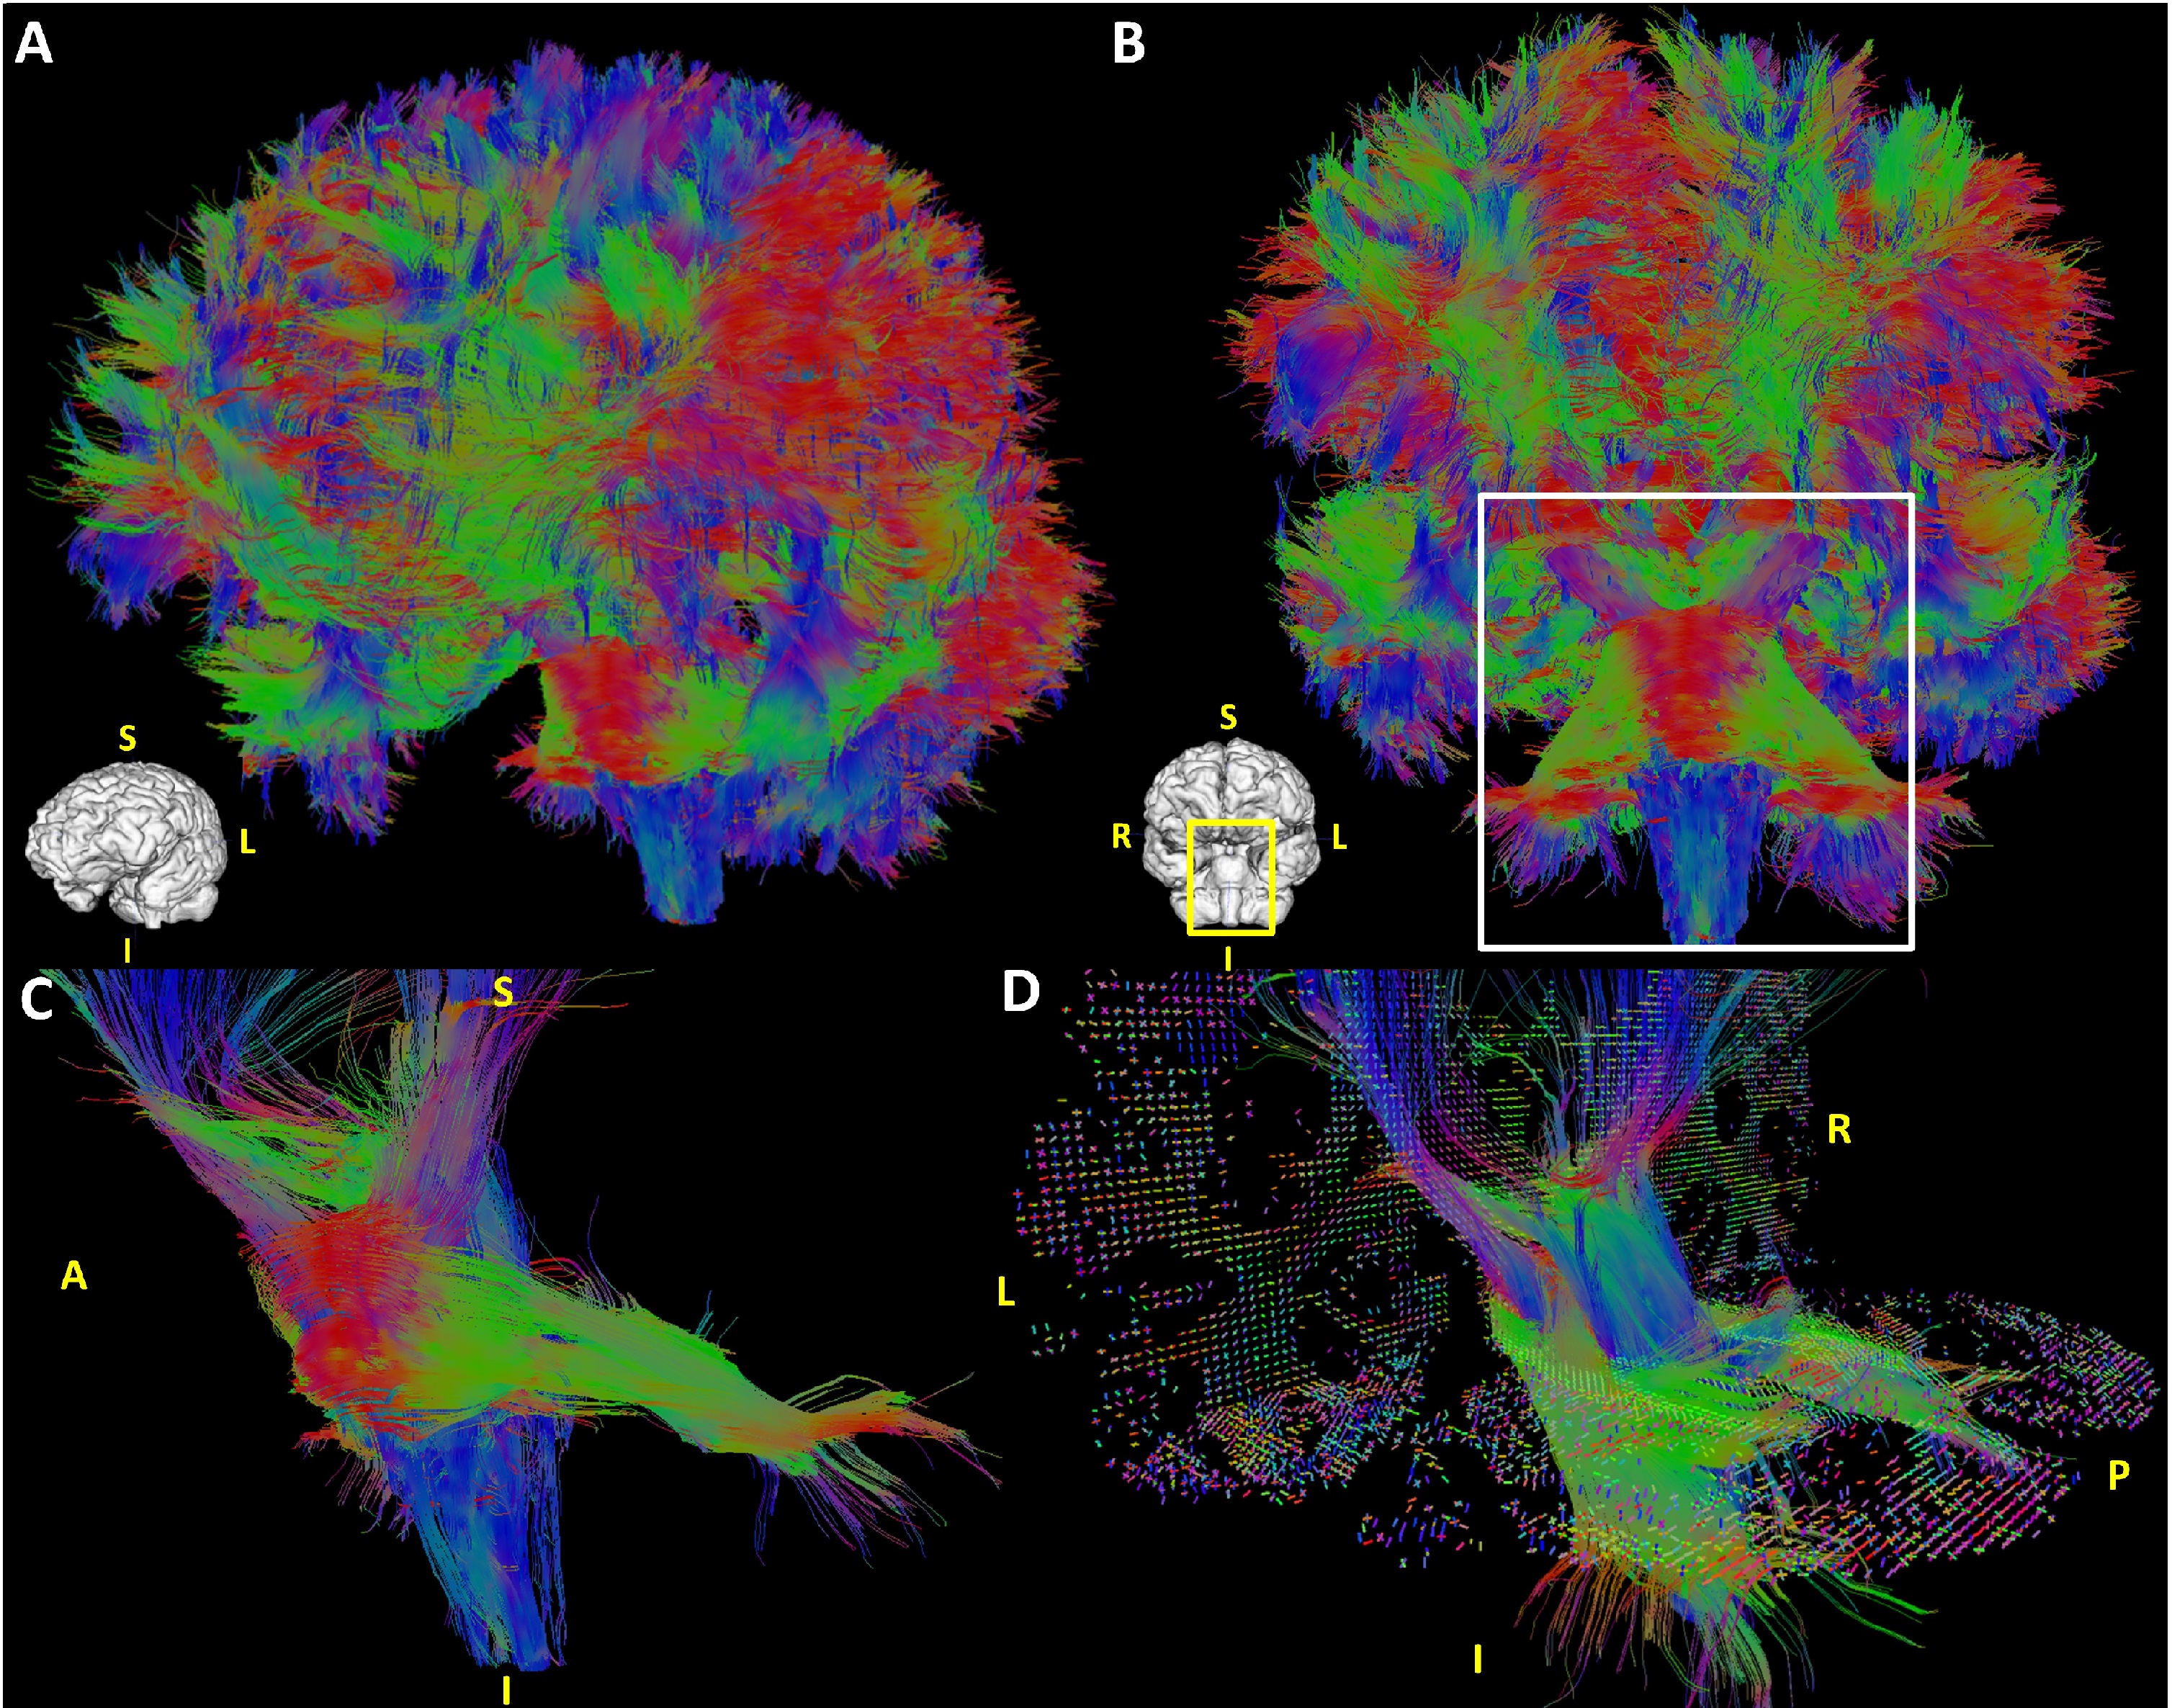
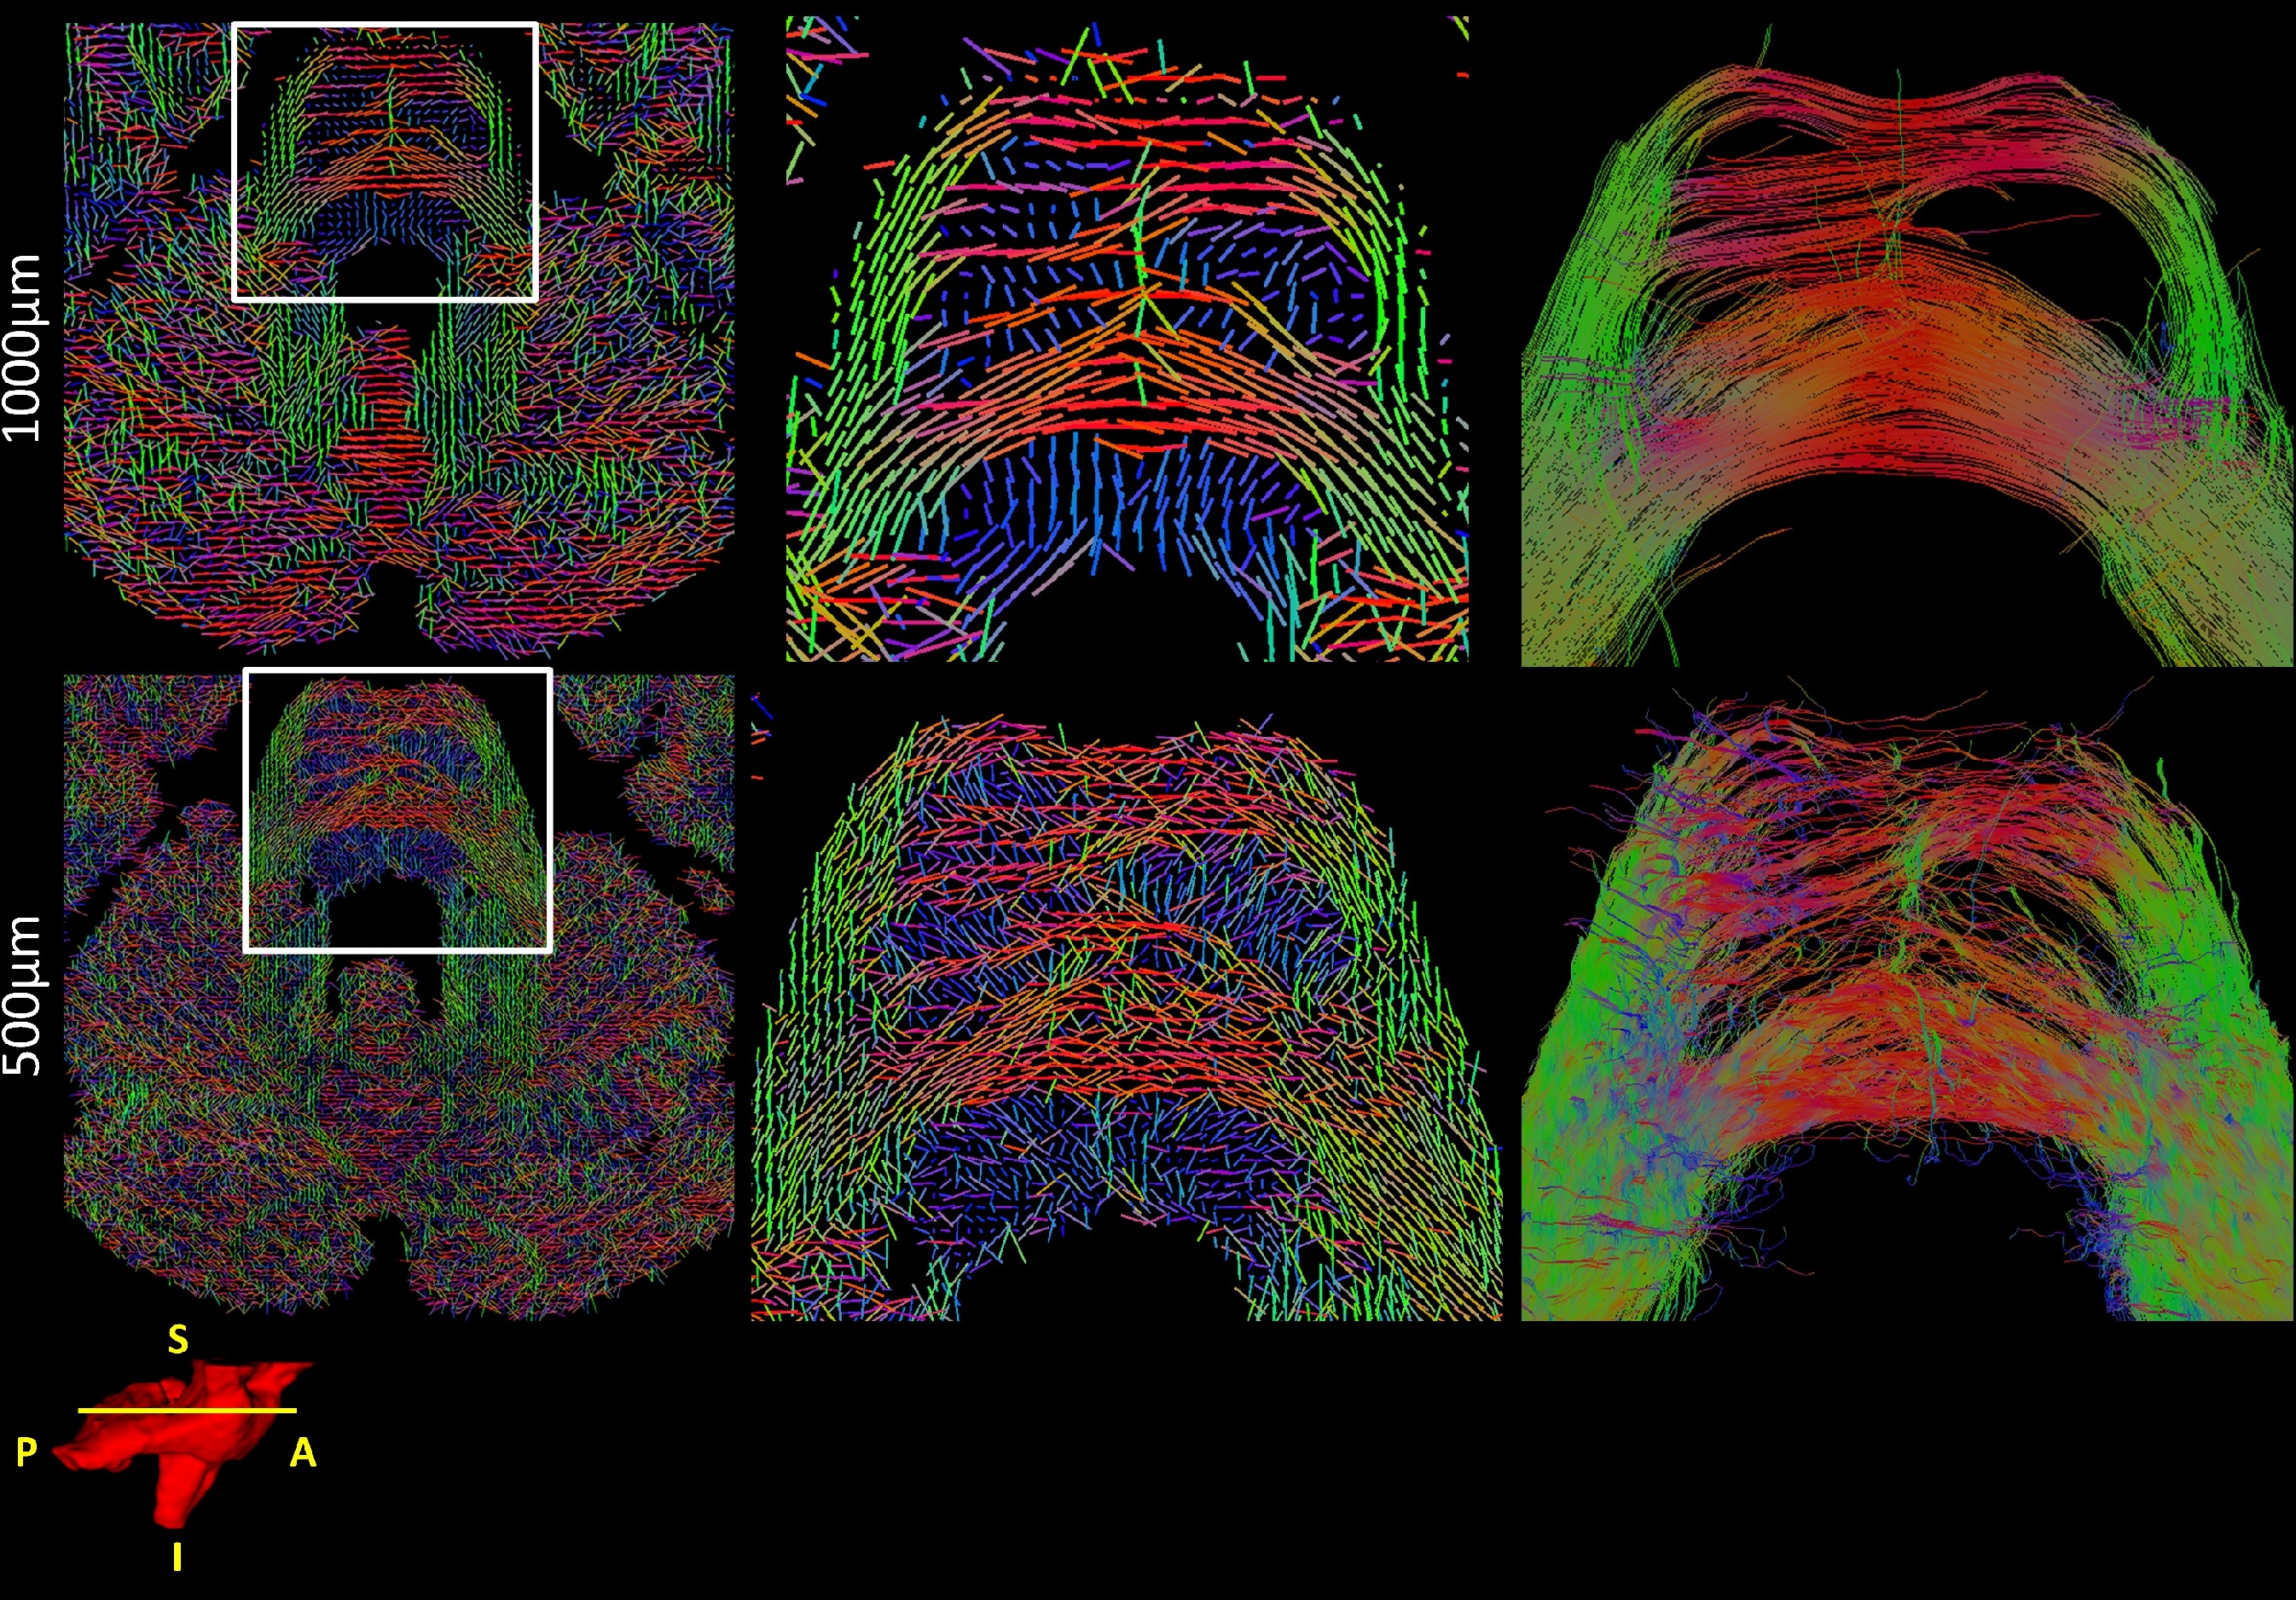
Figure 3 shows a comparison between the obtained Ball&Stick_Sorted results for single shell analysis and multishell analysis using the pipeline defined in Figure 2 for the 1000μm isotropic data. A comparison between resolutions for b = 4000s/mm2 single shell and multi-shell analysis was also performed (Figure 4), in which the benefits of multi-shell analysisis also appreciable in the second estimated direction for 1000μm and for the first direction for 500μm. Tractography at 1000μm results show well defined fibres across the entire brain including the brain stem region (Figure 5). Figure 6 shows a comparison of tractography between 1000μm and 500μm, showing a better defined interdigitation between crossing structures, however the trade-off between resolution and SNR is also visible for this very short T2 specimen.Conclusion
The kT-dSTEAM sequence allows high resolution diffusion-weighted imaging of the entire human brain with homogenous contrast at 9.4T. The incorporation of varying TM multi-shell analysis permits effective usage of both SNR and diffusion-weighting inherent to data with multiple b-values. This shows superior definition of white matter tracks at ultra-high resolution for tractography. In addition, 3D undersampled acquisition allows more room in the trade-off between acquisition time, resolution, b-values and directions. In the future this methodology can be leveraged for ultra-high resolution human connectome and more complex biophysical microstructure models.Acknowledgements
No acknowledgement found.References
1. Conturo, T. E., Lori, N. F., Cull, T. S., Akbudak, E., Snyder, A. Z., Shimony, J. S., McKinstry, R. C., Burton, H., and Raichle, M. E. Tracking neuronal fiber pathways in the living human brain. Proc. Natl. Acad. Sci. USA 1990; 96:10422–10427.
2. Dell'Acqua F, et al. MR diffusion histology and micro-tractography reveal mesoscale features of the human cerebellum. Cerebellum, 2013; 12(6): 923-931.
3. Aggarwal M, et al. Probing region-specific microstructure of human cortical areas using high angular and spatial resolution diffusion MRI. Neuroimage, 2015; 105:198-207.
4. Fritz, F. J. et al. kT-dSTEAM: high resolution diffusion-weighted imaging of the ex vivo human brain using B1+ homogenized STEAM at 9.4T. Proc. ISMRM 25th Annual Meeting & Exhibition 2017. Poster #0173.
5. Fritz, F. J. et al. High resolution diffusion MRI and tractography of post mortem human brains using kT-dSTEAM at 9.4T. Proc. OHBM 2017. #1567.
6. Roebroeck A. et al. “High resolution MRI neuroanatomy of the whole human brain post mortem with a specialized 9.4T RF-coil” Proc. OHBM 2015 Poster #1856
7. Tse DHY, Poole MS, Magill AW, Felder J, Brenner D, Jon Shah N (2014) Encoding methods for B1(+) mapping in parallel transmit systems at ultra high field. J Magn Reson 245:125-132
8. Uecker M., Lai P., Murphy MJ, et al. ESPIRiT - An Eigenvalue Approach to Autocalibrating Parallel MRI: Where SENSE meets GRAPPA. Magn Reson Med, 2014; 71:990-1001.
9. Tamir, J., Ong F. et al. Generalized Magnetic Resonance Image Reconstruction using The Berkeley Advanced Reconstruction Toolbox, ISMRM Workshop on Data Sampling and Image Reconstruction, Sedona 2016.
10. Harms, R. L. et al. Robust and fast nonlinear optimization of diffusion MRI microstructure models. Neuroimage. 2017;155:82-96
Figures