0044
Tractography-based parcellations show limited sensitivity to internal structure1Developmental Imaging and Biophysics Section, UCL GOS Institute of Child Health, University College London, London, United Kingdom, 2Neuroradiological Academic Unit, UCL Institute of Neurology, University College London, London, United Kingdom, 3Sobell Department of Motor Neuroscience and Movement Disorders, UCL Institute of Neurology, University College London, London, United Kingdom
Synopsis
Connectivity-based parcellation of subcortical structures using diffusion tractography is a common paradigm. Typically, these analyses imply voxel-level specificity of connectivity, and spatial coherence is taken as imaging-based evidence for anatomically distinct subnuclei. However, by spatially permuting diffusion parameters and repeating the parcellation, we demonstrate that internal structure in diffusion anisotropy is not necessary for a plausible parcellation to be obtained. This suggests that such parcellations should be interpreted with some caution.
Introduction
An increasingly common application of diffusion tractography is connectivity-based parcellation. In this paradigm, a contiguous anatomical region, which is typically cortical or subcortical grey matter, is parcellated into subregions based on the locally dominant projections from each imaging voxel contained within it. This is established by running diffusion tractography a large number of times and assessing the pattern of connections to a set of target regions.1–3
Although this approach has been shown to be reproducible, and in many cases to broadly match expectations from neurophysiology and anatomy, the importance of internal structure within the parcellated regions has not been examined in detail. In this work we demonstrate that coherent structure within the human thalamus in diffusion MRI data is not necessary for plausible delineation of connected subregions. Such parcellations are potentially prone to over-interpretation, and therefore should be treated cautiously.
Methods
Diffusion-weighted SE-EPI images were acquired from three healthy volunteers (two female; age range 27.8–28.1 yr) on a Siemens Avanto 1.5 T scanner. Diffusion weighting was applied along 30 noncollinear directions at b=800 s mm–2 and 60 directions at b=2400 s mm–2, along with nine volumes at b=0. Reconstructed image dimensions were 96 x 96 x 60 voxels, with a voxel size of 2.5 mm in each dimension. Standard preprocessing to realign and skull-strip the data, and correct for eddy-current induced artefacts, was performed using TractoR4 and FSL.5 A T1-weighted structural scan was also acquired (3D-FLASH; resolution 1 x 1 x 1 mm), and automatically parcellated using FreeSurfer.6
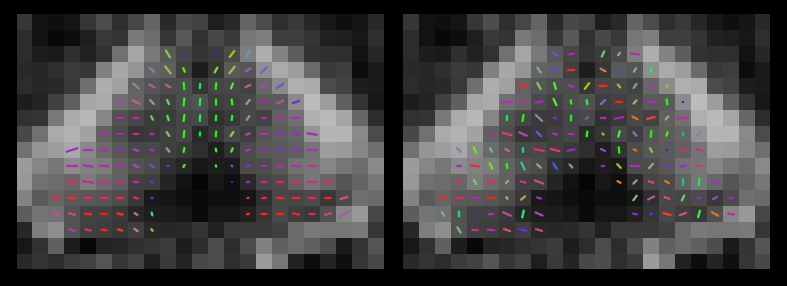
“Ball-and-sticks” models with one, two and three sticks were fitted separately to each dataset using FSL-BEDPOSTX.7 The left and right thalami, and frontal, temporal, parietal and occipital cortices, were extracted from the FreeSurfer parcellations and transformed to diffusion space using NiftyReg.8 A copy of each dataset was made, and the fitted ball-and-sticks model parameters were randomly repositioned in space within each thalamus (Figure 1). In every unscrambled and scrambled dataset, 1000 streamlines were seeded from each voxel within the thalamus masks, and that voxel was coloured to indicate the cortical lobe at which the greatest number of streamlines arrived.1 No colour was assigned where none of the streamlines from a voxel reached any of the target areas.
Results
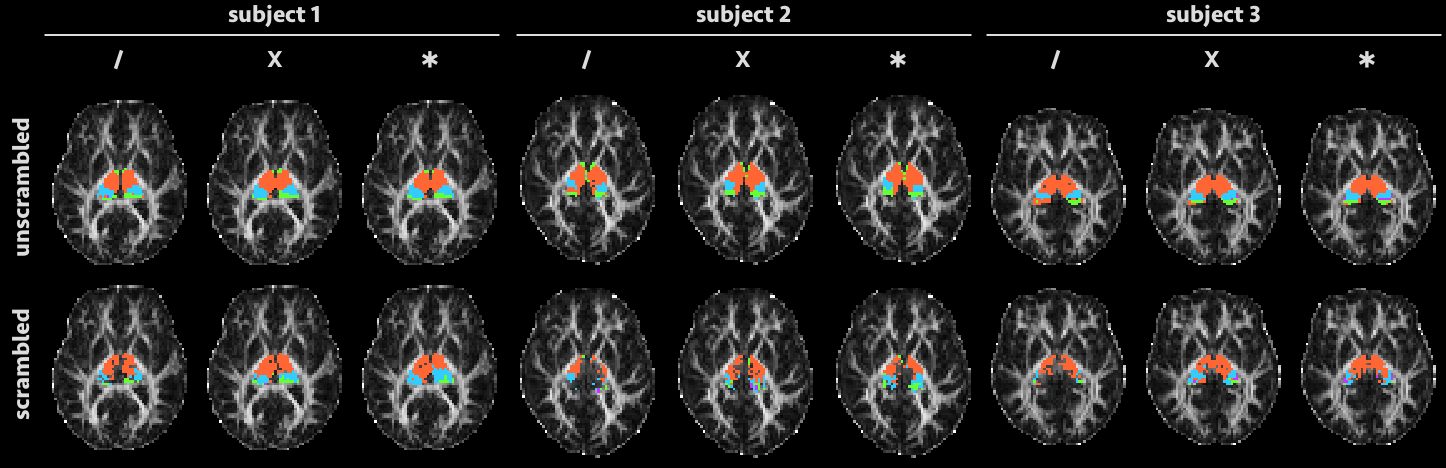
Figure 2 shows the axial slice containing the largest number of thalamus voxels in each subject, parcellated as described above and overlaid on a fractional anisotropy map. We observe that parcellations in the unscrambled data generally improve as the number of fibre directions modelled per voxel increases (from left to right within each subject)—but the same is also true for the scrambled data. In subjects 1 and 3, in particular, clear and coherent structure is visible in the “scrambled” parcellations, despite the absence of internal orientational structure within the thalamus in each case.
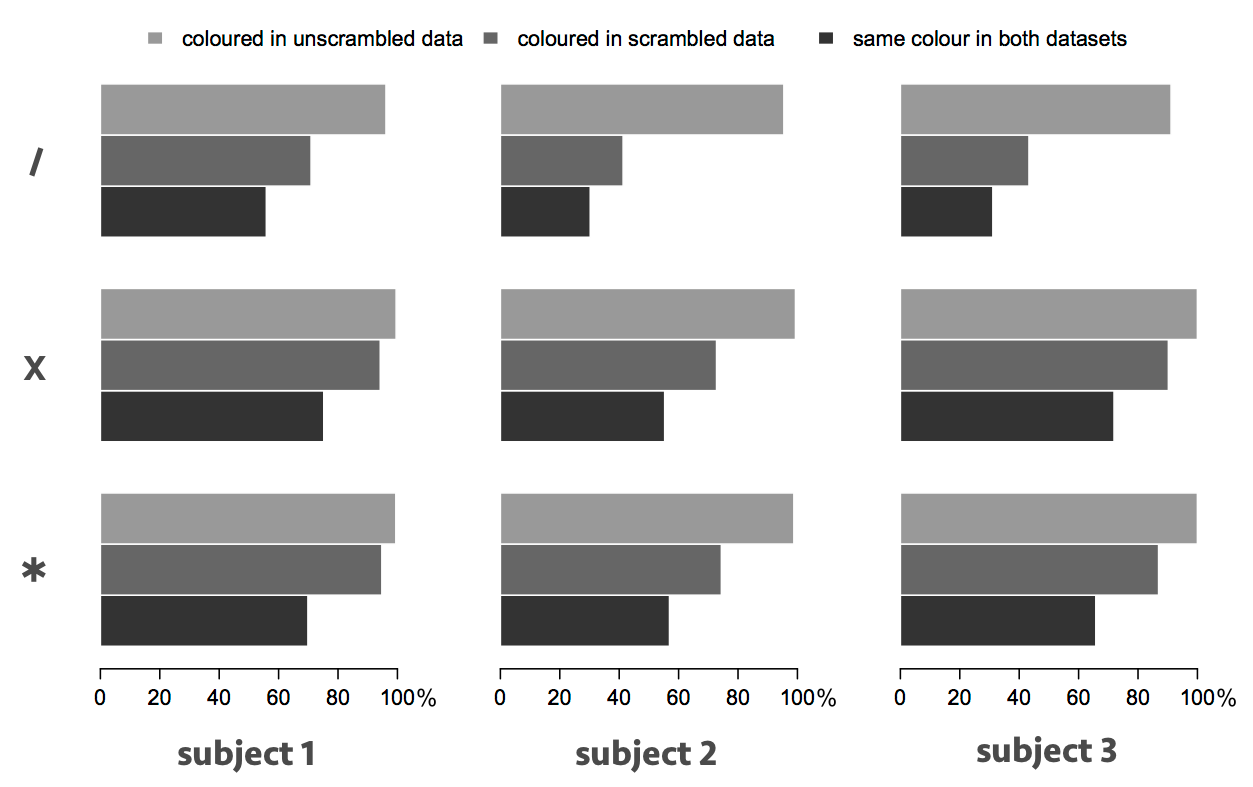
Over the entirety of the left and right thalami, the scrambling process resulted in substantially more voxels receiving no colour (because no streamlines propagated to any of the targets), and the total number of streamlines reaching the targets dropped substantially, but in every case the majority of those voxels that were coloured received the same colour as in the unscrambled data (Figure 3). In the one-fibre model (top), there was an overall agreement of 30–55% in the parcellations (including uncoloured voxels), rising to more than 70% in the two-fibre model for subjects 1 and 3. The agreement was 74–80%, across all cases, when uncoloured voxels were ignored.
Discussion
We have reported that artificially destroying internal structure in diffusion anisotropy within the human thalamus does not entirely inhibit the creation of plausible streamline-based parcellations, as might be expected. The relative proximity of each voxel to neighbouring white matter tracts may therefore be the primary determinant of the point of exit from the thalamus, and hence the subsequently inferred connectivity. Hence, there may not be strong support in the imaging data for specific axonal pathways projecting to or from each voxel.
The resilience of the parcellation to spatial scrambling is particularly strong when multi-fibre models such as the ball-and-two-sticks are used. This is presumably because they present a greater choice of directions for use by the streamline tracking algorithm, which in turn underlines the greater scope for false positives when using such models, despite their converse advantages in reducing false negatives.
Conclusion
Internal diffusion anisotropy within deep grey matter structures such as the thalamus may provide only a modest contribution to streamline-based parcellations of such structures. It would therefore be advisable to avoid making strong statements about internal substructure when interpreting these parcellations.Acknowledgements
DLT is supported by the UCL Leonard Wolfson Experimental Neurology Centre (PR/ylr/18575). AK is supported by the Wellcome Trust.References
1. Behrens TE, Johansen-Berg H, Woolrich MW, et al. Non-invasive mapping of connections between human thalamus and cortex using diffusion imaging. Nat Neurosci 2003; 6(7):750–757.
2. Draganski B, Kherif F, Klöppel S, et al. Evidence for segregated and integrative connectivity patterns in the human basal ganglia. J Neurosci 2008; 28(28):7143–7152.
3. Lambert C, Zrinzo L, Nagy Z, et al. Confirmation of functional zones within the human subthalamic nucleus: Patterns of connectivity and sub-parcellation using diffusion weighted imaging. NeuroImage 2012; 60(1):83–94.
4. Clayden JD, Muñoz Maniega S, Storkey AJ, et al. TractoR: Magnetic resonance imaging and tractography with R. J Stat Softw 2011; 44(8):1–18.
5. Smith SM, Jenkinson M, Woolrich MW, et al. Advances in functional and structural MR image analysis and implementation as FSL. NeuroImage 2004; 23 Suppl 1:S208–19.
6. Desikan RS, Ségonne F, Fischl B, et al. An automated labeling system for subdividing the human cerebral cortex on MRI scans into gyral based regions of interest. NeuroImage 2006; 31(3):968–980.
7. Behrens TE, Johansen-Berg H, Jbabdi S, et al. Probabilistic diffusion tractography with multiple fibre orientations: What can we gain? NeuroImage 2007; 34(1):144–155.
8. Modat M, Ridgway GR, Taylor ZA, et al. Fast free-form deformation using graphics processing units. Comput Methods Programs Biomed 2010; 98(3):278–284.
Figures