0043
Investigating U-Shape Fibers from Data-Driven Clustering of White Matter Tractography1Medical Biophysics, Western University, London, ON, Canada, 2Biomedical Engineering, Western University, London, ON, Canada, 3Robarts Research Institute, Western University, London, ON, Canada
Synopsis
Studies of white matter tractography typically investigate fibers that make up long association tracts, such as the arcuate fasciculus. As a result, the local structural connections comprising short association (cortico-cortical), U-shaped fibers, or U-fibers, are poorly understood. Previous work suggests these fibers play an important role in communication between adjacent cortical regions. We introduce a flexible, data-driven tool incorporating multimodal MRI techniques to aid differentiation of fiber tracts via clustering techniques, including a filter to identify and extract U-fibers. Using this tool, we present a preliminary investigation of U-fibers between controls (N=20) and patients diagnosed with temporal lobe epilepsy (N=19).
Introduction
Visualization of brain white matter fibers via diffusion tractography modelling can allow for inferences to be made of different brain pathways1. Tractography can have a potential impact on several tasks, such as neurosurgical planning2,3. Individual modelled fibers can be clustered into tracts with existing semi- and fully-automated techniques, which leverage fiber geometry to establish similarity4. Such techniques can successfully identify a number of tracts, including, but not limited to, long association bundles (e.g. genu of corpus callosum), allowing for such structures to be probed in healthy and patient populations5. With existing research primarily focused on the long association tracts, little is known with regards to short association (cortico-cortical), U-shaped fibers, or U-fibers. We introduce a flexible, data-driven clustering tool to filter for and perform a preliminary investigation of U-fibers differences between healthy and epilepsy patient populations.Methods
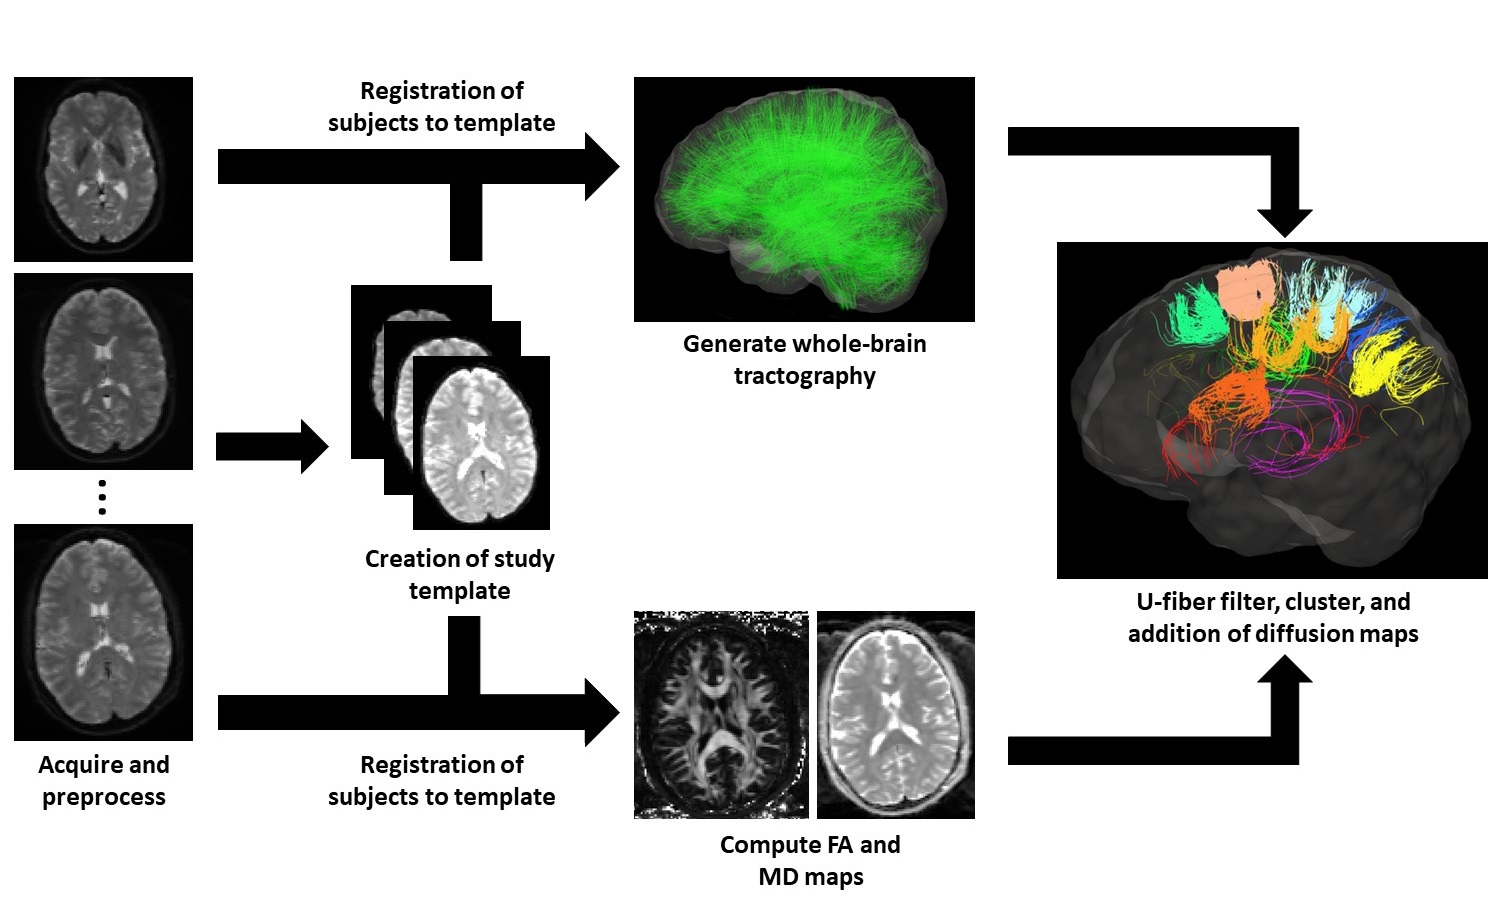
Figure 1 exhibits the workflow described in this section.
Data – A group of control subjects (N=20) and patients diagnosed with epilepsy (N=19) were scanned using a 3T MRI (Siemens Prisma) system with a 32-channel head coil. The scanning protocol included acquisition of structural images using a MPRAGE sequence (5000/2.98ms TR/TE, 700ms TI, FOV = 256x256mm2, slice thickness = 1mm). In addition, a multiband echo-planar sequence was used to acquire diffusion weighted images (b=0, 1300, 2600 s/mm2, 140 diffusion-encoding directions acquired twice with alternating phase encoding directions, 2800/66.80ms TR/TE, FOV =224 x 224mm2 slice thickness = 2mm). Diffusion images were corrected for echo planar imaging and eddy current distortion using topup6 and eddy7 from FSL8. Correction of Gibbs’ ringing artifact was attempted by determining optimal sub-voxel shifts within the neighborhood of sharp edges9, while noise reduction was achieved by separating the signal from the noise in the image via local noise estimation (MRTrix dwidenoise)10.
Tractography – All code for the data-driven tool was developed using Python.
-
Using MRTrix11, a study-specific template based on the
control data was created using a linear, affine registration,
followed by a non-linear Registration of individual subjects to the
template was performed following template creation prior to
tractography.
- Whole-brain, constrained spherical deconvolution (CSD) tractography with 20 million fibers were generated via a probabilistic algorithm with MRTrix using second-order integration over fiber orientation distributions (FODs). Following generation of fibers, the tracking data were filtered until 2 million fibers remained using a scale-invariant feature transform12.
- To identify short association fibers from whole-brain tractography, filtering for U-fibers was performed by constraining and eliminating the generated fibers. Any fibers crossing the mid-sagittal plane of the brain were removed. The distance between the fiber end points, D, and the length of the fiber, L were computed to apply constraints. For a fiber to be a candidate U-fiber, it had to meet the following criteria13:
$$L>30mm$$
$$D\le\frac{L}{\pi}$$
$$L<100mm$$
Following their extraction, the U-fibers, were grouped into tracts via a spectral clustering algorithm14, 15. To compute the affinity between fibers, 20 points were sampled evenly along the length of the fibers. The distances between fibers were then calculated and a Gaussian kernel applied to determine fiber similarity. Fractional anisotropy (FA) and mean diffusivity (MD) maps were computed from the diffusion images and sampled onto tractography data for visualization and statistical analysis.
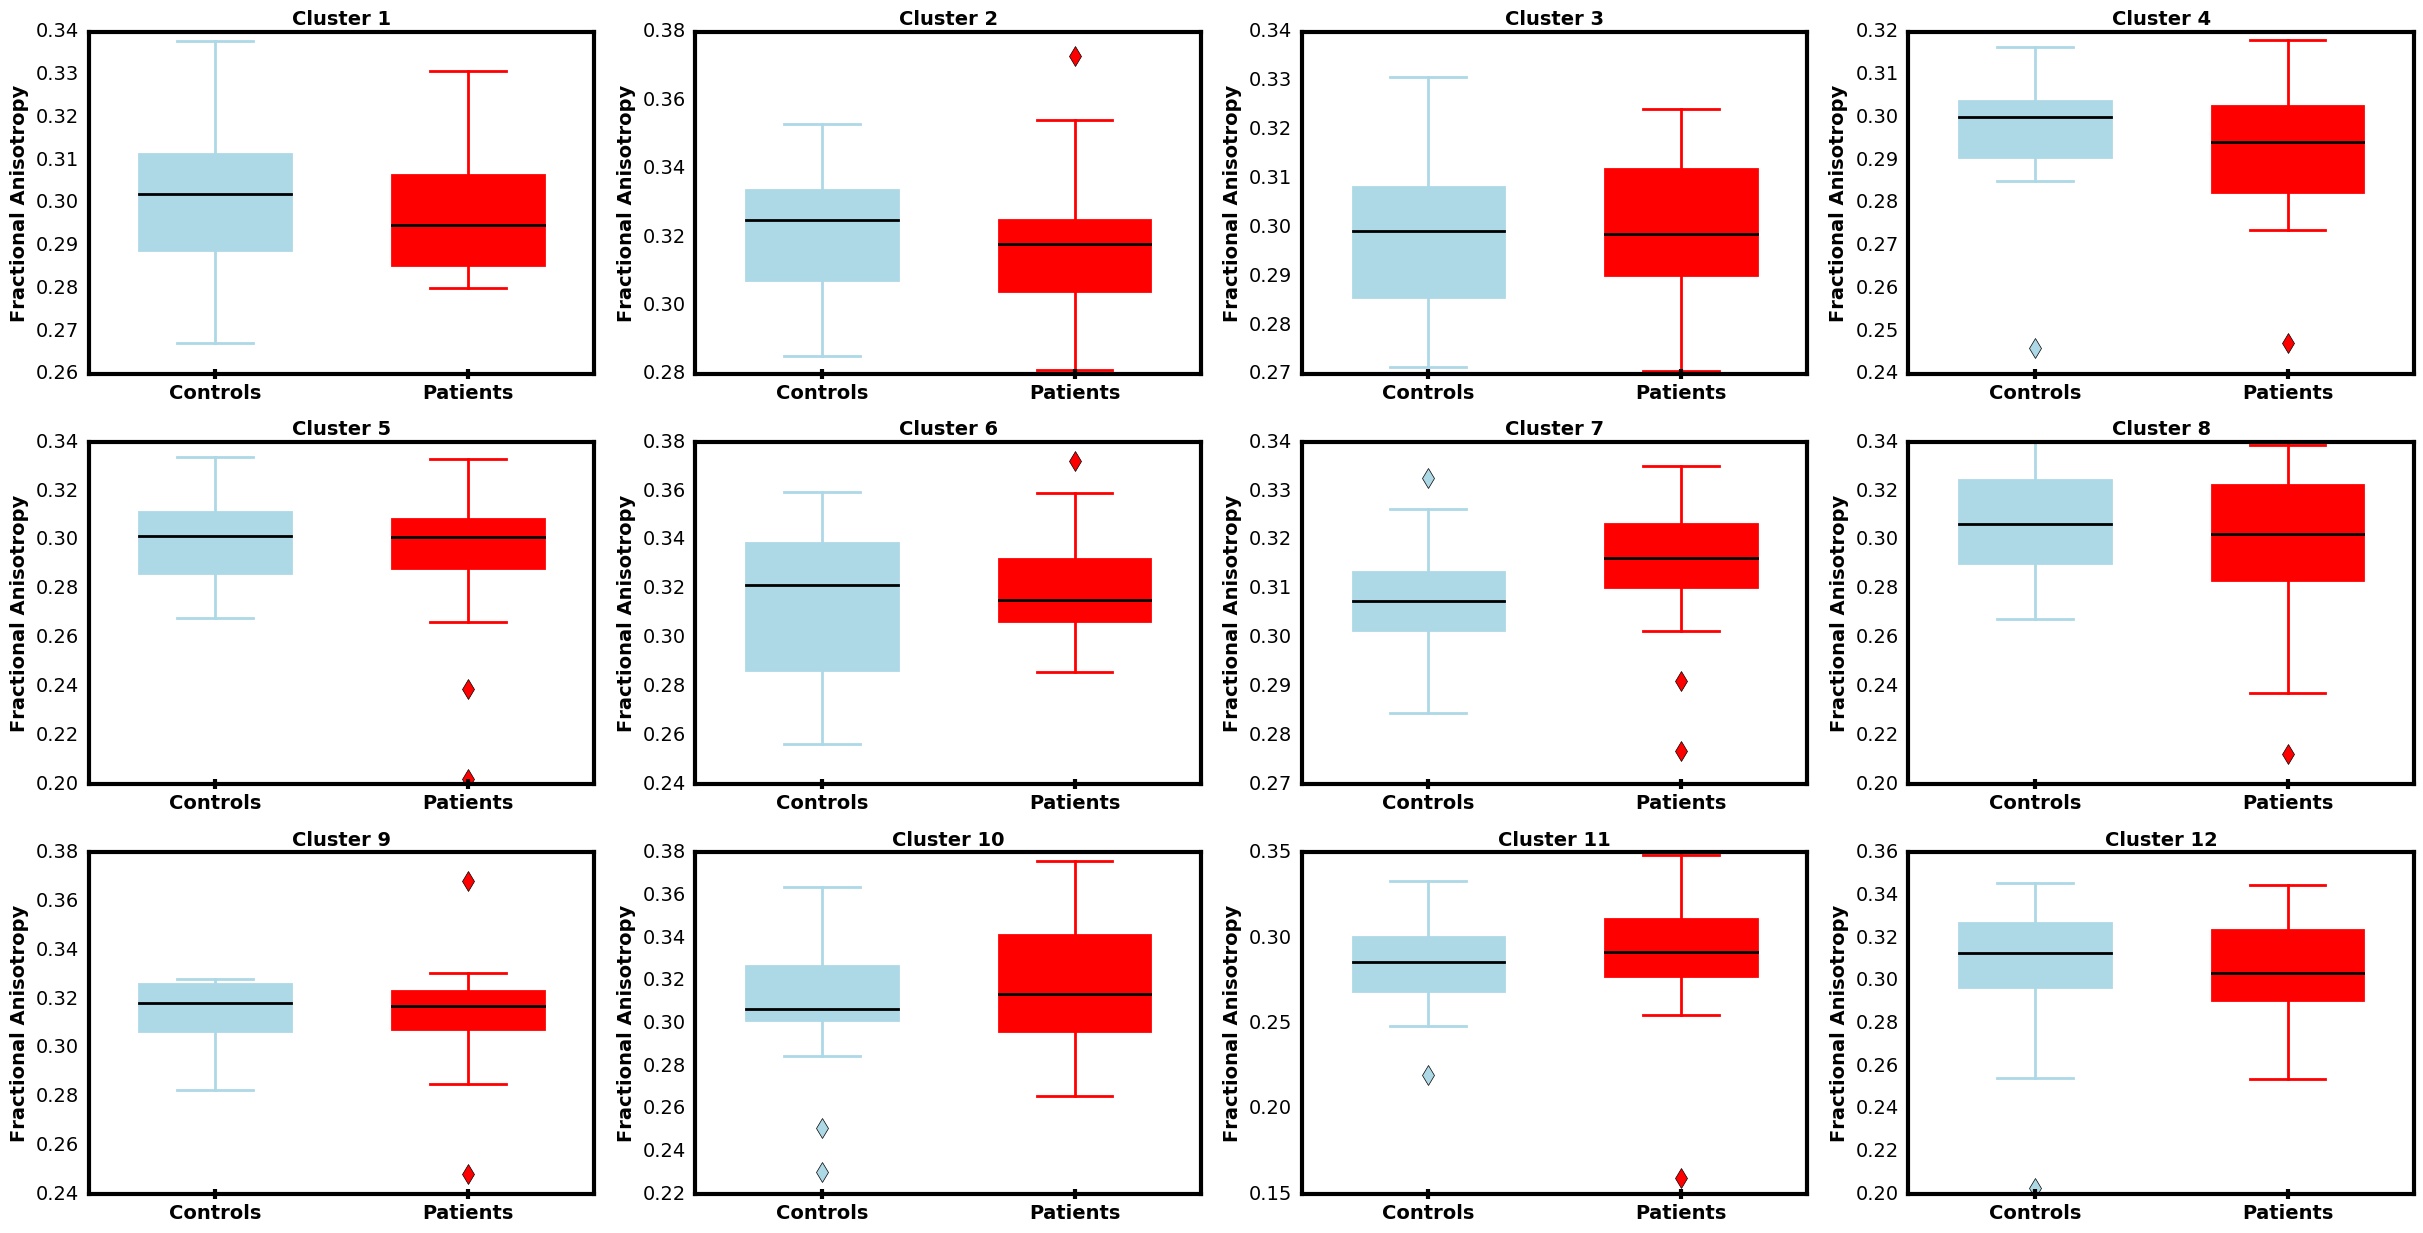
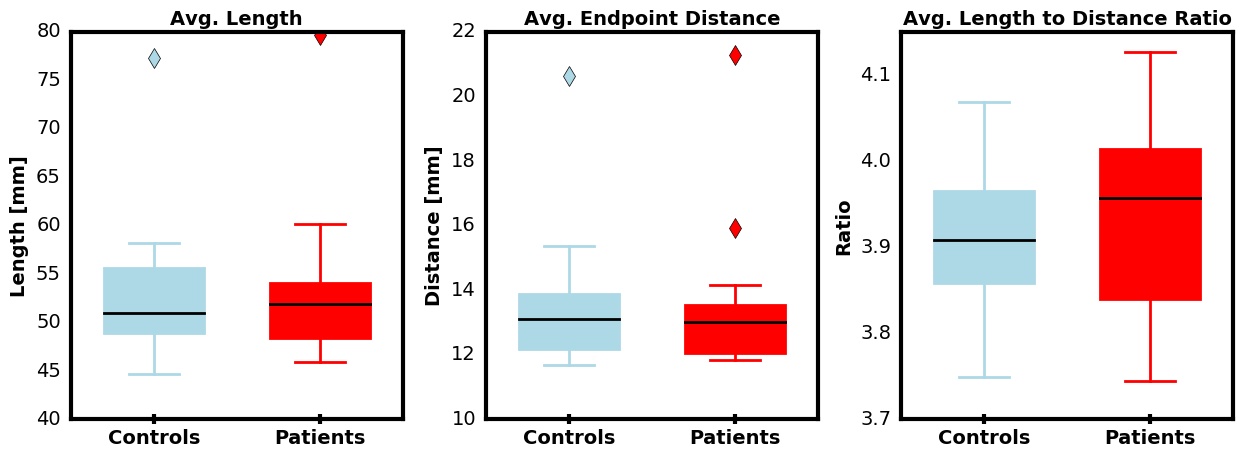
Analysis – Comparison of average FA, MD, fiber length (L), distance between end points of a fiber (D), and L:D ratio for each cluster was performed using two-tailed t-tests between control and patient groups. P-values were adjusted to control for false discovery rates following the Benjamini-Hochberg16 procedure.
Results
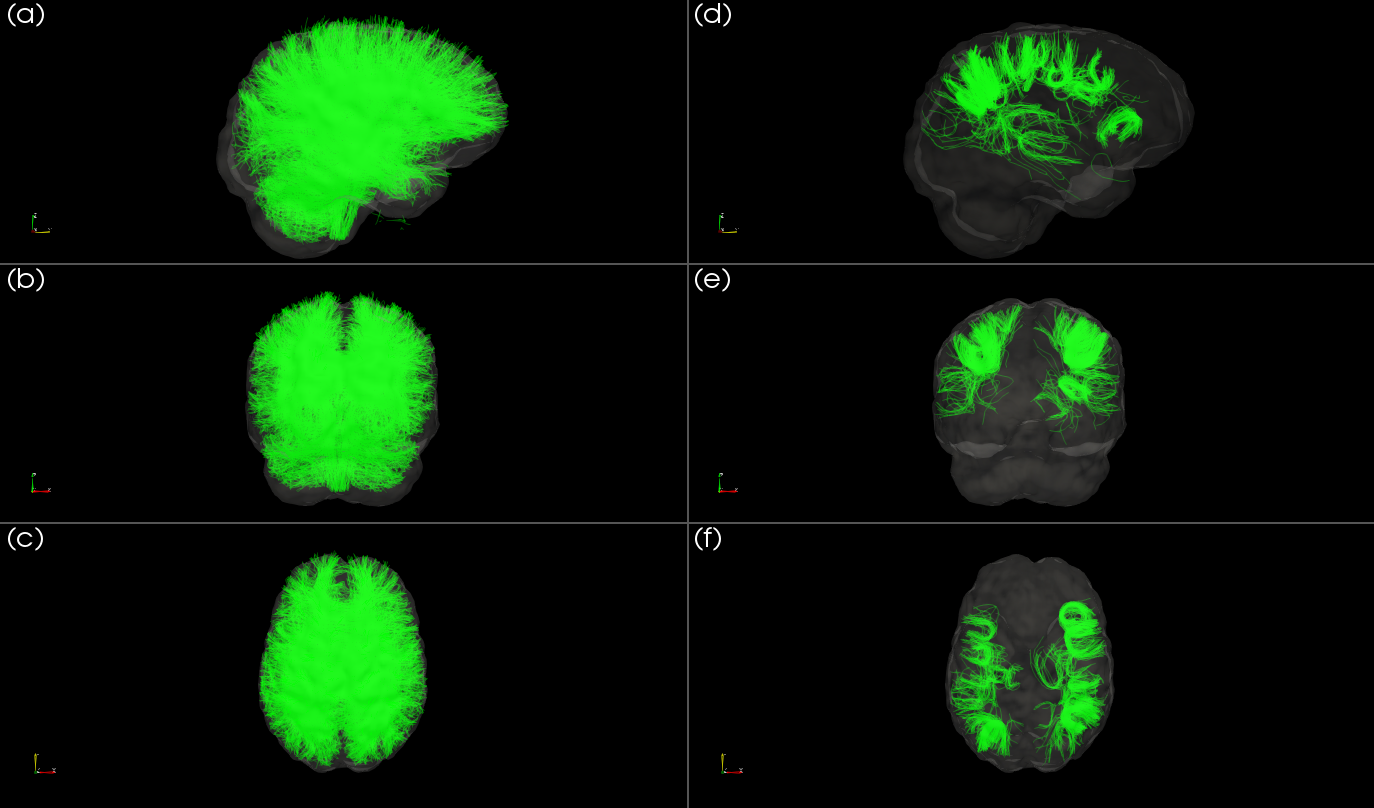
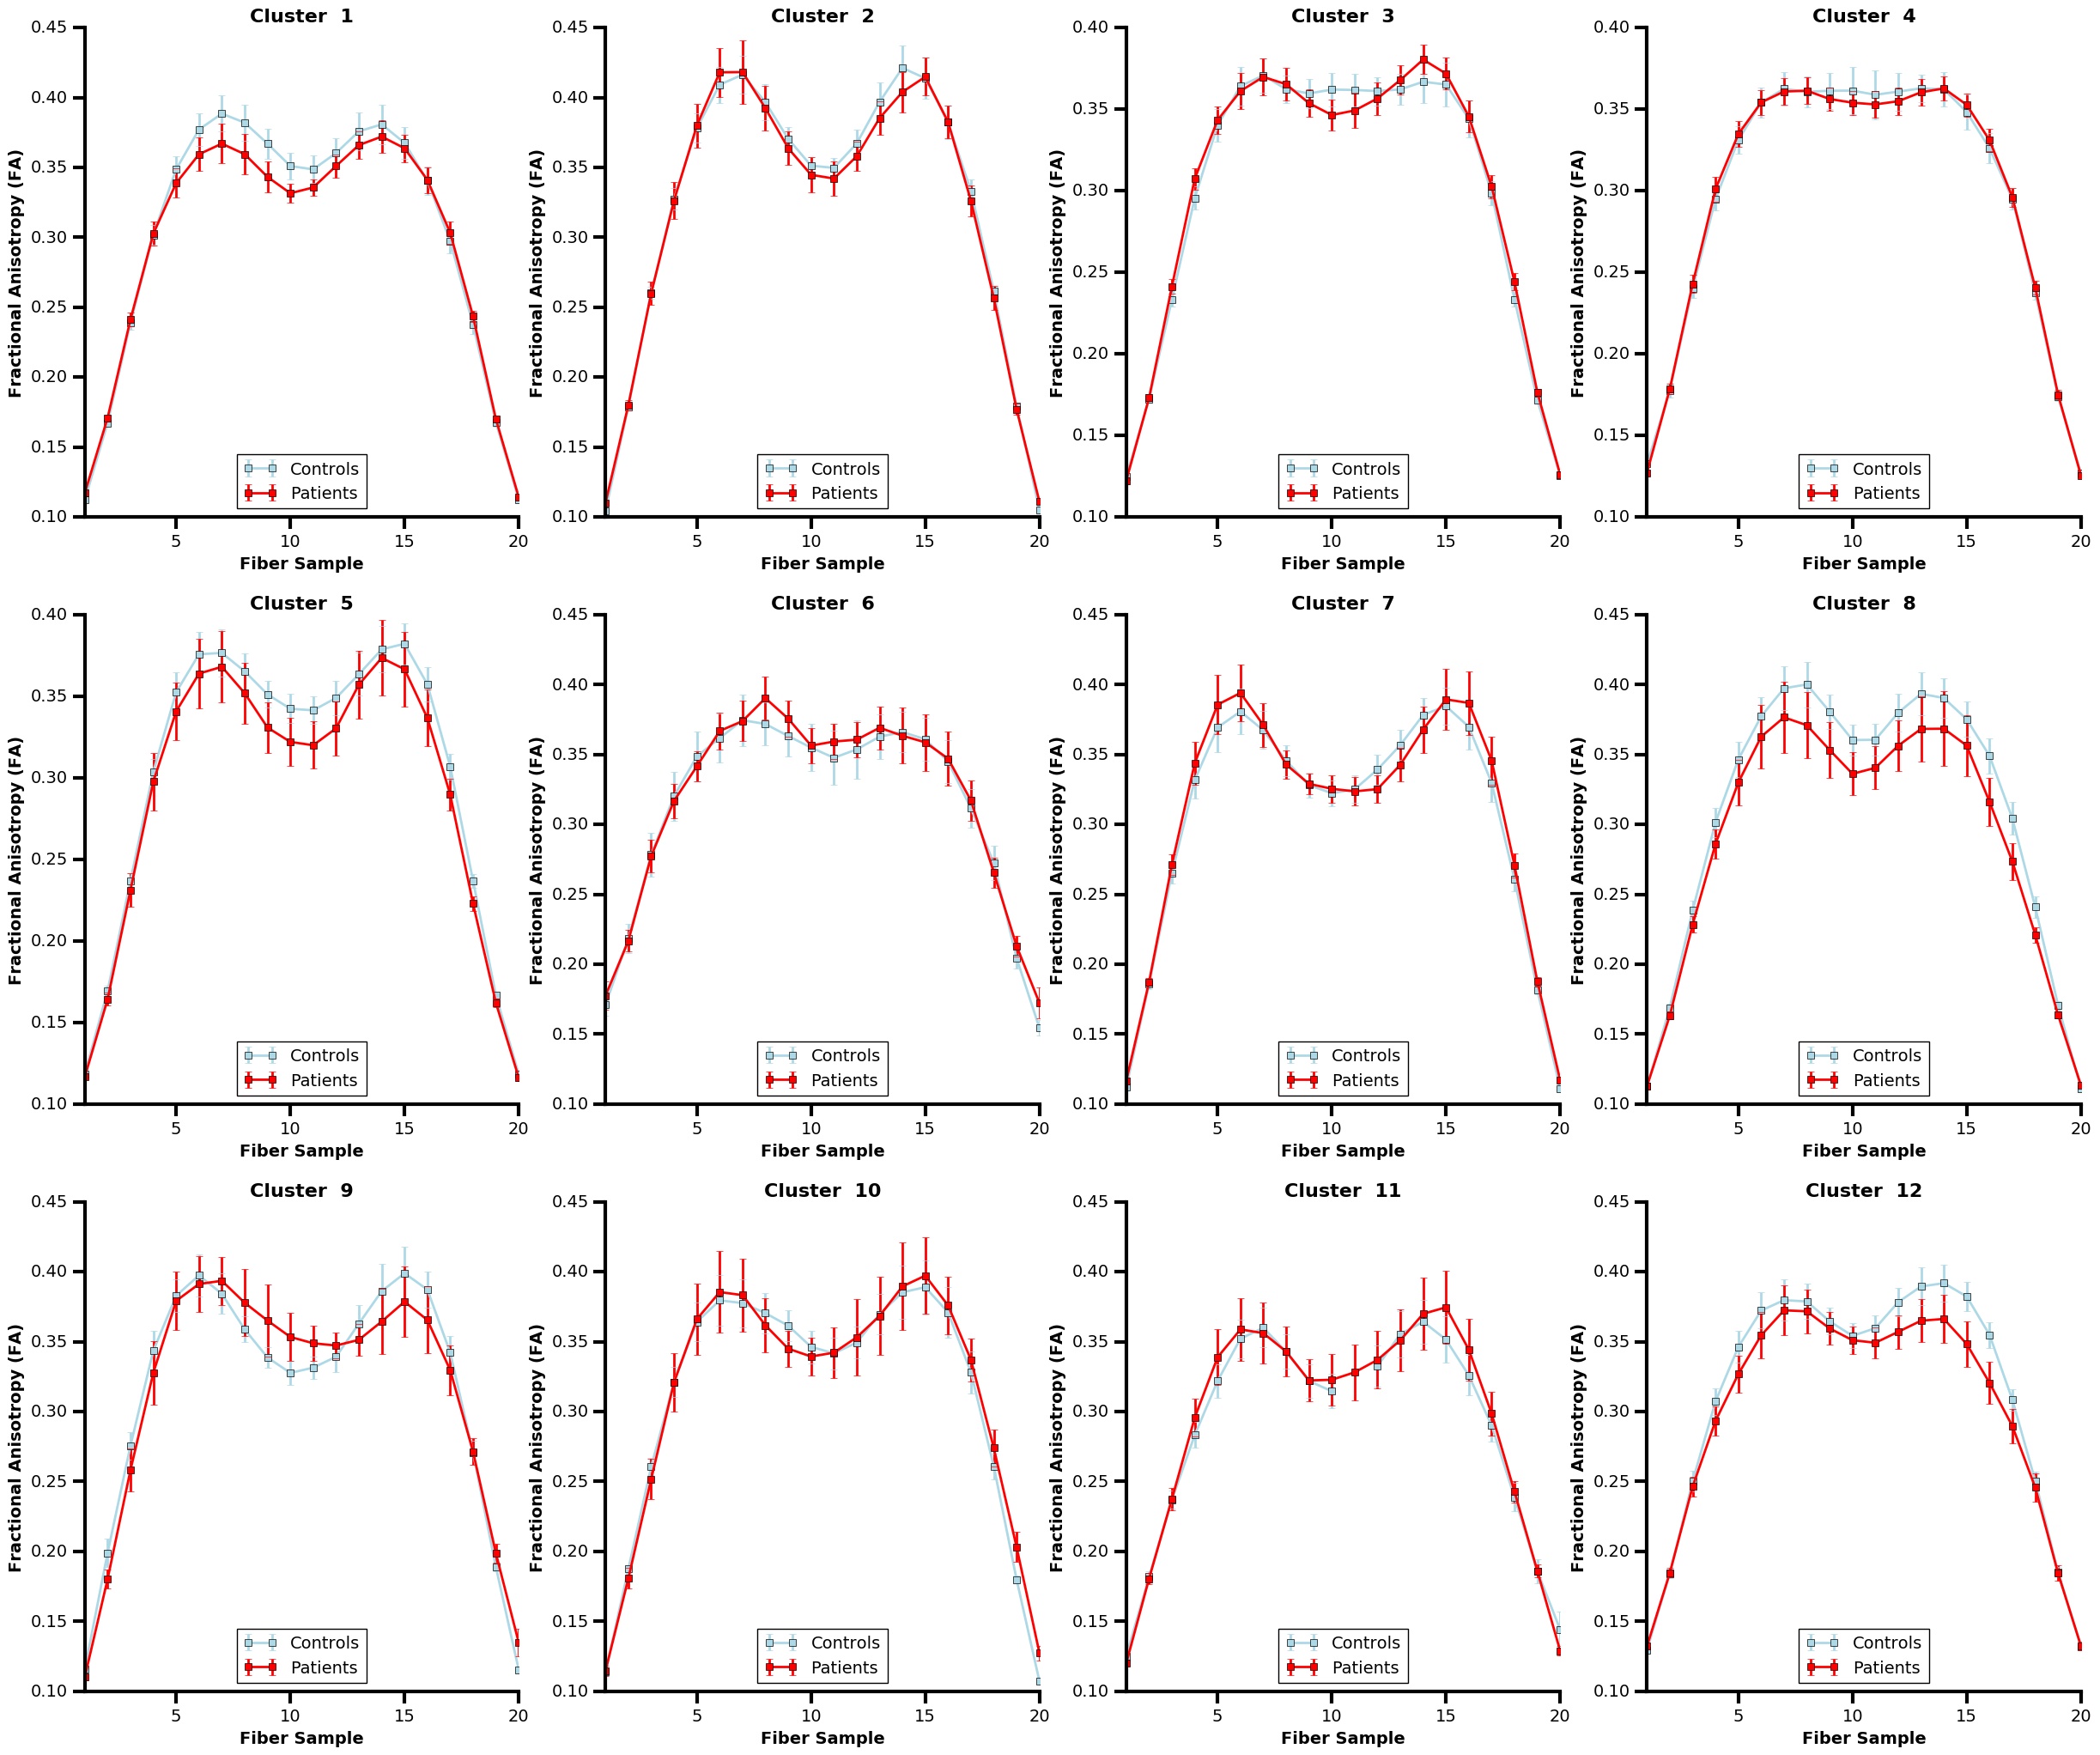
The whole-brain tractography, shown in figure 2, displays tracts prior to and following U-fiber filtering and extraction. Figure 3 presents tract-based statistics for identified U-fiber clusters between control and patient groups. A box-and-whisker plot is displayed in figure 4, comparing average diffusion measurements of different clusters between the studied cohorts. Figure 5 displays the average measured length, distance between endpoints and L:D ratio.Discussion/Conclusion
A data-driven clustering tool with constraints to filter for U-fibers is introduced and implemented on whole-brain tractography. With such a tool, visualization of cortico-cortical U-fibers was made possible and a preliminary investigation of U-fibers between controls and epilepsy patients was performed. An examination of average cluster FA, MD, L, D, and L:D ratio was completed. Following correction to control for false discovery rates, no significance was found. Future work includes further examination of specific classifications of epilepsy (left vs right temporal lobe epilepsy) in addition to other neurological conditions.Acknowledgements
We acknowledge the support from the Canadian Institutes for Health Research (Foundation Grant 333550), Natural Sciences and Engineering Research Council of Canada (Discovery Grant 2015-06639), BrainsCAN, and Brain Canada.References
- Beaulieu C. The basis of anisotropic water diffusion in the nervous system – a technical review. NMR Biomed. 2002;15(7-8):435-455.
- Tunc B, Ingalhalikar M, Parker D, et al. Individualized Map of White Matter Pathways: Connectivity-Based Paradigm for Neurosurgical Planning. Neurosurgery. 2016;79(4):568-577.
- Essayed WI, Zhang F, Unadkat P, et al. White matter tractography for neurosurgical planning: A topography-based review of the current state of the art. NeuroImage: Clinical. 2017;15(SC):659-672.
- O’Donnell LJ and Westin CF. Automatic Tractography Segmentation Using a High-Dimensional White Matter Atlas. IEEE T-MI. 2007;26(11):1562-1575.
- O’Donnell LJ, Suter Y, Rigolo L, et al. Automated white matter fiber tract identification in patients with brain tumors. NeuroImage: Clinical. 2017;13:138-153.
- Andersson JLR, Skare S, and Ashburner J. How to correct susceptibility distortions in spin-echo echo-planar images: application to diffusion tensor imaging. NeuroImage. 2003;20(2):870-888.
- Andersson JLR and Sotiropoulos SN. An integrated approach to correction for off-resonance effects and subject movement in diffusion MR imaging. NeuroImage. 2016;125:1063-1078.
- Smith SM, Jenkinson M, Woolrich MW, et al. Advances in functional and structural MR image analysis and implementation as FSL. NeuroImage. 2004;23(S1):208-219.
- Kellner E, Dhital B, Kiselev VG, et al. Gibbs-ringing artifact removal based on local subvoxel-shifts. Magn. Reson. Med. 2015;76(5):1574-1581
- Veraart J, Fieremans E, and Novikov DS. Diffusion MRI noise mapping using random matrix theory. Magn. Reson. Med. 2015;76(5):1582-1593
- Tournier JD, Calamanta F, Connelly A. MRtrix: Diffusion tractography in crossing fiber regions. Int J Imaging Syst Technol. 2012;22(1):53-66.
- Smith RE, Tournier JD, Calamante F, et al. SIFT: Spherical-deconvolution informed filtering of tractograms. NeuroImage. 2013;67:298-312.
- O’Halloran R, Feldman R, Marcuse L, et al. A method for u-fiber quantification from 7T diffusion-weighted MRI data tested in patients with nonlesional focal epilepsy. NeuroReport. 2017;28(8):457-461.
- von Luxburg U. A tutorial on spectral clustering. Stat Comput. 2007;17(4):395-416.
- Fowlkes C, Belongie S, Chung F, et al. Spectral grouping using the Nystrom method. IEEE TPAMI. 2004;26(2):214-225.
- Benjamini Y and Hochberg Y. Controlling the False Discovery Rate: A Practical and Powerful Approach to Multiple Testing. J R Stat Soc Series B Stat Methodol. 1995;57(1):289-300
Figures