0042
Anchor tracts: a novel concept for reducing false positives in fiber tractography1Division of Medical Image Computing, German Cancer Research Center (DKFZ), Heidelberg, Germany
Synopsis
Numerous reports have shown that fiber tractography suffers from a difficult sensitivity-specificity tradeoff. We present an approach that leverages knowledge about certain well studied tracts (anchor tracts) in a tractogram to quantitatively assess and score the remaining tracts (candidate tracts) according to their plausibility in conjunction with this context information. We show that our approach has the potential for greatly reducing the number of false positive tracts in fiber tractography while maintaining high sensitivities.
Introduction
The problem of false positives in tractography is one of the grand challenges in diffusion MRI research. Due to the fundamental ill-posedness of tractography, there exist huge numbers of theoretically possible candidate tracts especially in bottleneck situations1. Only a fraction of these candidates corresponds to the true fiber configuration, which results in a difficult sensitivity-specificity tradeoff. Current methods address this issue either by focusing exclusively on well-known tracts using prior knowledge2,3 or by using filtering techniques based on tract morphology and the image signal4,5. To date, the link between purely data driven and prior knowledge based approaches is missing.
We propose a novel concept that rigorously exploits information about the existence of certain tracts (anchor tracts) to reduce the degrees of freedom of a filtering of the candidates. This is based on the hypothesis that information about the presence or absence of each anchor influences the plausibility of the candidates and thereby reduces the ambiguities in the problem. We demonstrate the potential of this concept to greatly improve the sensitivity-specificity tradeoff of tractography in a series of phantom experiments.
Methods
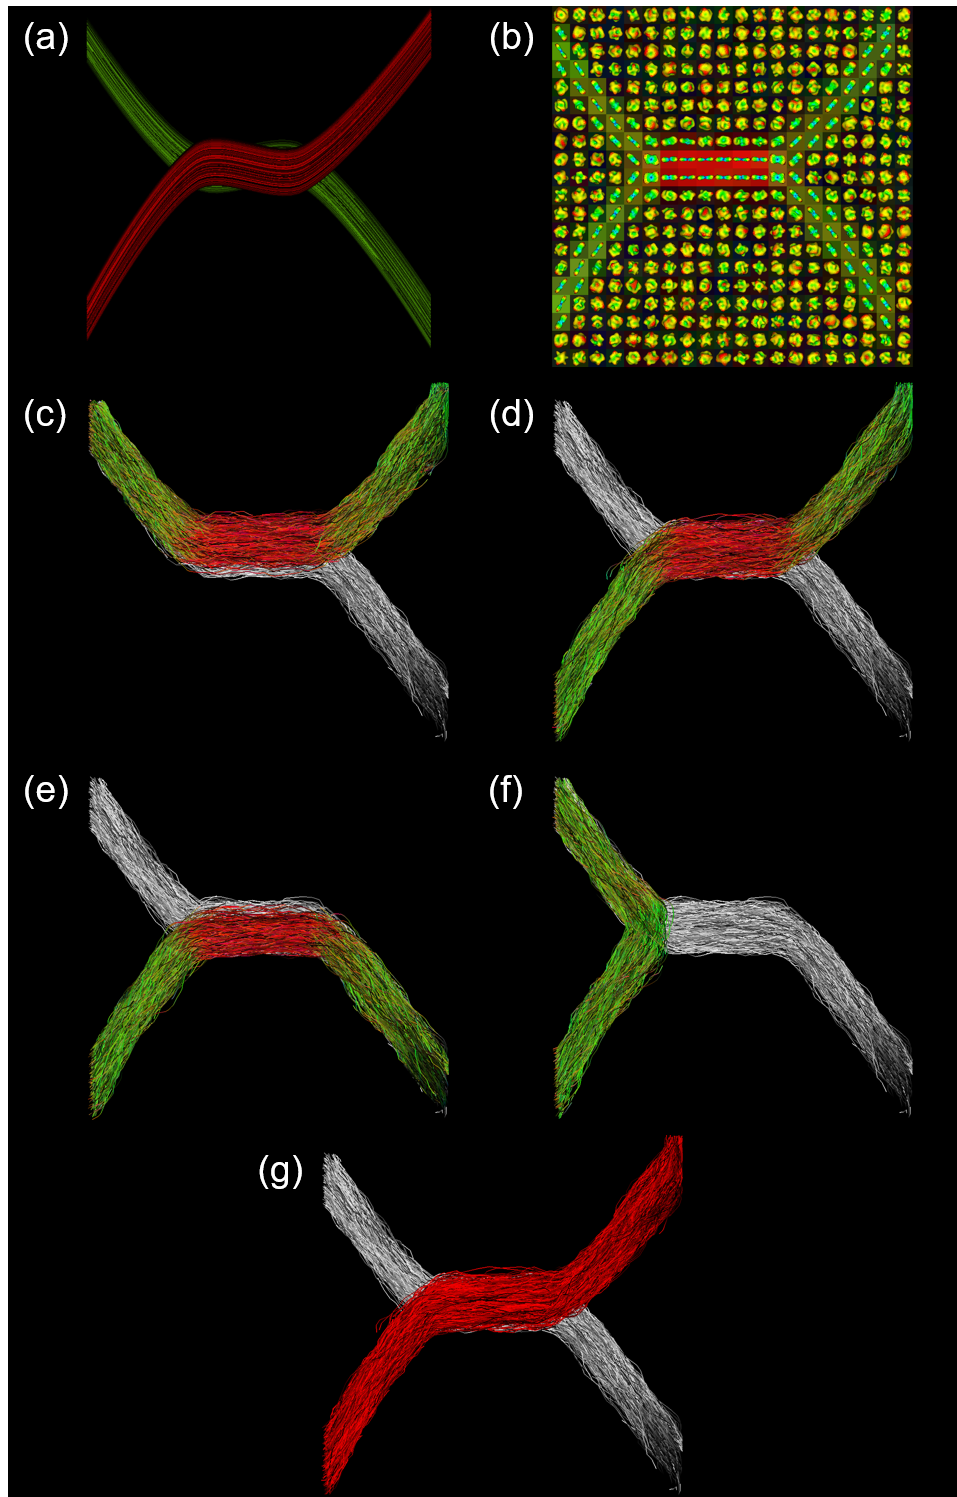
Essentially, our method scores the candidate tracts by assessing their contribution to the signal, subject to constraints imposed by the anchor tracts. The process consists of four steps: (1) The input tractogram is filtered using a gray matter mask to discard streamlines that terminate inside the white matter. (2) Based on prior knowledge, anchor tracts are identified and extracted from the filtered tractogram. (3) The remaining streamlines are then clustered using QuickBundles6 to obtain the candidate tracts. (4) It is now assessed which parts of the image can be explained by the anchor tracts using the SIFT2 methodology7. The residual image only contains parts of the signal that cannot be explained by the anchor tracts. By then applying SIFT2 to the candidate tracts and the residual image, a score for each candidate is obtained that is defined as the difference in RMSE with and without the respective tract. This score is interpreted as the “importance” or “plausibility” of the respective candidate for explaining the image signal under consideration of boundary conditions in form of prior knowledge. The procedure follows the intuition that a candidate tract is likely to exist if it is the only tract that can explain parts of the signal that is not explained by any known tracts.
Experiment 1: Figure 1 illustrates the principle on a toy example consisting of two crossing fibers simulated with Fiberfox8. The experiment was performed once with each ground truth tract as anchor tract. The Invalid Bundle Ratio (IVR) was 3.8 (the invalid tracts outnumbered the valid tracts by a factor of 3.8).
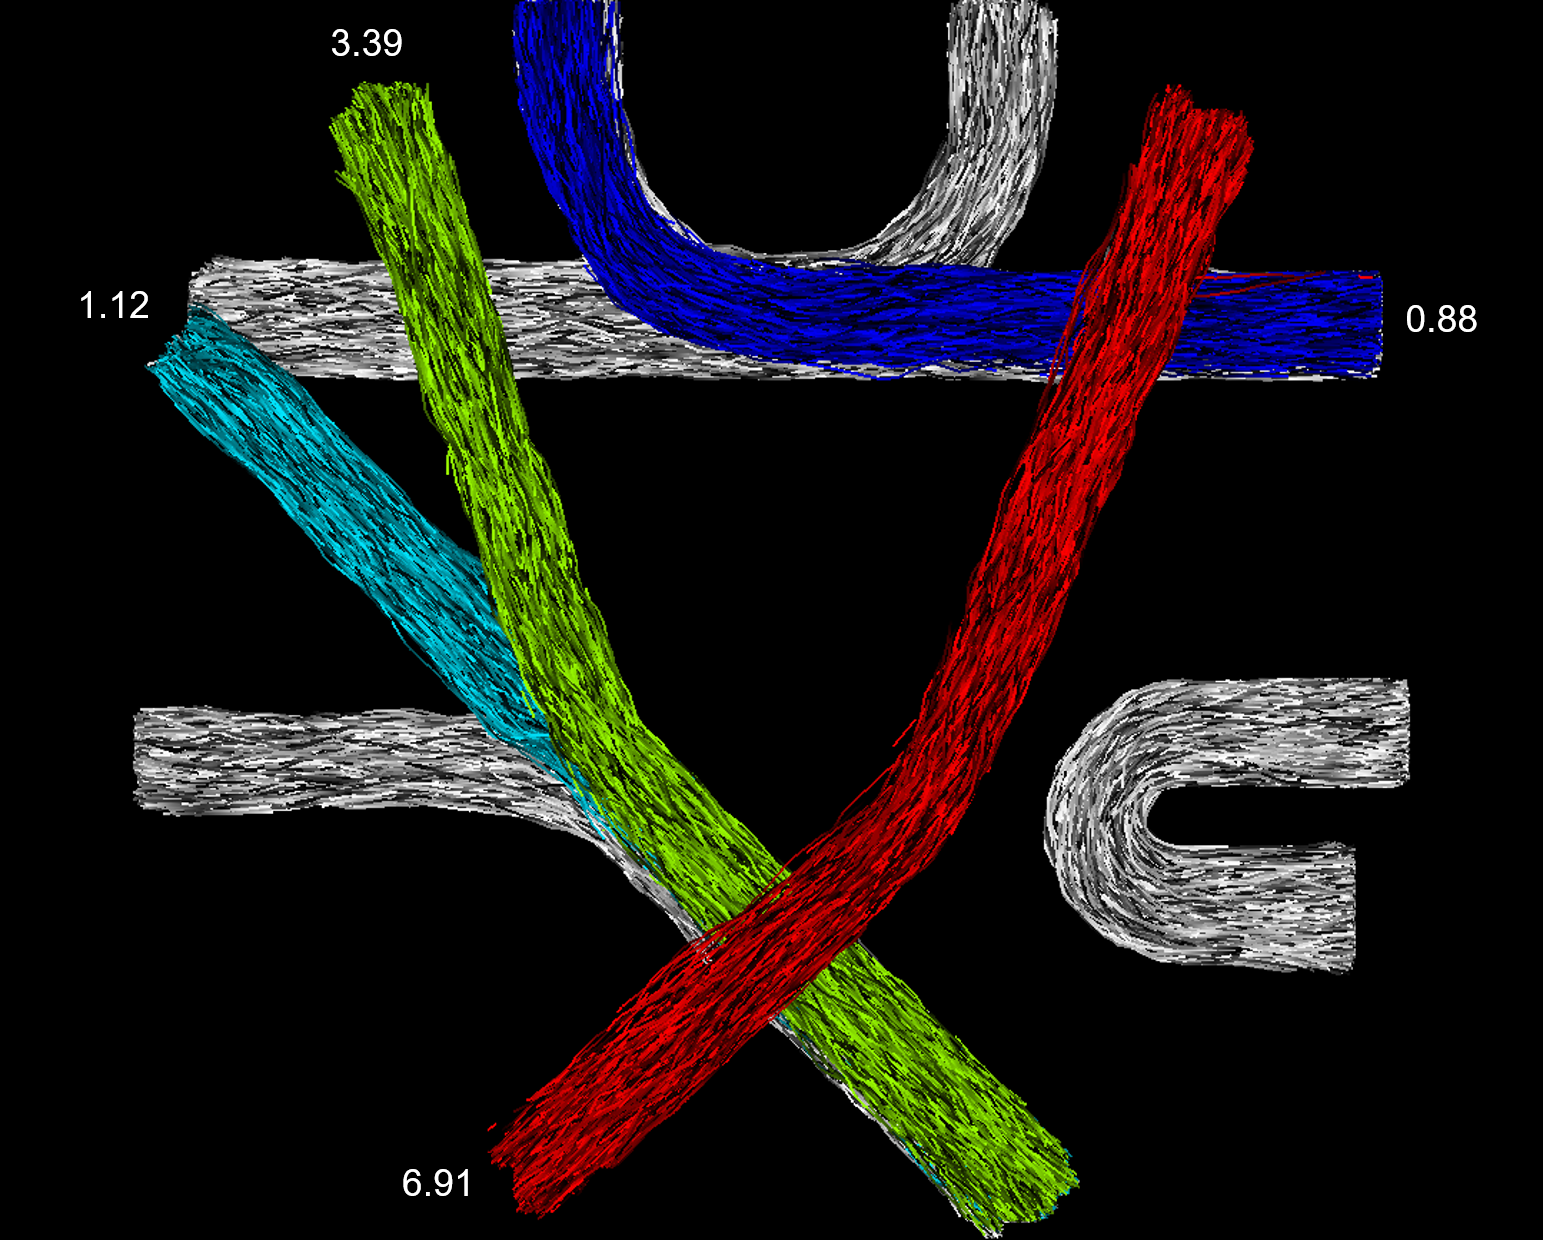
Experiment 2: For this experiment we employed a simulated replication of the FiberCup phantom8. It was repeated five times with four out of seven randomly selected anchor tracts (IVR 1.9).
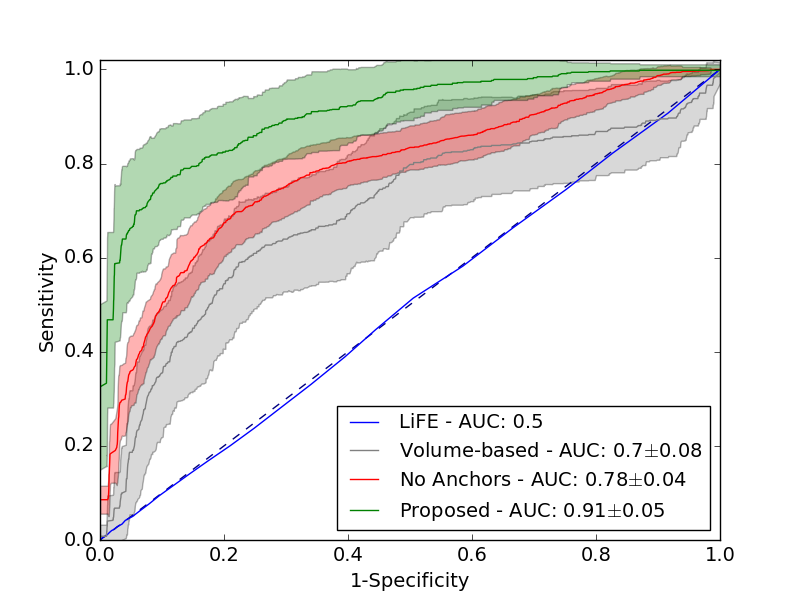
Experiment 3: Our main experiment is based on the brain-like phantom used in the ISMRM Tractography Challenge 20151,9. It was repeated fifty times with 50% of the ground truth bundles extracted from the tractogram randomly selected as anchor tracts in each repetition (IVR 7.7). For comparison, another fifty repetitions were performed completely without anchor tracts. Additional benchmarks were obtained using a volume-based ranking of the candidate tracts, as well as a streamline-weight-based ranking obtained with LiFE5.
All test-tractograms were obtained with probabilistic CSD tractography10,11. Since the ground truth is known, the anchor tracts were extracted by using a simple overlap criterion with the binary mask of the respective ground truth. In vivo, this step could be replaced by an atlas-based tract selection or similar techniques2,3,12.
Results
In Experiment 1, the highest ranked candidate in both configurations of the toy example was the correct tract corresponding to the ground truth. In Experiment 2, the proposed method ranked the three true candidate tracts highest in all repetitions (see Figure 2). Experiment 3 resulted in the ROC curves shown in Figure 3. The proposed method ($$$AUC=0.91$$$) performed significantly better than the benchmarks without anchor tracts ($$$AUC=0.78$$$, t-test: $$$p=1.7^{-25}$$$) and with volume-based scoring ($$$AUC=0.7$$$, t-test: $$$p=1.5^{-29}$$$). The LiFE scoring performed similar to random guessing ($$$AUC=0.5$$$).
Discussion
We proposed a novel concept that enables the quantification of the plausibility of fiber tracts by exploiting knowledge about known anchor tracts. Our results show that this approach has the potential to greatly improve the sensitivity-specificity tradeoff in tractography, which is a central issue of current tractography pipelines1. All methods will be published in the open-source Medical Imaging Interaction Toolkit (MITK)13. Future work will concentrate on analyzing the performance of the method in vivo as well as the optimal number and nature of the chosen anchor tracts.
Acknowledgements
This work was supported by the German Research Foundation (DFG) grant numbers MA 6340/10-1 and MA6340/12-1.References
- Maier-Hein KH, Neher PF, Houde JC, et al. The Challenge of Mapping the Human Connectome Based on Diffusion Tractography. Nature Communications 2017; 8(1): 1349.
- Wassermann D, Makris N, Rathi Y, et al. The White Matter Query Language: A Novel Approach for Describing Human White Matter Anatomy. Brain Structure and Function 2016; 221(9): 4705-21.
- Garyfallidis E, Côté MA, Rheault F, et al. Recognition of White Matter Bundles Using Local and Global Streamline-Based Registration and Clustering. NeuroImage 2017; in press.
- Sherbondy AJ, Dougherty RF, Ben-Shachar M, et al. ConTrack: Finding the Most Likely Pathways between Brain Regions Using Diffusion Tractography. Journal of Vision 2008; 8(9): 15.1-16.
- Pestilli F, Yeatman JD, Rokem A, et al. Evaluation and Statistical Inference for Human Connectomes. Nature Methods 2014; 11(10): 1058-63.
- Garyfallidis E, Brett M, Morgado Correia M, et al. QuickBundles, a Method for Tractography Simplification. Frontiers in Neuroscience 2012; 6(175).
- Smith RE, Tournier JD, Calamante F, et al. SIFT2: Enabling dense quantitative assessment of brain white matter connectivity using streamlines tractography. NeuroImage 2015; 119: 338-51.
- Neher PF, Laun FB, Stieltjes B, et al. Fiberfox: Facilitating the Creation of Realistic White Matter Software Phantoms. Magnetic Resonance in Medicine 2014; 72(5): 1460-70.
- Maier-Hein KH, Neher PF, Houde JC, et al. Tractography Challenge ISMRM 2015 Data. Zenodo 2015; https://doi.org/10.5281/zenodo.572345.
- Tournier JD, Calamante F, and Connelly A. Robust Determination of the Fibre Orientation Distribution in Diffusion MRI: Non-Negativity Constrained Super-Resolved Spherical Deconvolution. Neuroimage 2007; 35: 1459–1472.
- Tournier JD, Calamante F, and Connelly A. MRtrix: Diffusion Tractography in Crossing Fiber Regions. International Journal of Imaging Systems and Technology 2012; 22(1): 53–66.
- Yeatman JD, Dougherty RF, Myall NJ, et al. Tract Profiles of White Matter Properties: Automating Fiber-Tract Quantification. PloS One 2012; 7(11): e49790.
- Nolden M, Zelzer S, Seitel A, et al. The Medical Imaging Interaction Toolkit: Challenges and Advances : 10 Years of Open-Source Development. International Journal of Computer Assisted Radiology and Surgery 2013; 8(4): 607–20.
Figures