0040
A data-driven groupwise fiber clustering atlas for consistent white matter parcellation and anatomical tract identification of subjects across the lifespan1Harvard Medical School, Boston, MA, United States
Synopsis
We propose an anatomically curated white matter parcellation atlas generated from a large population of 100 healthy adult subjects, leveraging a well-established data-driven groupwise fiber clustering pipeline and expert neuroanatomy knowledge. We demonstrate the ability of the proposed method to parcellate a total of 541 subjects ranging in age from 1 day to 82 years. The results suggest that our parcellation algorithm provides high generalization and consistency of white matter parcellation and tract identification for subjects across the lifespan.
INTRODUCTION
Diffusion magnetic resonance imaging (dMRI)1 allows analysis of individual brain white matter (WM) fiber tracts, via a process called tractography2. Because whole brain tractography can contain thousands of fibers, tractography parcellation is needed for tract quantification and visualization. Previous studies have proposed applying a structural-image-based brain anatomical segmentation to identify anatomically meaningful WM parcels3–5. However, these methods cannot be generally applied to individuals across the lifespan due to the large brain anatomical variations during neurodevelopment and aging. For example, the brain anatomy of a neonate is largely different from that of an adult so that a common segmentation cannot be applied between them6.
In this study, we investigate a data-driven groupwise fiber clustering parcellation atlas to enable automated analysis of large datasets that contain subjects across the lifespan. Each fiber cluster in the atlas is annotated with an anatomical label based on expert judgement to provide an anatomically curated WM atlas. Whole brain WM parcellation and anatomical tract identification of a new subject are performed by applying the WM atlas to the subject’s tractography, without requiring a structural-image-based segmentation. We evaluate the proposed WM atlas using a total of 541 subjects ranging in age from 1 day to 82 years. Experimental results indicate high performance of the atlas in generalizing to individuals across the lifespan.
METHODS
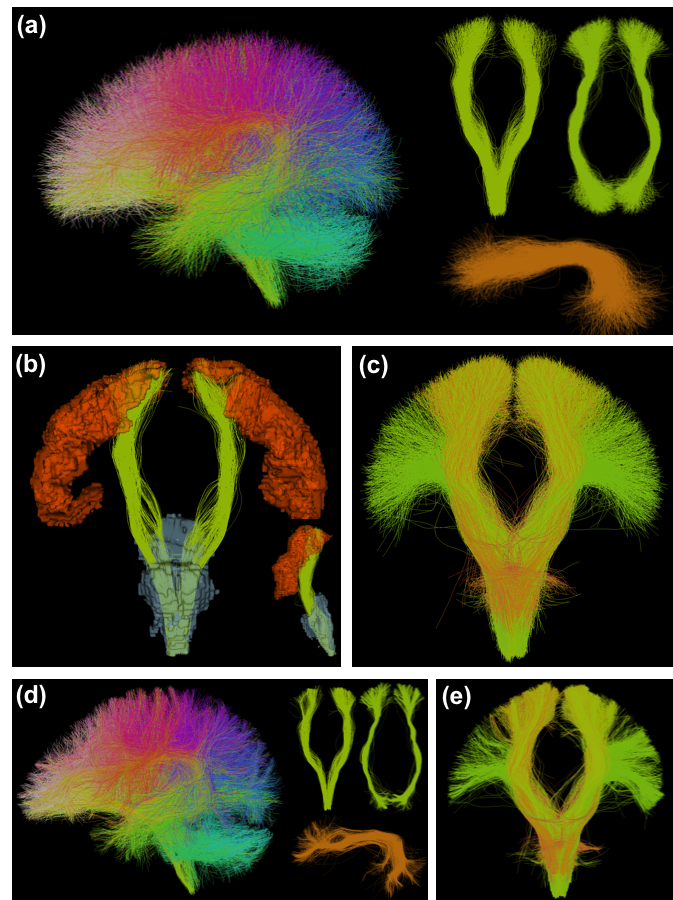
A whole brain FC WM parcellation atlas (Figure-1a) is generated using a well-established data-driven groupwise FC pipeline (https://github.com/SlicerDMRI/whitematteranalysis)7,8. A large population of 100 healthy adults from the Human Connectome Project (HCP)9 are used to generate an atlas of 800 fiber clusters to provide a good anatomical correspondence10,11. Then, each atlas cluster is annotated with an anatomical label based on expert judgement by a neuroanatomist (NM) to create an anatomically curated WM atlas. We leverage the anatomical tract definitions in the White Matter Query Language (WMQL)4 to initially compute a potential annotation of each cluster (Figure-1b), followed by expert judgement. As a result, each anatomical tract consists of multiple fiber clusters, where each cluster represents a WM structure and its anatomical variability (Figure-1c). A total of 26 anatomical tracts (including the corticospinal tract (CST), arcuate fasciculus (AF) and inferior occipitofrontal fasciculus (IOFF) and others) are annotated in the atlas. For a new subject, the new fibers are first aligned into the atlas space using a tractography-based registration 8 and then clustered according to the atlas clusters7 (Figure-1d). Anatomical tract annotation of the new subject (Figure-1e) is conducted by finding the subject-specific clusters that correspond to the annotated atlas clusters.
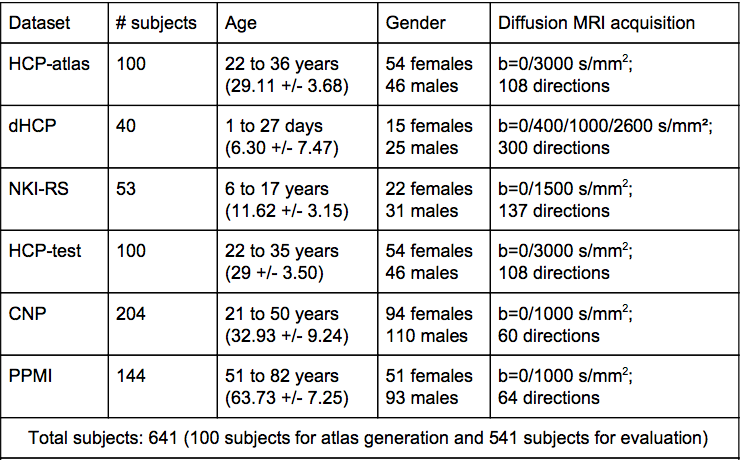
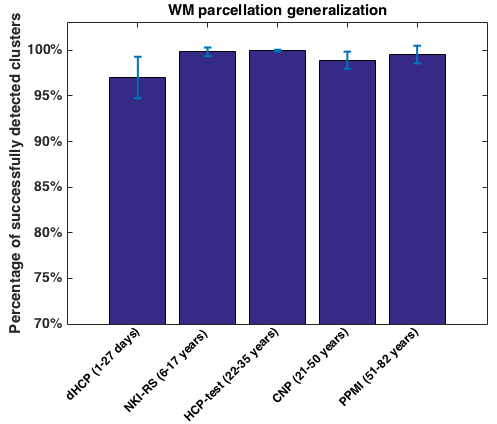
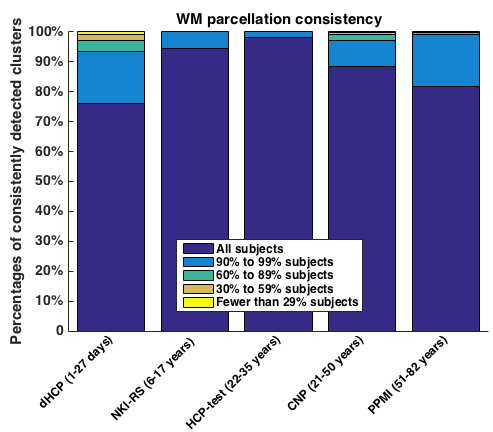
We test the obtained WM atlas using multiple datasets (Figure 2) that were acquired from individuals across the lifespan (a total of 541 subjects ranging in age from 1 day to 82 years). Quantitative evaluations are performed in terms of the WM parcellation generalization (i.e. for one subject, how many clusters are successfully detected) and the WM parcellation consistency (i.e. for one cluster, how many subjects have this cluster). In addition, we calculate how many among the 26 annotated anatomical tracts are identified in each subject to quantitatively evaluate the tract identification performance.
RESULTS
Figure 3 shows the WM parcellation generalization results. Most of the 800 fiber clusters (over 97%) are successfully detected across the different datasets. Figure 4 gives the WM parcellation consistency results across the datasets. The percentages of the clusters that are consistently detected across subjects are high. For example, in the HCP-test dataset, over 98% of the 800 fiber clusters are detected in all 100 subjects.
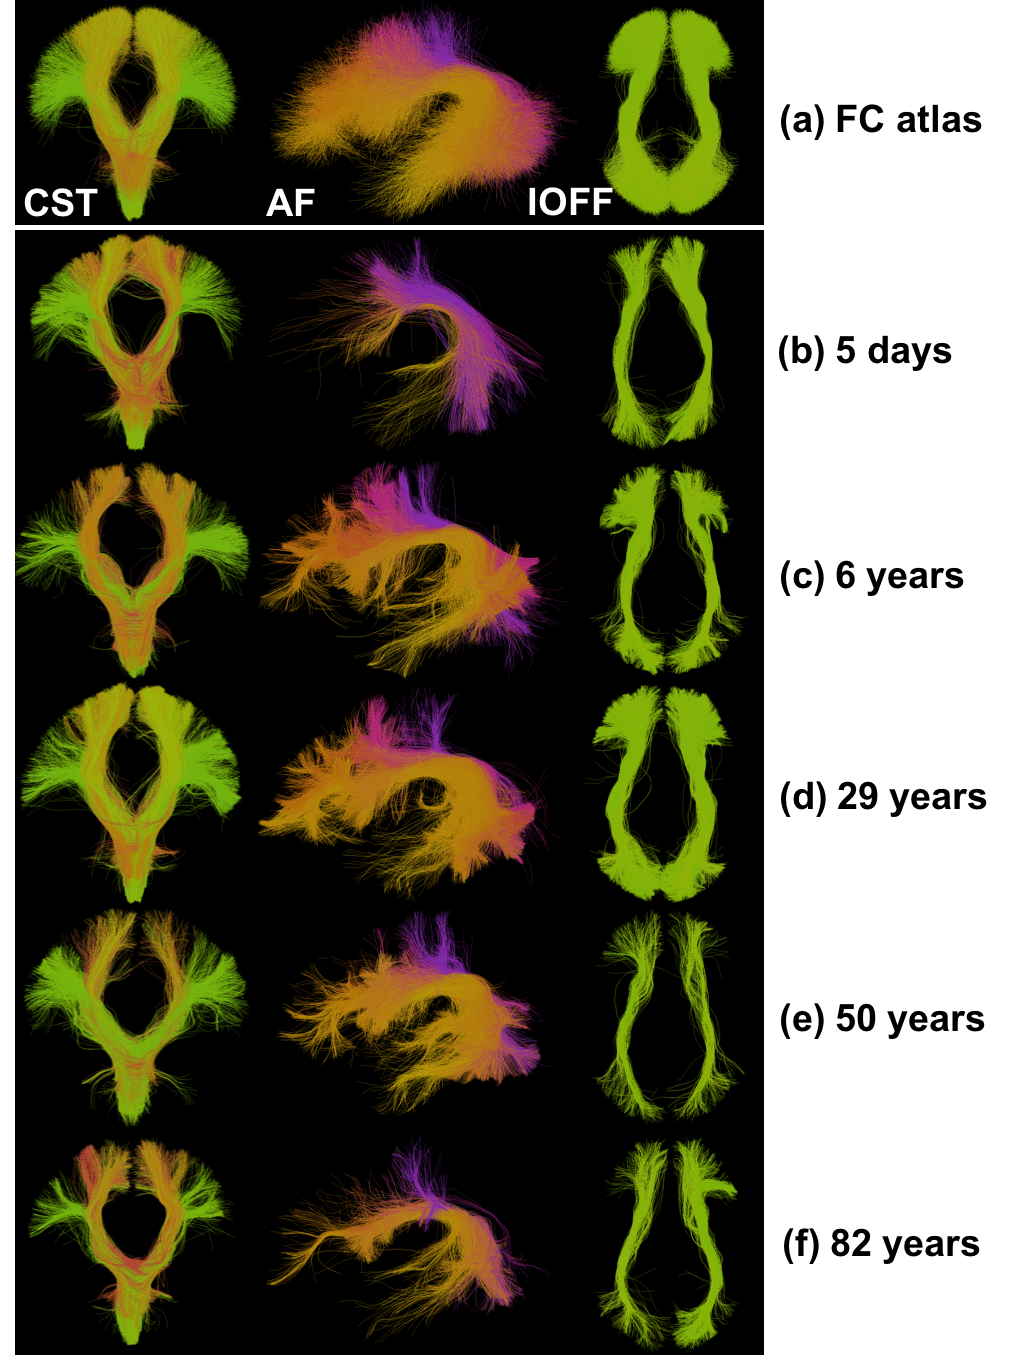
Figure 5 shows anatomical tracts identified in individual subjects across the lifespan. The CST, AF, and IOFF are selected for illustration. All 26 annotated anatomical tracts are successfully detected in all of the 541 subjects under study. We note that these tracts are identified using only tractography information and without requiring a structural-image-based segmentation.
DISCUSSION
The quantitative results indicate that our proposed atlas provides high WM parcellation generalization and consistency for subjects from multiple cohorts. The tract visualization results demonstrate successful identification of anatomical tracts in individuals across the lifespan. While enabling consistent WM parcellation and tract identification, the proposed atlas allows to capture expected anatomical variabilities between different cohorts. For example, the identified AF tracts in neonate subjects have fewer fibers when compared to the adult subjects (Figure-5b), which corresponds to the finding that neonates have incomplete development of the AF tract12.CONCLUSION
We generate an anatomically curated WM atlas from a large adult healthy population. The proposed atlas provides good performance in whole brain WM parcellation and anatomical tract identification in new subjects across the lifespan.Acknowledgements
NIH U01CA199459; NIH P41EB015898; NIH R01MH074794References
1. Basser, P. J., Mattiello, J. & LeBihan, D. MR diffusion tensor spectroscopy and imaging. Biophys. J. 66, 259–267 (1994).
2. Basser, P. J., Pajevic, S., Pierpaoli, C., Duda, J. & Aldroubi, A. In vivo fiber tractography using DT-MRI data. Magn. Reson. Med. 44, 625–632 (2000).
3. Wakana, S., Jiang, H., Nagae-Poetscher, L. M., van Zijl, P. C. M. & Mori, S. Fiber Tract–based Atlas of Human White Matter Anatomy. Radiology 230, 77–87 (2004).
4. Wassermann, D. et al. The white matter query language: a novel approach for describing human white matter anatomy. Brain Struct. Funct. 221, 4705–4721 (2016).
5. Yendiki, A. et al. Automated probabilistic reconstruction of white-matter pathways in health and disease using an atlas of the underlying anatomy. Front. Neuroinform. 5, 23 (2011).
6. Shi, F. et al. Infant brain atlases from neonates to 1- and 2-year-olds. PLoS One 6, e18746 (2011).
7. O’Donnell, L. J. & Westin, C.-F. Automatic tractography segmentation using a high-dimensional white matter atlas. IEEE Trans. Med. Imaging 26, 1562–1575 (2007).
8. O’Donnell, L. J., Wells, W. M., III, Golby, A. J. & Westin, C.-F. Unbiased Groupwise Registration of White Matter Tractography. in Medical Image Computing and Computer-Assisted Intervention 123-130 (2012).
9. Van Essen, D. C. et al. The WU-Minn Human Connectome Project: an overview. Neuroimage 80, 62–79 (2013).
10. O’Donnell, L. J. et al. Automated white matter fiber tract identification in patients with brain tumors. Neuroimage Clin 13, 138–153 (2017).
11. Zhang, F. et al. Supra-Threshold Fiber Cluster Statistics for Data-Driven Whole Brain Tractography Analysis. in Medical Image Computing and Computer Assisted Intervention 556-565 (2017).
12. Tak, H. J., Kim, J. H. & Son, S. M. Developmental process of the arcuate fasciculus from infancy to adolescence: a diffusion tensor imaging study. Neural Regeneration Res. 11, 937–943 (2016).
13. Makropoulos, A. et al. The Developing Human Connectome Project: a Minimal Processing Pipeline for Neonatal Cortical Surface Reconstruction. bioRxiv 125526 (2017).
14. Nooner, K. B. et al. The NKI-Rockland Sample: A Model for Accelerating the Pace of Discovery Science in Psychiatry. Front. Neurosci. 6, 152 (2012).
15. Poldrack, R. A. et al. A phenome-wide examination of neural and cognitive function. Sci Data 3, 160110 (2016).
16. Marek, K. et al. The Parkinson Progression Marker Initiative (PPMI). Prog. Neurobiol. 95, 629–635 (2011).
17. Norton, I. et al. SlicerDMRI: Open Source Diffusion MRI Software for Brain Cancer Research. Cancer Res. 77, e101–e103 (2017).
Figures