0037
Differential Sensitivity of Various Microstructural Metrics to Training-Induced White Matter Dynamics1Cardiff University Research Imaging Centre (CUBRIC), School of Psychology, Cardiff University, Cardiff, United Kingdom, 2Wellcome Centre for Integrative Neuroimaging, FMRIB, Nuffield Department of Clinical Neurosciences, University of Oxford, Oxford, United Kingdom, 3Department of Neurobiology, Tel Aviv University, Tel Aviv, Israel, 4Sagol School of Neuroscience, Tel Aviv University, Tel Aviv, Israel
Synopsis
Previous in-vivo MRI studies on training-induced WM microstructural dynamics were mostly based on DTI measurements showing changes in FA. The non-specificity of FA as a WM marker stimulated us to obtain a more specific characterization of WM microstructural changes. Using multi-parametric MR with the ‘Tractometry’ approach we show significant changes in the fornix post a navigation working memory task. Critically, we report here for the first time significant microstructural changes with susceptibility, shown in vast areas of the fornix. Fr, MD, RD and λ1 also show significant changes but in limited areas of the fornix.
Introduction
Most previous reports on training-induced white matter (WM) dynamics in vivo relied on DT-MRI metrics, for example showing FA changes in tracts such as the fornix1. FA has been shown to be modulated by many factors and is widely regarded as a non-specific white matter marker2. With the aim of obtaining a more specific and sensitive characterization of WM microstructural dynamics, we combined multi-parametric MR with the ‘Tractometry’3,4 approach on rats undergoing training. We demonstrate significant microstructural changes in the fornix induced by a navigation working memory task. Critically we report, for the first time, training-induced changes in quantitative susceptibility. While MD and RD showed less change, no significant changes in FA were seen. Our results suggest that susceptibility is more sensitive than DT-MRI metrics to training-induced plasticity.Methods and Analysis
13 Wistar rats, 2.5 months of age, were scanned before and after 5 days of training in a water maze. Acquisition: MRI data were acquired on a 7T/30 Bruker MRI scanner (Bruker, Germany) equipped with 400 mT/m gradients. The scanning protocol comprised a series of MR contrasts, including: (i) 2D CHARMED – isotropic image resolution of 370 μm (32 axial slices), TR/TE= (8 s/28 ms), NEX = 1, b-values = 1000, 2000 and 4000 s/mm2, ∆/δ = (14 ms/7.5 ms), 30 noncollinear directions; (ii) 3D qMT – 2 flip angles of 1000o and 2800o with 12 offsets (ranging between 1000 and 30000 Hz) and 3 images with no offset; (iii) 3D QSM – doubled in-plane resolution (due to analysis limitations) of 185x185 μm, 8 TEs (first TE=3.4 ms, echo-spacing=5.6 ms). Total scan time ~75 minutes. Analysis: DT-MRI analysis was performed with RESTORE5 in ExploreDTI6 using data from the b=1000 s/mm2 shell of the CHARMED acquisition. CHARMED, MTR and QSM data were analyzed using in-house MATLAB (Mathworks) scripts. The derived DT-MRI metrics, restricted volume fraction (Fr), magnetization transfer ratio (MTR), r2* and susceptibility maps were co-registered within each rat (SPM8). RESDORE7 was applied on data from the b=2000 s/mm2 shell before performing whole brain damped Richardson-Lucy tractography8. The fornix was manually segmented in each data set with the operator blinded to ‘pre- vs post-training status’ to avoid bias. An in-house MATLAB tool4 was then used to divide each fornix reconstruction into 10 corresponding segments, based on shape-similarity. Lastly, for each of the 10 tract segments, the median values of each metric were compared pre- and post-training using a paired t-test (with an FDR correction).Results
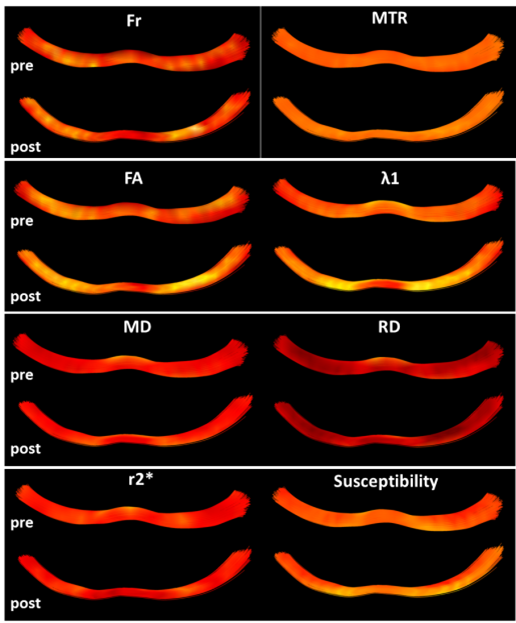
Figure 1 shows the different metrics projected onto a representative reconstructed fornix of a pre- and post-task rat. Brighter colors represent higher values. The general trends of increase/decrease following training can be seen for most of the metrics. Figure 2 shows the result of the automated division of the tract reconstructions into 10 segments4, demonstrating excellent correspondence between segment locations on the pre- and post-training fornix reconstructions. Figure 3 shows, for all metrics, and for each of the 10 segments, the median value and standard error for the pre- and post-task groups. Note that while MTR and FA both show trend of increase following training, nothing survived the FDR correction (noting the large within group variation in MTR). The metric showing the most significant changes and in the most segments, was susceptibility. Fr, λ1, MD and RD also show a significant reduction of the values in a similar segment of the tract.Discussion
This study supports previous reports of training-induced microstructural changes in the fornix1, mainly using FA or MD. Here, we provide the first evidence that other, non-DT-MRI, metrics may be more sensitive to WM dynamics and may reveal new insights into the time course and nature of microstructural plasticity. Note that while Fr and some DT-MRI metrics showed some significant training-induced changes, there were no significant changes in FA. In contrast, susceptibility shows significant change in extensive sections of the fornix. We therefore suggest that enhanced sensitivity to training-induced plasticity may be obtained by supplementing DT-MRI metrics with complementary markers that rely on different biophysical mechanisms to diffusion.Acknowledgements
This work was supported by a Wellcome Trust Investigator Award (096646/Z/11/Z) and a Wellcome Trust Strategic Award (104943/Z/14/Z).References
[1] S. Hofstetter, I. Tavor, S. Tzur Moryosef, Y. Assaf. Short-term learning induces white matter plasticity in the fornix. J. Neurosci 2013;33(31):12844-12850.
[2] S. De Santis, M. Drakesmith, S. Bells, Y. Assaf, D.K. Jones. Why diffusion tensor MRI does well only some of the time: variance and covariance of white matter tissue microstructure attributes in the living human brain. Neuroimage. 2014;89(100):35-44.
[3] S. Bells, M. Cercignani, S. Deoni, Y. Assaf, O. Pasternak, C.J. Evans, A. Leemans, D.K. Jones. “Tractometry” – comprehensive multi-modal quantitative assessment of white matter along specific tracts. 19th Annual Meeting of Int. Soc. Magn. Reson. Med. (2011), Montreal, Canada, #0678
[4] G. D. Parker, D. Marshall, P.L. Rosin, N. Drage, S. Richmond, D.K. Jones. Fast and fully automated clustering of whole brain tractography results using shape-space analysis. 21st Annual Meeting of Int. Soc. Mag. Reson. Med. (2013) Salt Lake City, Utah, USA, #0778
[5] L.C. Chang, D.K. Jones, C. Pierpaoli. RESTORE: robust estimation of tensors by outlier rejection. Magn. Reson. Med. 2005;53(5):1088-95.
[6] A. Leemans, B. Jeurissen, J. Sijbers, D.K. Jones. ExploreDTI: a graphical toolbox for processing, analyzing and visualizing diffusion MR data. 17th Annual Meeting of Int. Soc. Mag. Reson. Med. (2009), Hawaii, USA, #3537
[7] G. D. Parker, D. Marshall, P.L. Rosin, N. Drage, S. Richmond, D.K. Jones. RESDORE: robust estimation in spherical deconvolution by outlier rejection. 21st Annual Meeting of Int. Soc. Mag. Reson. Med. (2013) Salt Lake City, Utah, USA, #3148
[8] F. Dell’Acqua, P. Scifo, G. Rizzo, M. Catani, A. Simmon, G. Scotti, F. Fazio. A modified damped Richardson-Lucy algorithm to reduce isotropic background effects in spherical deconvolution. NeuroImage 2010;49:1446-1458.
Figures