0034
MP2RAGEME: T1, T2* and QSM mapping in one sequence at 7 Tesla1Radiology, Academic Medical Center, Amsterdam, Netherlands, 2Spinoza Centre for Neuroimaging, Amsterdam, Netherlands, 3Social Brain Laboratory, Netherlands Institute for Neuroscience, Amsterdam, Netherlands, 4Max Planck Institute for Human Cognitive and Brain Sciences, Leipzig, Germany, 5Donders Institute for Brain, Cognition and Behaviour, Nijmegen, Netherlands
Synopsis
Quantitative T1, T2* and QSM information can be acquired in a single acquisition, using a multi-echo extension of the MP2RAGE sequence, MP2RAGEME. This simultaneous acquisition results in large time savings, perfectly coregistered data and minimal image quality differences. Following a correction for residual transmit B1-sensitivity quantitative T1 and T2* and QSM-values were in excellent agreement with those obtained from separately acquired MP2RAGE and GRE data. Values were also in correspondence with literature. From the MP2RAGEME data, a multiparametric cortical parcellation was obtained, as well as a combined arterial and venous map.
Introduction
T1, T2* and QSM are widely used contrasts at 7T and mapping these properties quantitatively is more and more sought after. While many approaches can be used to measure these in reasonable times, challenges arise in terms of inhomogeneities or bias in the estimated quantities and precision of their alignment. Here, we present an extension of the MP2RAGE sequence which allows measurement of T1 and T2* simultaneously, and show that the measured quantities agree well with expected measures after correction of B1-inhomogeneities. Simultaneous acquisition avoids the need for co-registration and subsequent re-sampling of separately acquired scans and allows time savings while compromises to both maps are minimal.Methods
Ten volunteers were scanned at 7T (Philips,NL) using the Multiple Interleaved Scanning Sequences (MISS) environment. The MP2RAGE sequence(1) was modified so as to acquire multiple echoes in the second inversion while maintaining the single-echo acquisition in the first inversion (Figure 1). MP2RAGEME was compared with separately acquired MP2RAGE and multi-echo GRE data:
- MP2RAGEME: TRMP2RAGE/TR1/TR2,TE1-4= 6.72s/6.2ms/31.4ms,3/11.5/19/27.5ms, TI1/TI2=670/3855ms ,α1/α2= 7/6o. Scan duration: 16:30. Deadtime: 6%
- MP2RAGE: TRMP2RAGE/TR/TE= 6s/6.2ms/3ms, TI1/TI2=1000ms/3200ms,α1/α2=7/6o Scan duration: 14:45. Deadtime: 52%
- GRE: TR/α=31.4ms/12o, TE1-4=3/11.5/19/27.5ms. Scan duration: 11:35. Deadtime: 0%
- B1map: DREAM-sequence, voxel size=8.5mm3, flip angle 60o.
All data were acquired with voxel size=0.64mm3, FOV=205*205*164 and SENSE acceleration 1.7(LR)*1.7(AP).
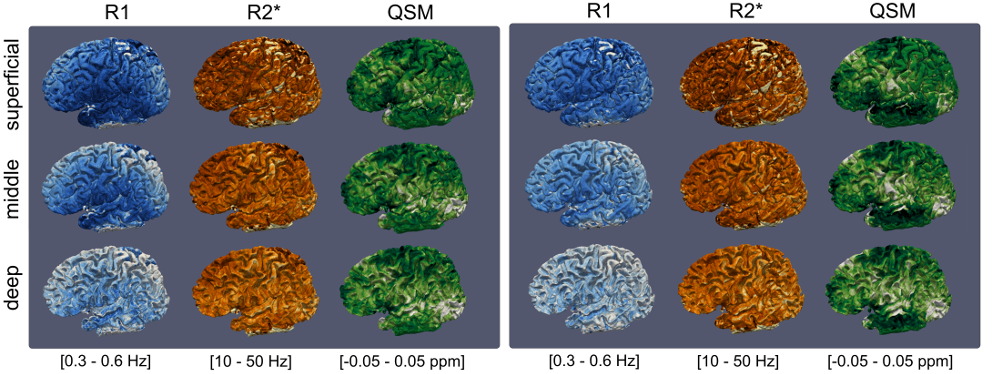
T2* maps were obtained from the GRE’s and MP2RAGEME using a single-exponential fit. Quantitative Susceptibility Maps were obtained and averaged from TE2-4 of the GRE and MP2RAGEME data with respect to CSF using STISuite(2). T1-weighted images were corrected for residual transmit B1 inhomogeneities(3) and subsequently processed using a dedicated MP2RAGE segmentation pipeline(4), including segmentation using the CRUISE algorithm from CBStools (http://www.nitrc.org/projects/cbs-tools) , a volume-preserving cortical layering method(5) and a vascular segmentation method(6) to obtain cortical surface reconstructions at three different cortical depths and cortical and sub-cortical veins. The segmentation was used to obtain average T1 and median T2* values from the following ROIS: White matter (all), nucleus caudate, putamen, thalamus, cortical grey matter (all). For the red nucleus and STN ROIs were defined semi-automatically using ITKsnap (http://www.itksnap.org).
Results
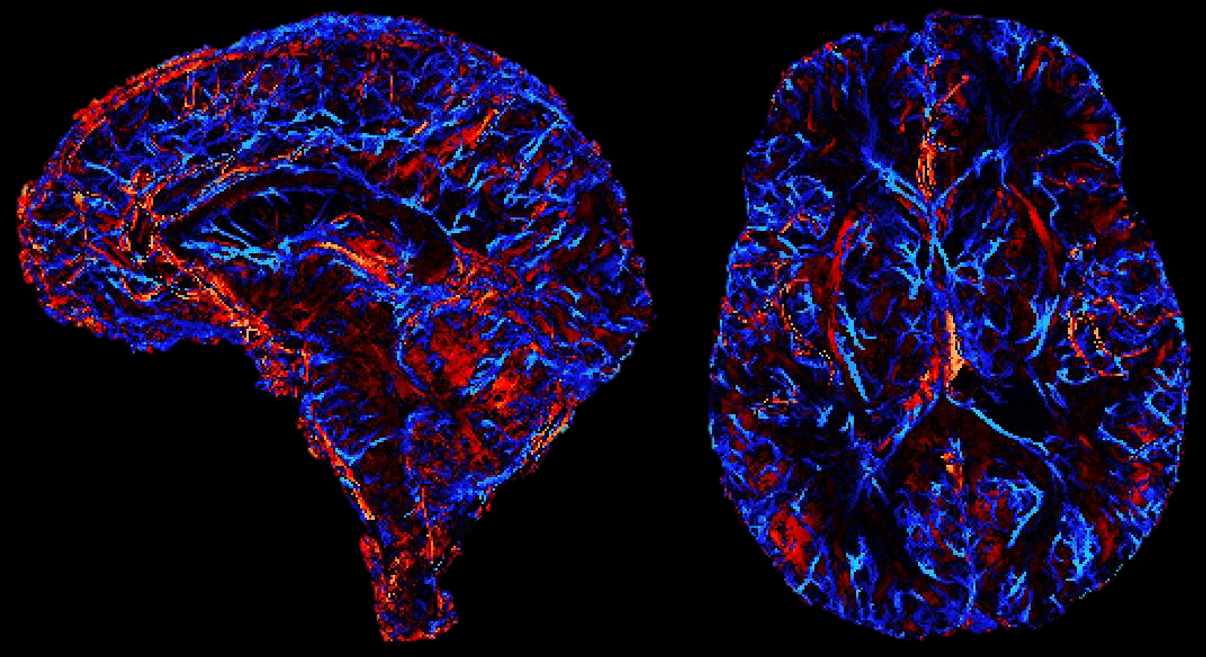
For this protocol, MP2RAGEME offers a 40% time saving over separate scans as the GRE is acquired in the empty time of the TRMP2RAGE. Image quality overall was comparable to that from separately acquired MP2RAGE and GRE data (Figure 2). Surfaces (for an example see Figure 3) generated from the MP2RAGEME data differed by 0.09±0.12 (WM/GM) and 0.40±0.50 (GM/CSF) voxels from those generated from separately acquired data. Figure 4 shows a combined arterial and venous map, by taking the maximum intensity projection of T1 and the minimum intensity projection of T2*.
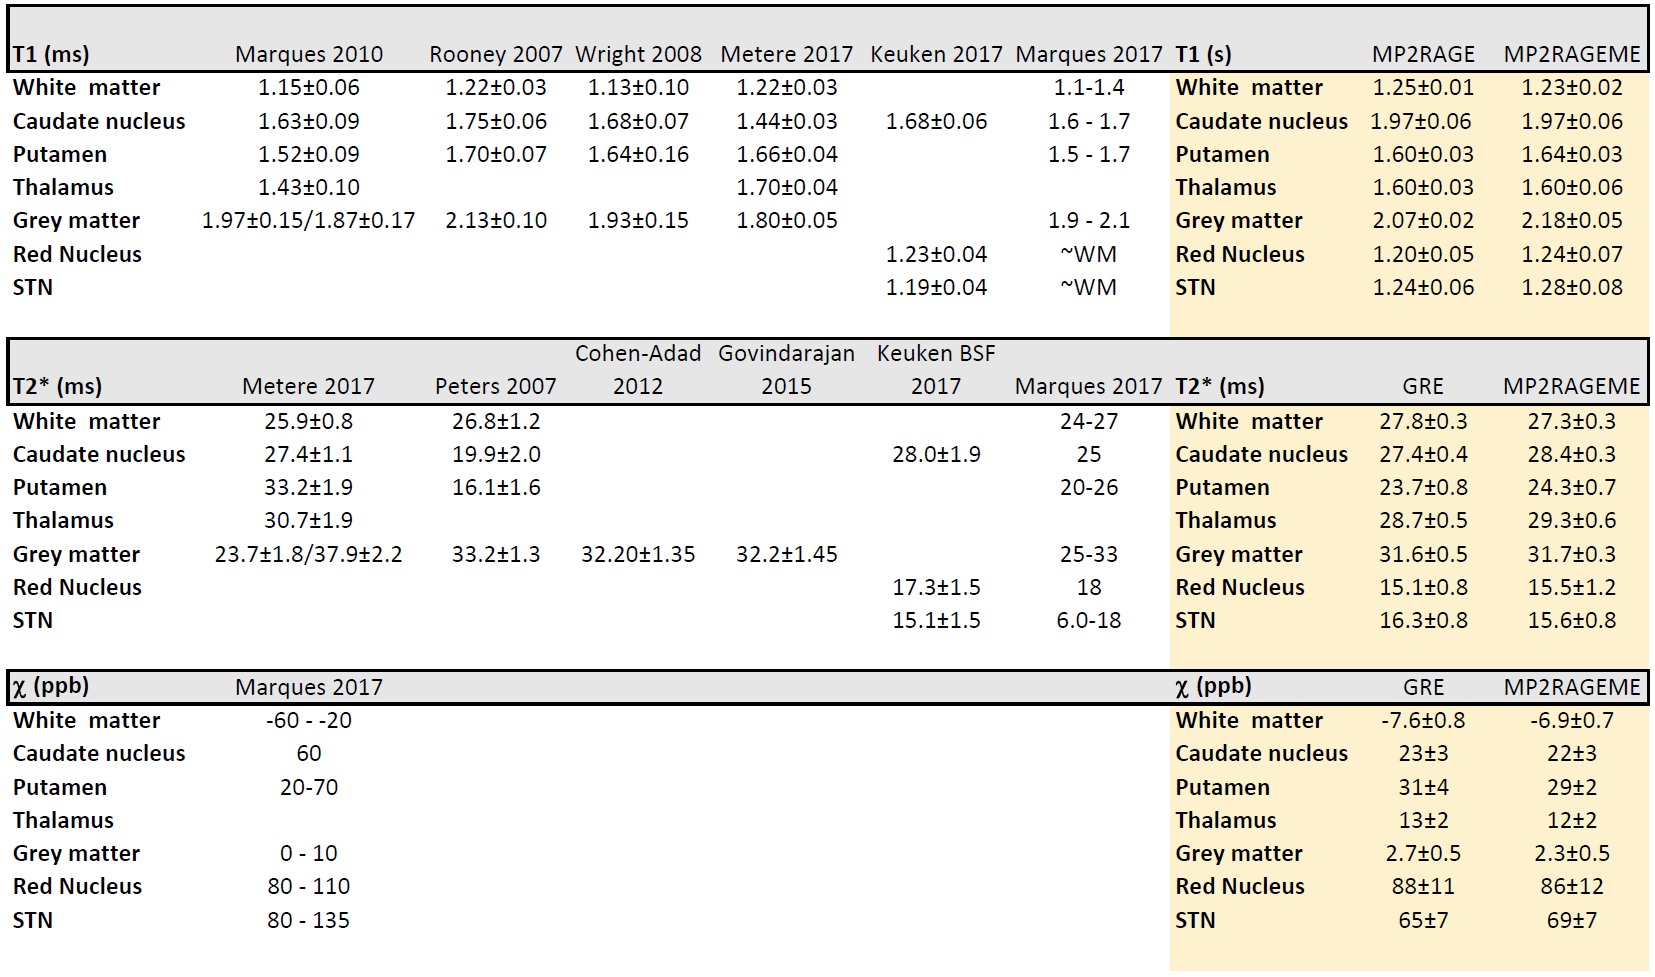
Tables 1 summarizes the obtained quantitative T1 and T2* and QSM-values, in comparison with values obtained from the recent literature. All MP2RAGEME-obtained values are in very good agreement with the values obtained from the MP2RAGE and GRE from the same subjects.
Discussion
The longer readout in the second GRE block of the MP2RAGEME necessitated some changes: TIs were shortened(TI1) and extended(TI2) and TRMP2RAGE was extended from 6s to 6.7s. These changes resulted in higher B1-sensitivity in the MP2RAGEME T1-map, which was negligible in both MP2RAGE and MP2RAGEME after correction using the DREAM B1map. The flip angles in the MP2RAGEME were set for optimal T1 contrast while the Ernst angle was used in the ME-GRE. The absence of a co-registration step resulted in more visible spatial details in the GRE-based images (Figure 2cd vs gh). The lower SNR expected from these sequence modifications did not result in systematic differences between the measured quantitative values and the literature values. Some ROIs were affected by imperfect segmentation: the Caudate region included some CSF, leading to erroneously long T1 and T2* values. Red nucleus T2* values were shorter than expected from literature (Table 1), possibly due to segmentation errors. Since the white matter mask contained subcortical structures, reported QSM-values in white matter are higher than in the literature.Conclusion
Quantitative T1, T2* and QSM information can be acquired in a single acquisition, resulting in large time savings, perfectly coregistered data and minor image quality differences.Acknowledgements
No acknowledgement found.References
(1) Marques, J.P., Kober, T., Krueger, G., Zwaag, W. van der, Moortele, P.-F.V. de, Gruetter, R., 2010. MP2RAGE, a self bias-field corrected sequence for improved segmentation and T1-mapping at high field. NeuroImage 49, 1271–1281.
(2) Liu C, Li W, Tong K a., Yeom KW, Kuzminski S. Susceptibility-weighted imaging and quantitative susceptibility mapping in the brain. J. Magn. Reson. Imaging 2015,23-41.
(3) Marques JP, Gruetter R. New Developments and Applications of the MP2RAGE Sequence - Focusing the Contrast and High Spatial Resolution R1 Mapping. PLoS One 2013;8.
(4) Bazin, P.-L., Weiss, M., Dinse, J., Schä̈fer, A., Trampel, R., Turner, R., 2014. A computational framework for ultra-high resolution cortical segmentation at 7 Tesla. NeuroImage 93, 201–9.
(5) Waehnert, M.D., Dinse, J., Schäfer, A., Geyer, S., Bazin, P.-L., Turner, R., Tardif, C.L., 2016. A subject-specific framework for in vivo myeloarchitectonic analysis using high resolution quantitative MRI. NeuroImage 125, 94–107.
(6) Bazin, P.-L., Plessis, V., Fan, A.P., Villringer, A., Gauthier, C.J., 2016. Vessel segmentation from quantitative susceptibility maps for local oxygenation venography. IEEE, pp. 1135–1138.
Figures
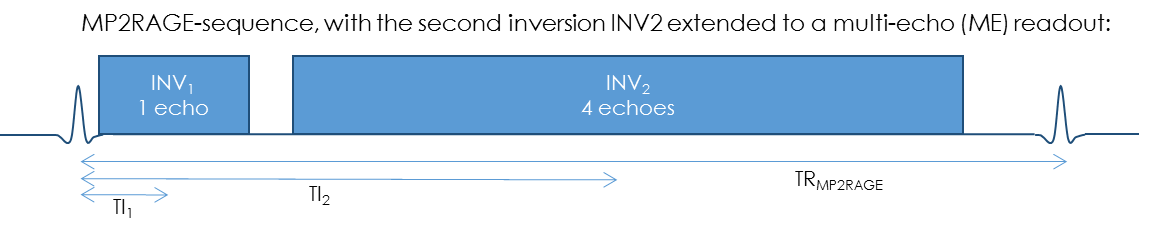
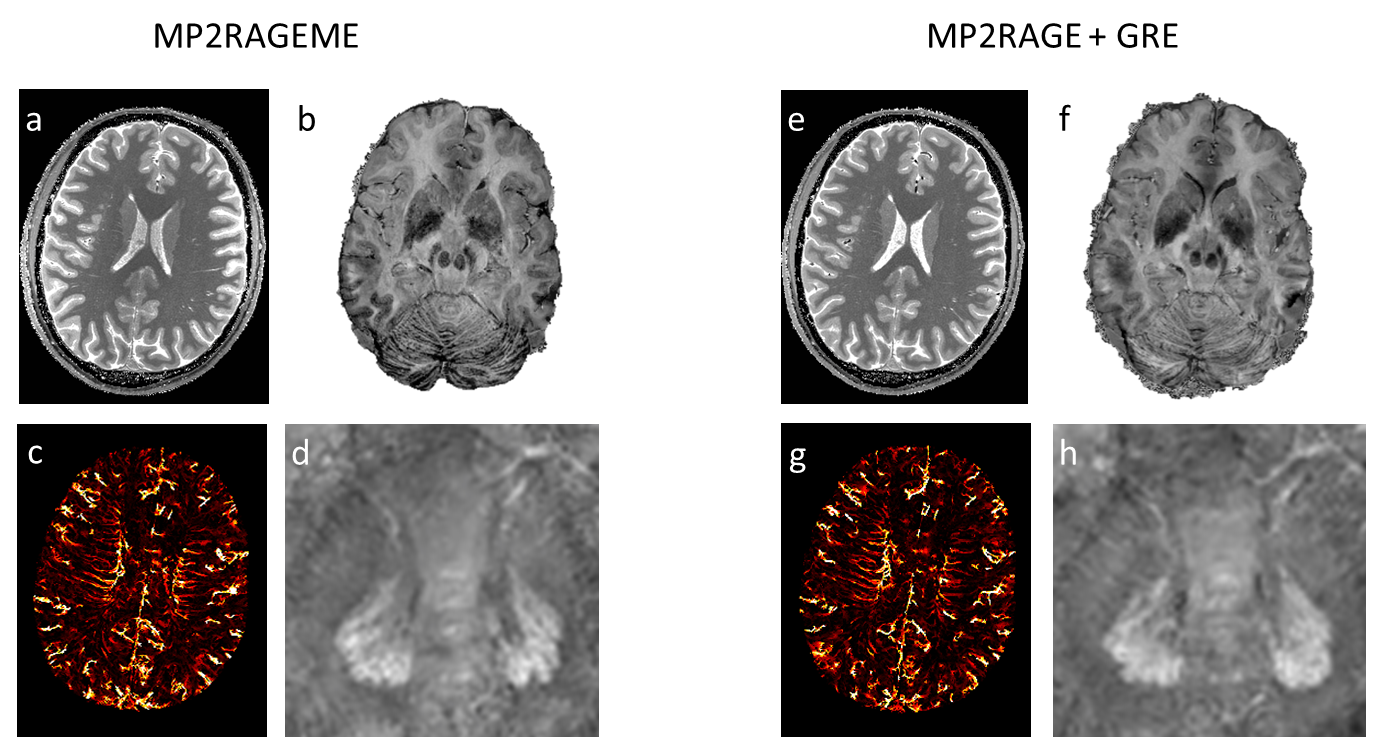
Figure 2. Example data from MP2RAGEME (a-d) and separately acquired MP2RAGE and GRE data (e-h).
a) T1-map from MP2RAGEME
b) SVD combination of T1-weighted images and QSM from MP2RAGEME
c) MinIP showing veins from MP2RAGEME
d) QSM map showing the dentate nuclei from MP2RAGEME.
e) T1-map from MP2RAGE
f) SVD combination of T1-weighted MP2RAGE images and QSM from the GRE
g) MinIP showing veins from GRE
h) QSM map showing the dentate nuclei from GRE.