0033
Multi-echo Magnetic Resonance Fingerprinting: Simultaneous derivation of T1, T2, B0, T2*, T2', Tx/Rx phase maps, and T2*-corrected magnitude maps in in-vivo and phantom studies1Tomographic Imaging, Philips Research Europe, Hamburg, Germany
Synopsis
This work describes a Magnetic Resonance Fingerprinting (MRF) implementation using multiple echo acquisitions within one TR. In this way, B0, T2*, R2', and Tx/Rx phase maps are derived in addition to the standard M0, T1, and T2 maps, as demonstrated in in-vivo and phantom experiments. Accounting for the difference in T2 and T2*, the inherent bias of MRF-derived M0 maps can be corrected. The derived R2' map may have diagnostic relevance for neurodegenerative diseases.
Introduction
Magnetic
Resonance Fingerprinting (MRF) is a universal method for multi-parametric
measurement1,2, based on matching signals to pre-calculated dictionaries. Typically, trains of several hundred RF pulses with
varying flip angle are employed to encode both $$$T_1$$$ and $$$T_2$$$ and possibly also other parameters. Most implementations rely on gradient-spoiled acquisition, so that magnitude maps are intrinsically affected by $$$T_2^*$$$ decay.
Here we show how to derive additional parameters from the same measurement without the need for encoding them in the dictionary and demonstrate possible applications in in-vivo and phantom measurements. Our approach as based on the sampling of several echoes within each TR period. In this way, we determine $$$B_0$$$, $$$T_2^*$$$, and Tx/Rx phase maps before starting the MRF matching procedure. In combination with the standard quantitative MRF maps, we derive $$$R'_2$$$, which has been
found to be correlated with iron content3, and show an in-vivo example. Furthermore, we use the additional information to correct the MRF magnitude map for $$$T_2^*$$$ effects, thereby deriving a more reliable estimate of the proton density.
Methods
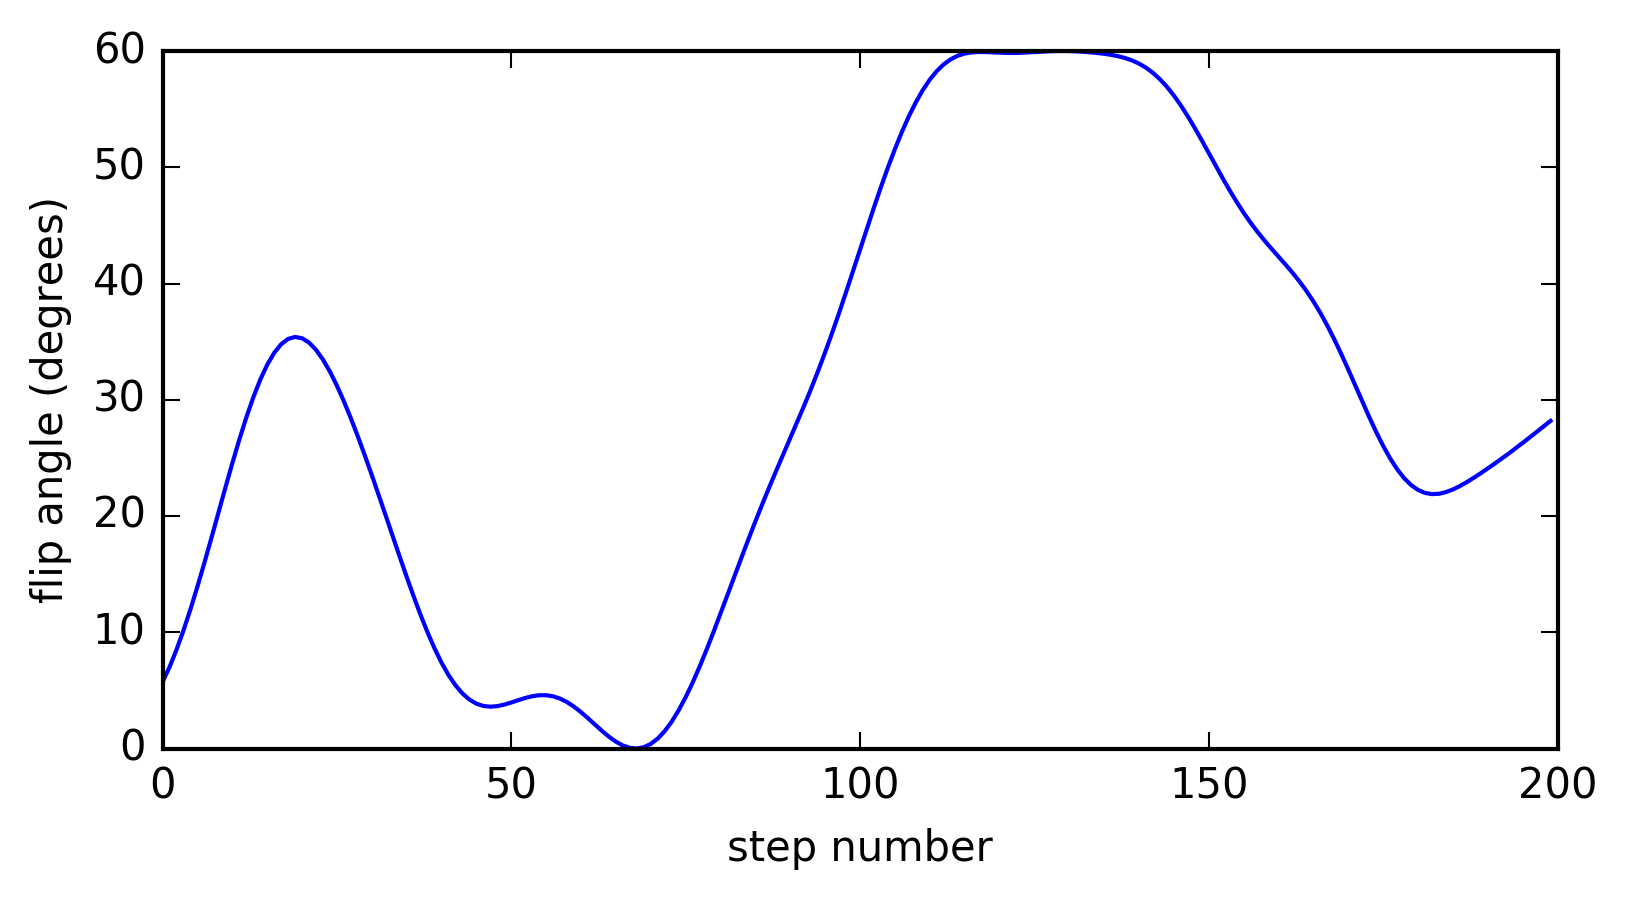
The extended multi-echo MRF sequence is shown in Figure 1. We use a gradient-spoiled MRF scheme2 with a train of 200 RF pulses (Figure 2), preceded by an inversion pulse. The repetition time is constant at TR=TI=30ms, with three acquisition windows at TE1=7ms, TE2=14ms, and TE3=21ms. A Cartesian sampling pattern with SENSE factor 3 and a delay of 5s between fingerprint trains was employed. Experiments were performed on an Ingenia 1.5T system (Philips, Best, The Netherlands) using a 13-channel head coil. Subjects of the measurements were a phantom (High Precision Devices, Inc., Model 130) consisting of 14 probes with 83ms<T1<2400ms and 8ms<T2<940ms, and a healthy volunteer, from whom written informed consent was obtained.
With M0 being the magnetization state after any of the RF pulses, the acquired signal at TE can be expressed as
$$S(\mathrm{TE})=M_0 \exp\left(-\frac{\mathrm{TE}}{T_2^*}\right) \exp(-i(\Phi_\mathrm{TxRx} + 2\pi f \mathrm{TE})),$$
where $$$\Phi_{TxRx}$$$ is the transmit-receive phase and $$$f$$$ is the off-resonance field. Having echoes at multiple TE available, we can calculat the off-resonance as
$$f=\frac{ \mathrm{angle}\left<S(\mathrm{TE}_1), S(\mathrm{TE}_2)\right> }{ 2\pi (\mathrm{TE}_2 - \mathrm{TE}_1) },$$
where the signals are averaged over the MRF pulse train and $$$\left<\cdot,\cdot\right>$$$ is the complex inner product, the transmit-receive phase as
$$\Phi_\mathrm{TxRx}=\Phi(\mathrm{TE}_1) - 2\pi f \mathrm{TE}_1,$$
and finally derive $$$T_2^*$$$ by fitting an exponential decay to the echo magnitudes. Before fitting, we excluded low-SNR samples and calculated a weighted average of the echo magnitude ratios over all remaining samples.
Dictionary matching was performed using the first echo with a dictionary encoding T1 in the range 10ms to 3000ms and T2 in the range 5ms to 1200ms with adaptive step size. It was then possible to calculate $$$R'_2$$$ as
$$R'_2 = \frac{1}{T_2^*} - \frac{1}{T_2}.$$
The conventional magnitude maps extracted from our MRF measurements are based on the dictionary signals, assuming that a T2 instead of a $$$T_2^*$$$ decay takes place during TE. In order to correct the magnitude map, we can use the $$$T_2^*$$$ map and calculate
$$M_{0,corr} = M_0 \frac{\exp(-\mathrm{TE} / T_2)}{ \exp(-\mathrm{TE} / T_2^*)}.$$
Results and Discussion
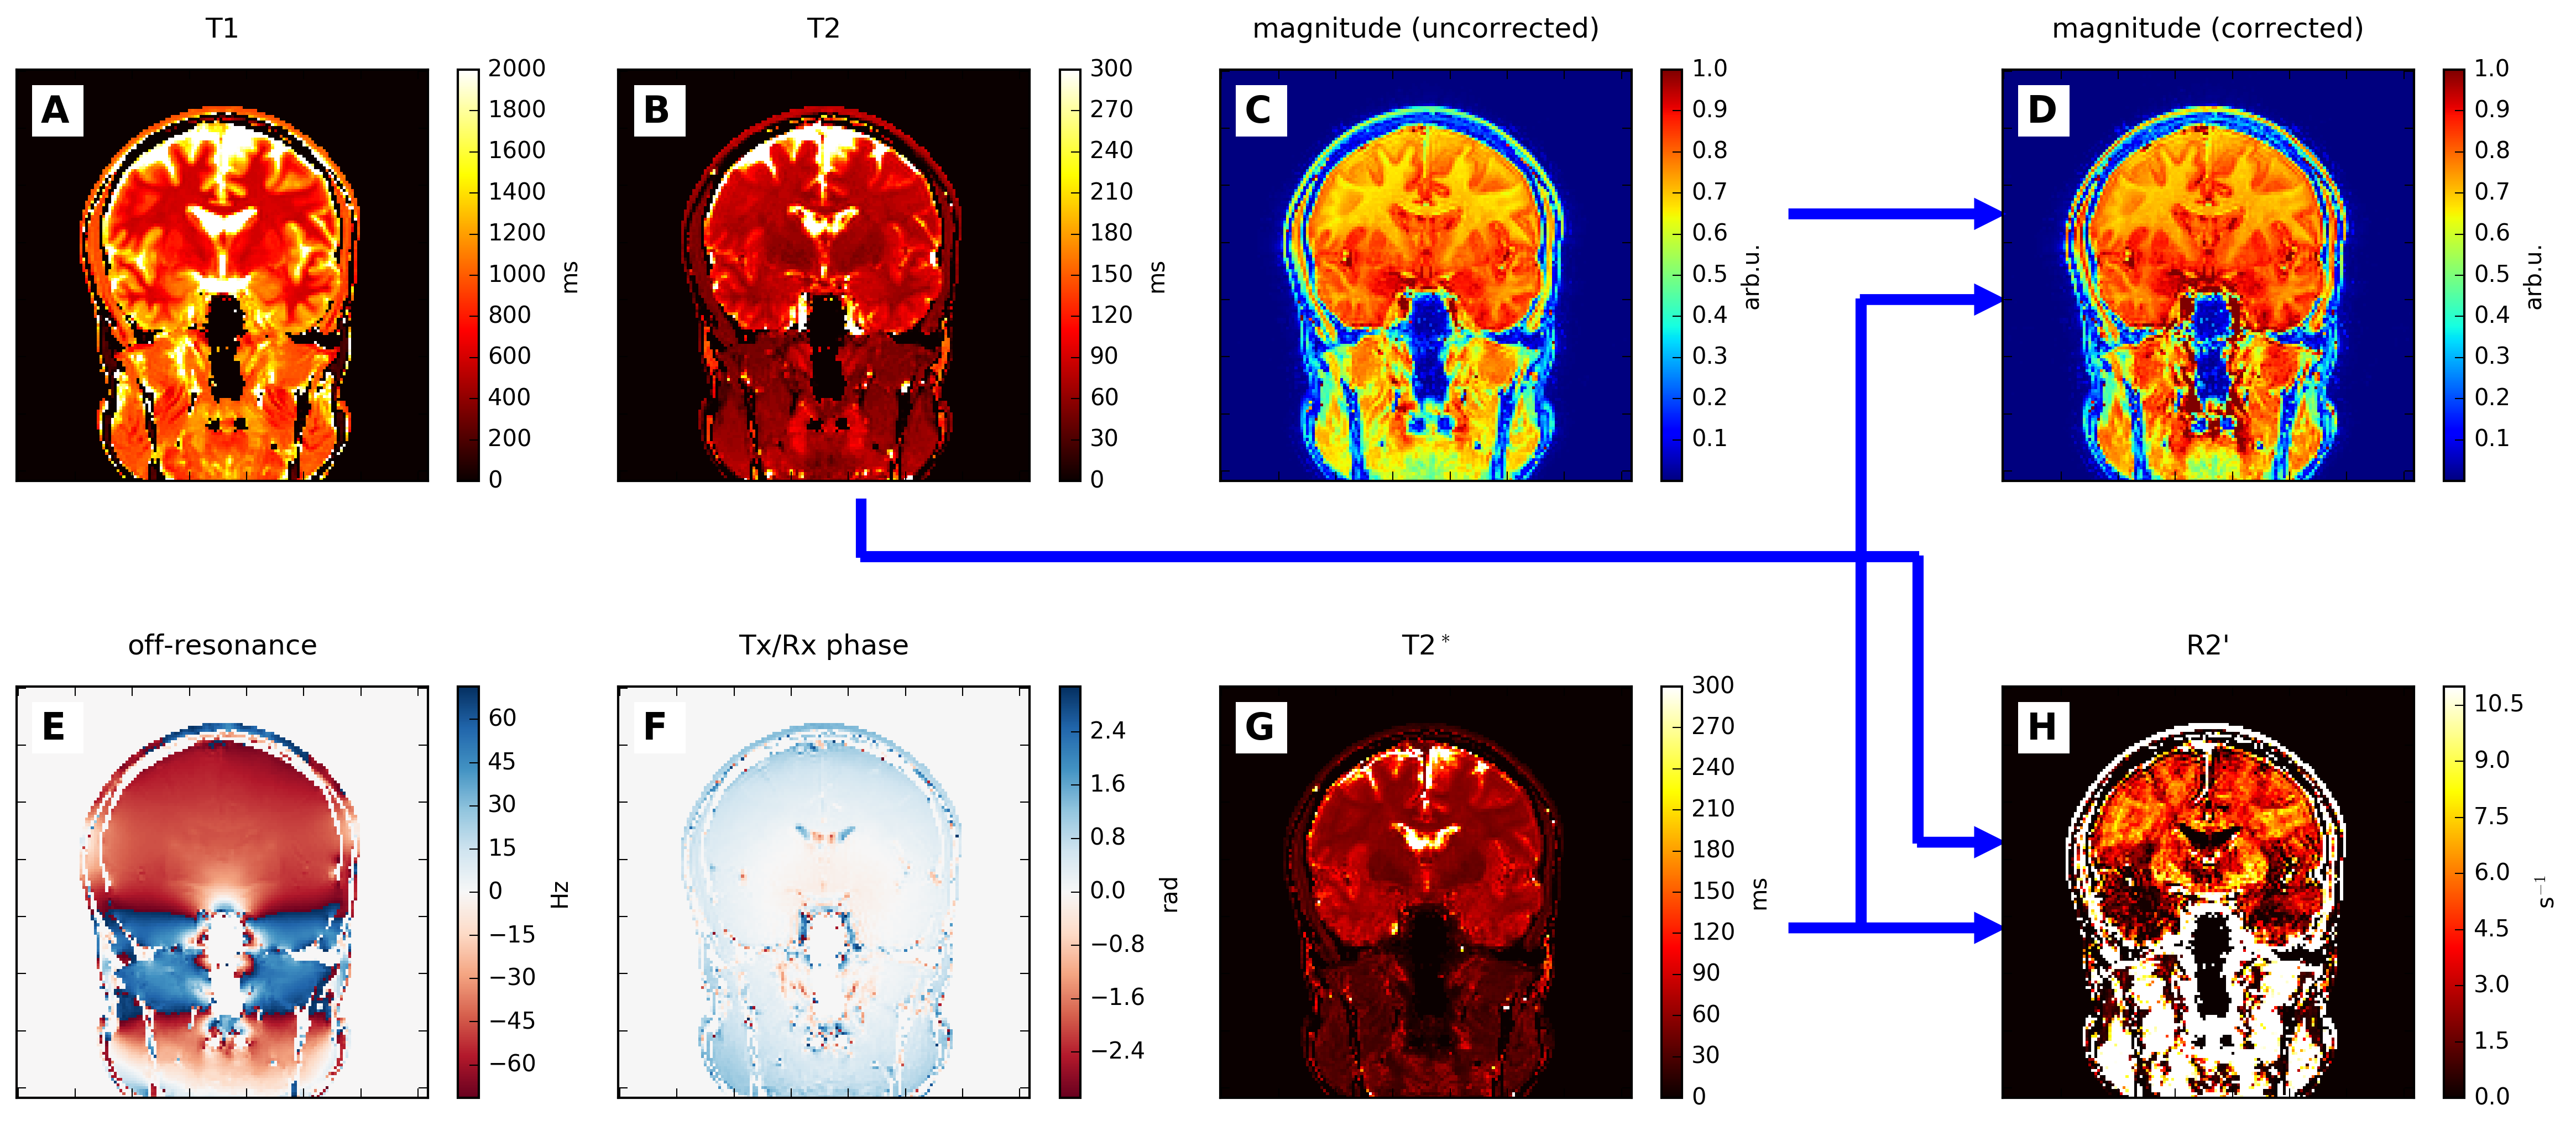
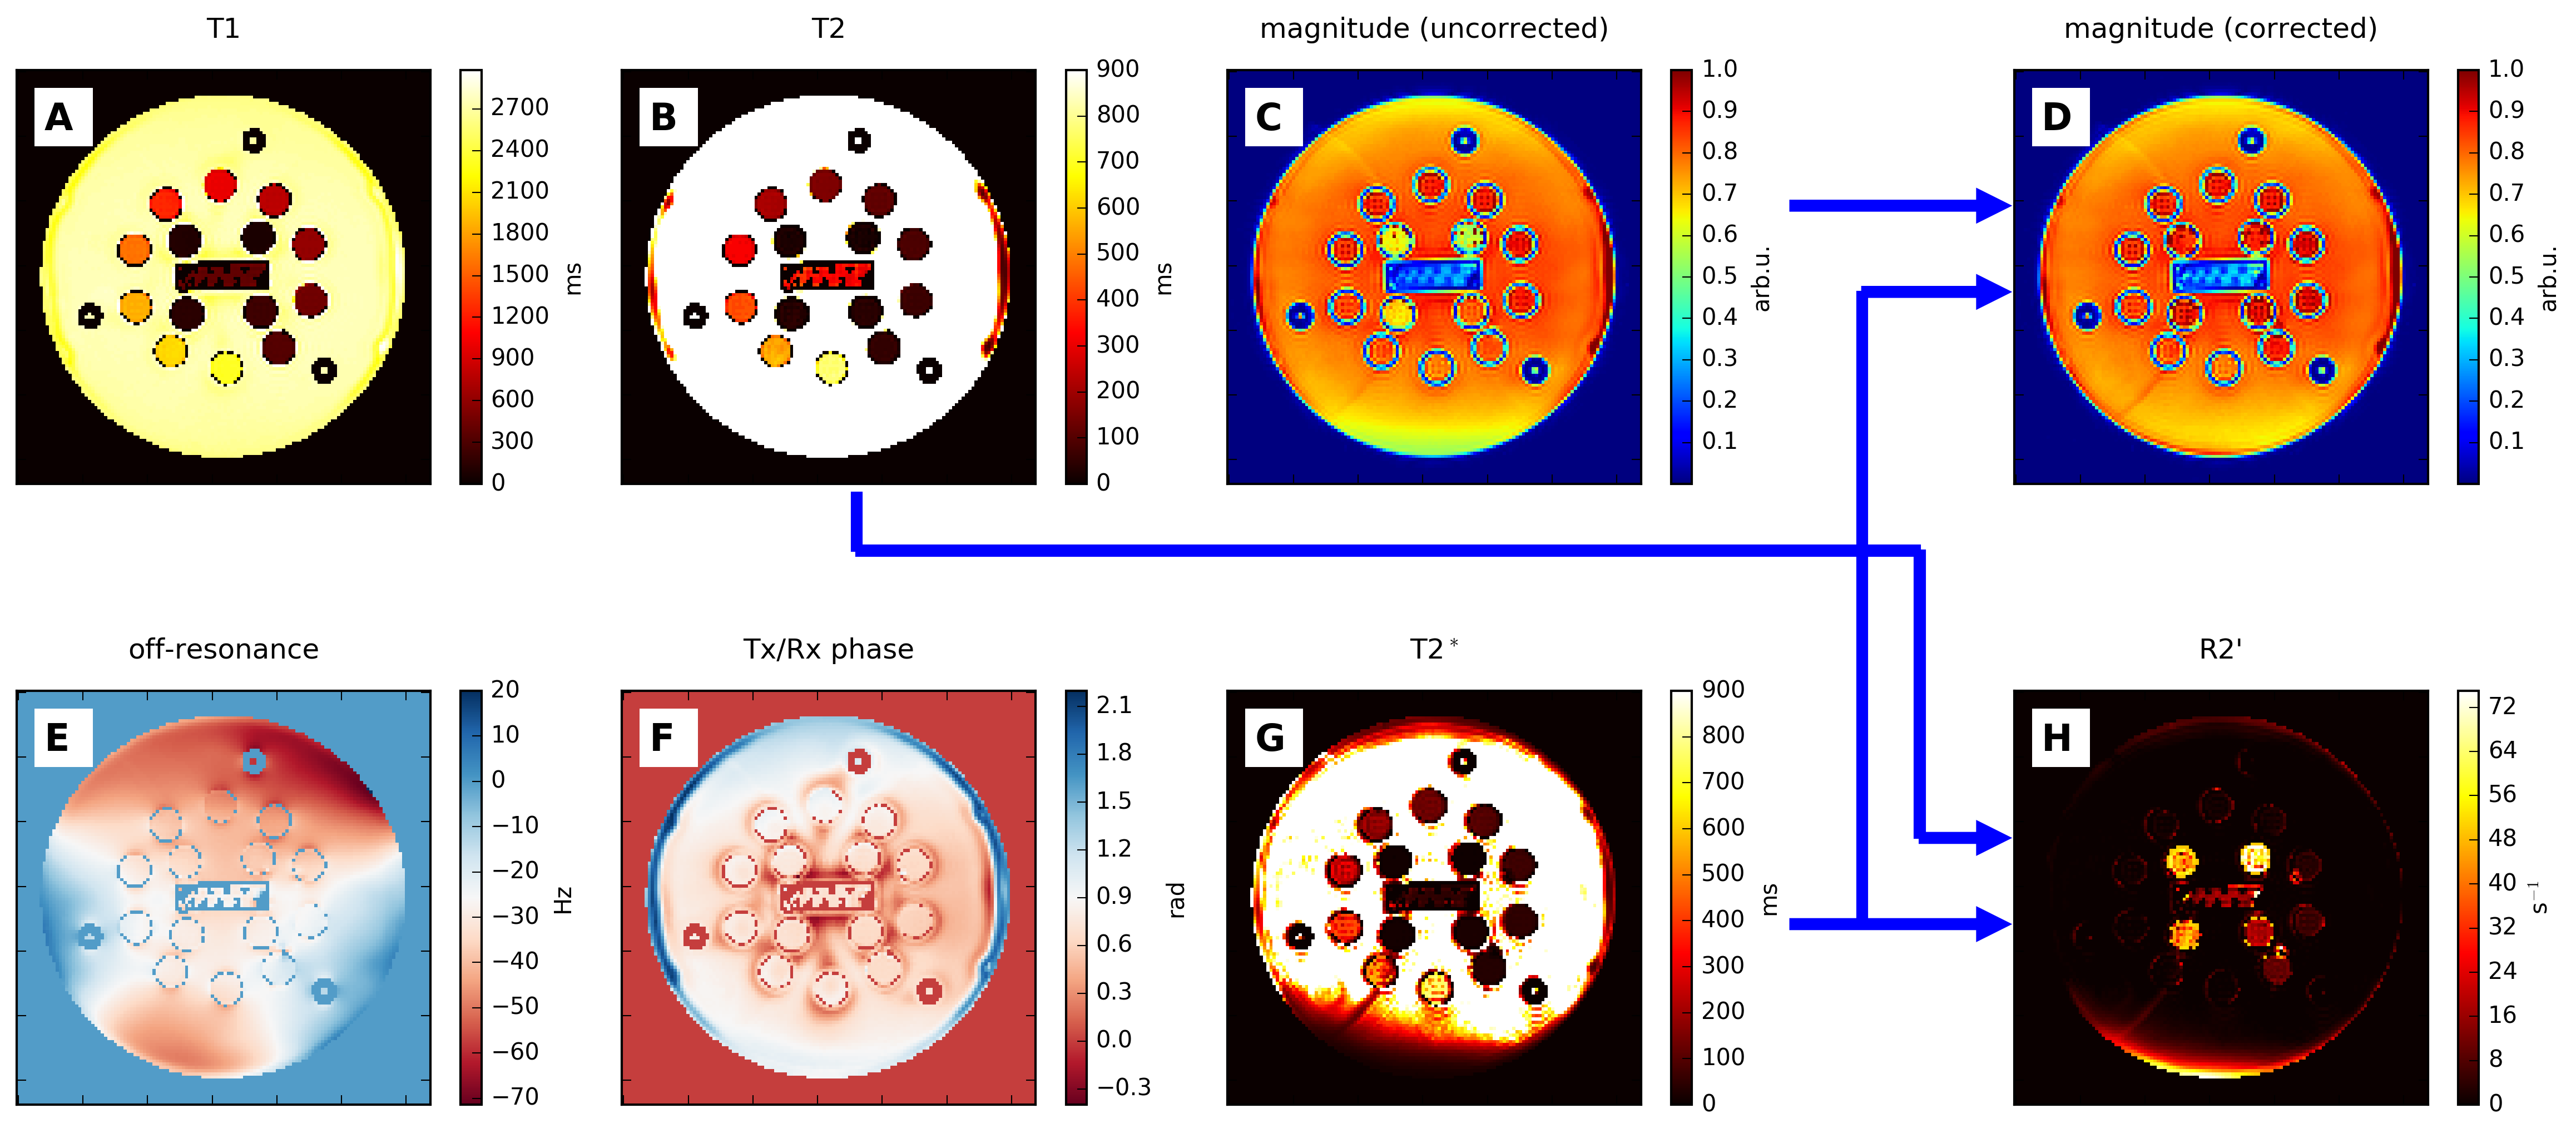
The resulting parameter maps of an in-vivo and a phantom measurement are shown in Figures 3 and 4, respectively. T1, T2, and (uncorrected) magnitude maps (A-C) were determined by dictionary matching, while off-resonance, $$$T_2^*$$$, and TxRx phase maps (E-G) were calculated directly from the multi-echo MRF signals. $$$R'_2$$$ maps and $$$T_2^*$$$-corrected magnitude maps are shown in subfigures D and H. (False color magnitude maps have been chosen to visualize subtle changes, although brightness is not correctly represented.) The in-vivo $$$R'_2$$$ map shows increased values in the globus pallidus and putamen. This has been attributed to a higher iron content3, which will need to be confirmed by further studies. The correction of the magnitude map is apparent in the phantom measurement, where the inner four probes (lowest T2) show lower magnitude in the uncorrected map, while all probes have similar magnitude in the corrected map. Uniformity of M0 is improved in regions of large B0 gradients (see lower part of phantom).
In a future implementation, even the MRF dictionary matching could be improved by averaging the results of separate matches for each of the echoes.
Conclusion
The described technique extends existing MR Fingerprinting approaches by acquiring additional information without adding complexity to the dictionary and may increase the potential of MRF for diagnostic purposes.
The derived $$$R'_2$$$ map is assumed to provide information about iron content and may become important for the diagnosis of neurodegenerative diseases. The proposed corrections of the magnitude map are especially relevant when T2 is small and B0 inhomogeneities are large and should lead to better estimates of the proton density.
Acknowledgements
References
1. Ma D, Gulani, V, Seiberlich, N et al. Nature, 2013;495:187-193.
2. Jiang Y, Ma D, Seiberlich N, Gulani V, Griswold M. Magn Reson Med 2014;74:1621-1632.
3. Haacke, EM et al., Imaging iron stores in the brain using magnetic resonance imaging, Magnetic Resonance Imaging 2005;23:1-25
Figures