0031
Non-ECG, free-breathing myocardial T1-T2 mapping of acute myocardial infarction using low-rank tensor MR multitasking1Biomedical Imaging Research Institute, Cedars-Sinai Medical Center, Los Angeles, CA, United States, 2Department of Bioengineering, University of California, Los Angeles, Los Angeles, CA, United States, 3Department of Radiology, Xuanwu Hospital, Beijing, China
Synopsis
Myocardial tissue characterization by T1-T2 mapping is promising for diagnosing myocardial infarction, ischemia, and more. This is typically performed using ECG triggering and breath-holding, which is uncomfortable and unreliable in patients. This work describes a novel method for non-ECG free-breathing joint T1-T2 mapping using cardiovascular MR multitasking, modeling the underlying 6D multidimensional image—which has 2 spatial dimensions + 4 time dimensions (cardiac, respiratory, T1, and T2)—as a low-rank tensor. T1 and T2 measurements in acute myocardial infarction patients agreed with reference methods and predicted late gadolinium enhancement with 100% sensitivity and 92% specificity.
Introduction
Myocardial tissue characterization by T1-T2 mapping is promising for diagnosing myocardial infarction, ischemia, edema, and more1. Myocardial T1 and T2 maps are typically acquired using ECG-triggering and breath-holding to freeze cardiac and respiratory motion. Unfortunately, this is often uncomfortable or difficult for patients, and can result in motion artifacts from mistriggering and/or failed breath-holds. In addition, T1 and T2 are usually mapped in separate scans during different breath-holds, commonly resulting in misregistration. Here we describe a novel method for non-ECG, free-breathing joint T1-T2 mapping using cardiovascular MR multitasking2. This method employs low-rank tensor (LRT) imaging to produce a multidimensional image with four time dimensions, representing cardiac motion, respiratory motion, T1 recovery, and T2 decay. We evaluate the ability of T1-T2 multitasking to predict late gadolinium enhancement (LGE) in patients with acute myocardial infarction (AMI).Methods
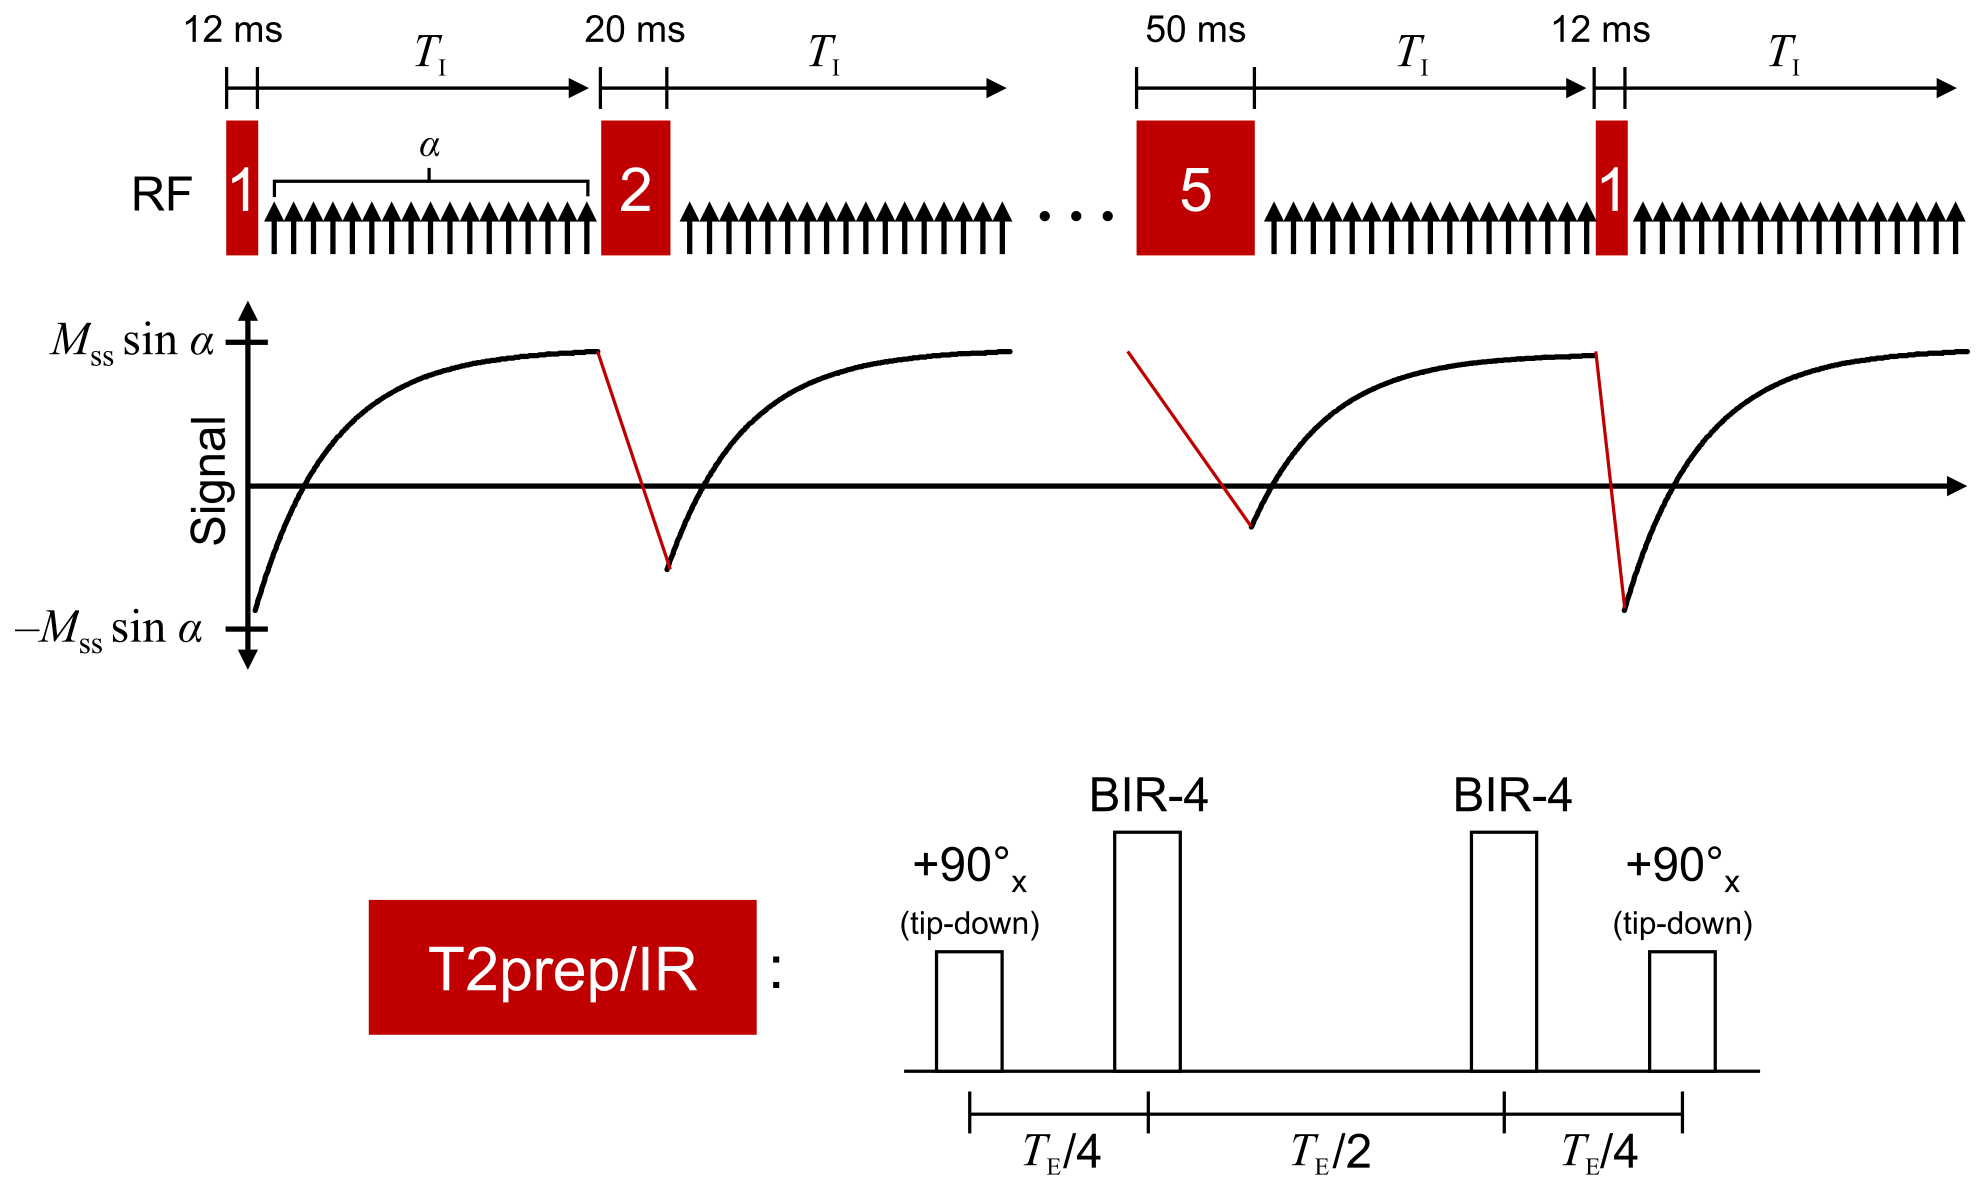
T1-T2 weighting was generated using T2prep/IR preparation. T1 recovery between prep pulses was sampled using FLASH readouts (flip angle=5°, TR/TE=3.6/1.6 ms) throughout the 2.5-sec recovery period. T2prep duration was cycled through 12, 20, 30, 40, and 50 ms to provide multiple T2 weightings (Fig. 1). Sampling was performed by interleaving golden-angle radial data (imaging data $$$\mathcal{D}_\mathrm{img}$$$) and the 0° spoke (LRT subspace training data $$$\mathcal{D}_\mathrm{tr}$$$) every other readout.
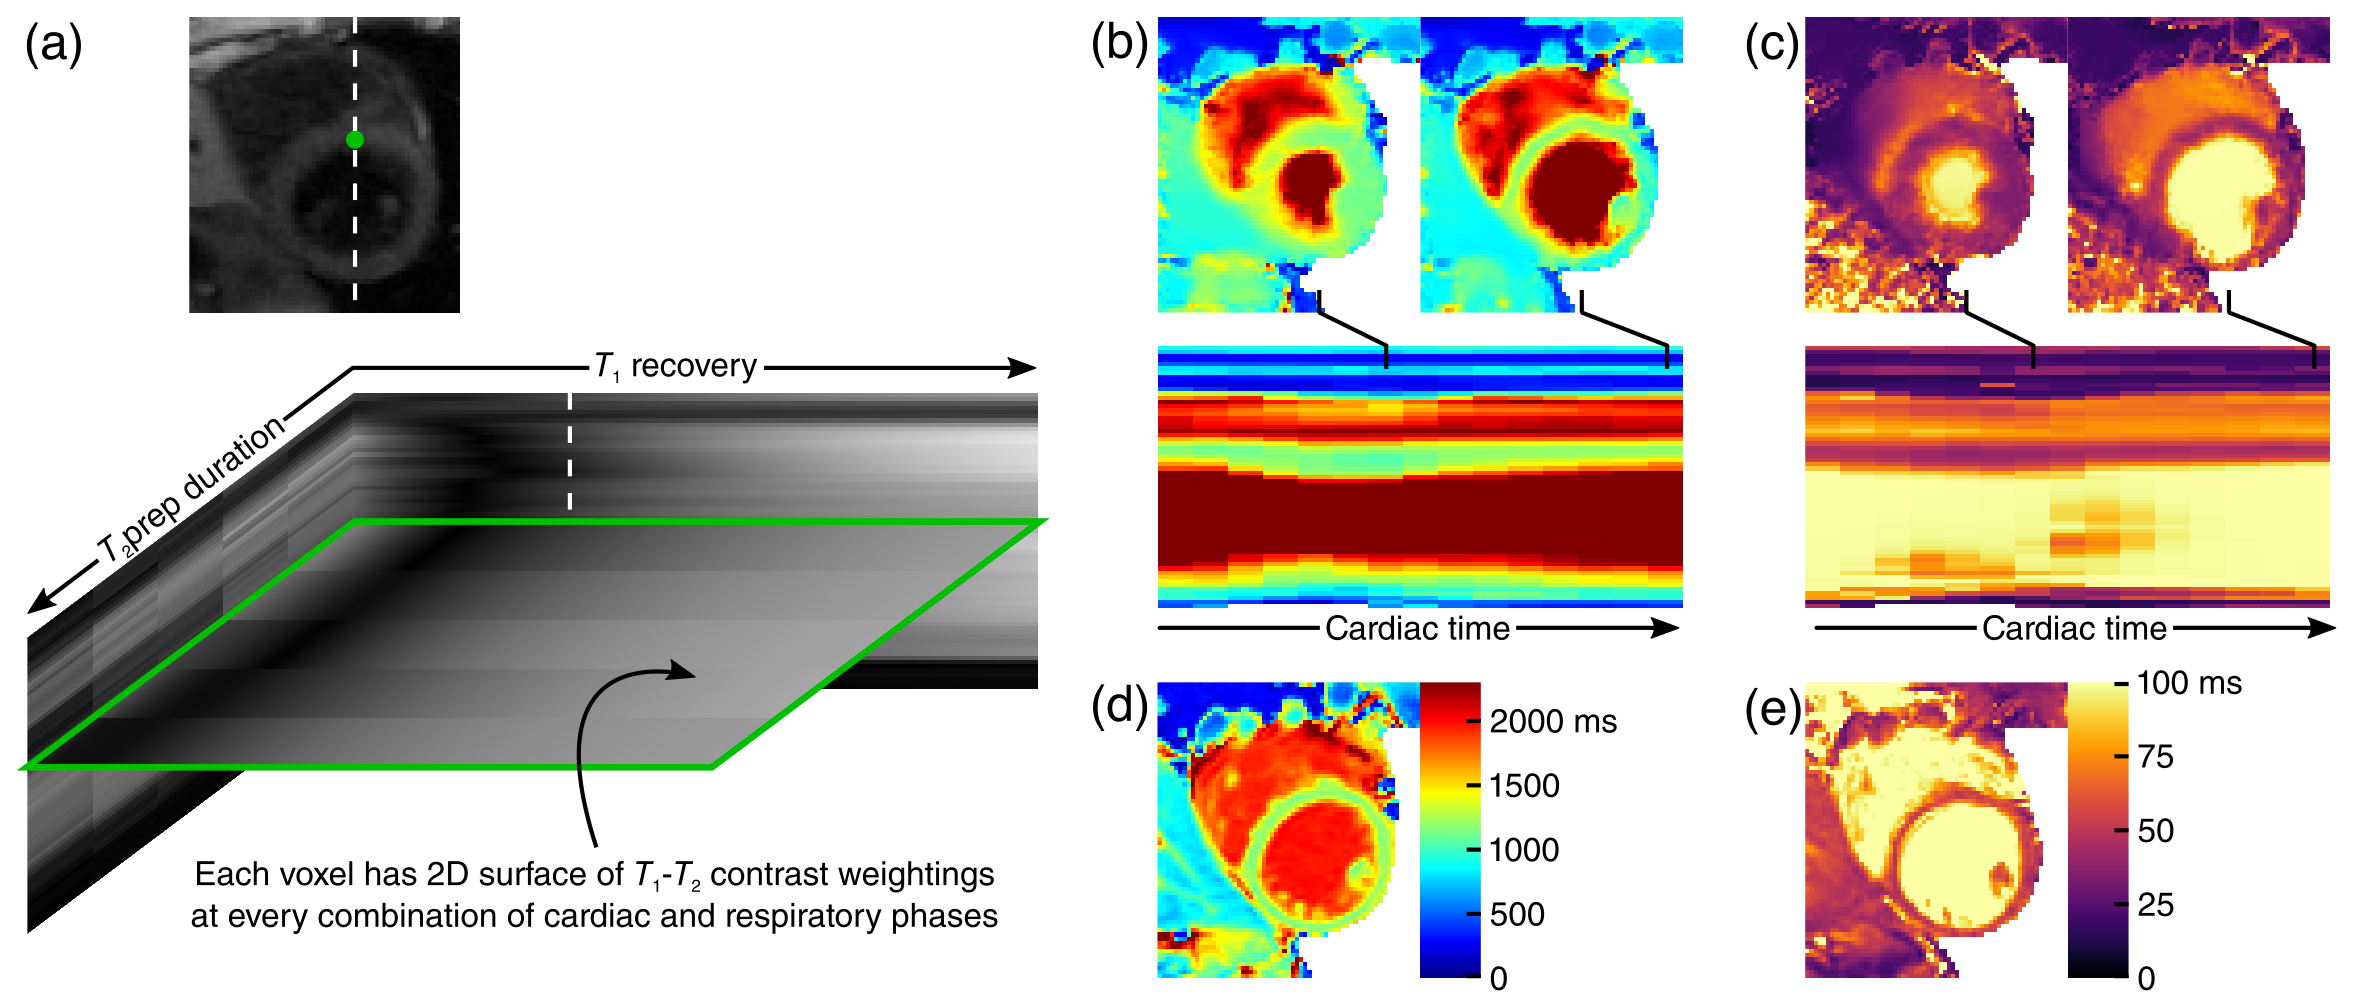
$$$\quad$$$We represent the underlying multidimensional cardiovascular image as a 5-way tensor $$$\mathcal{A}$$$, with dimensions indexing voxel location $$$\mathbf{x}$$$, cardiac phase $$$t_\mathrm{c}$$$, respiratory position $$$t_\mathrm{r}$$$, time since preparation $$$t_\mathrm{T1}$$$ (representing T1 recovery), and T2prep duration $$$t_\mathrm{T2}$$$ (representing T2 decay). Spatiotemporal image correlation makes this tensor low-rank3. In Tucker form, this is expressed as:$$\mathcal{A=G}\times_1\mathbf{U_x}\times_2\mathbf{U}_\mathrm{c}\times_3\mathbf{U}_\mathrm{r}\times_4\mathbf{U}_\mathrm{T1}\times_5\mathbf{U}_\mathrm{T2},$$where $$$\mathcal{G}$$$ is the core tensor, and each factor matrix $$$\mathbf{U}$$$ contains basis functions describing each dimension. We recover $$$\mathcal{A}$$$ by learning $$$\mathcal{G}$$$ and the temporal factor matrices from $$$\mathcal{D}_\mathrm{tr}$$$, followed by recovery of $$$\mathbf{U_x}$$$ from $$$\mathcal{D}_\mathrm{img}$$$ using the other known factors.
$$$\quad$$$Although the training data in $$$\mathcal{D}_\mathrm{tr}$$$ are frequently collected, they do not fully cover $$$(t_\mathrm{c},t_\mathrm{r},t_\mathrm{T1},t_\mathrm{T2})$$$-space. Therefore, before extracting $$$\mathcal{G}$$$ and the temporal factor matrices, we complete $$$\mathcal{D}_\mathrm{tr}$$$ according to:$$\hat{\mathcal{D}}_\mathrm{tr}=\arg\min_{\mathcal{D}_\mathrm{tr}\in\Psi}\|\mathbf{d}_\mathrm{tr}-\Omega_\mathrm{tr}(\mathcal{D}_\mathrm{tr})\|_2^2+\lambda\|\mathbf{D}_{\mathrm{tr},(n)}\|_*+R(\mathcal{D}_\mathrm{tr}),$$where $$$\Psi$$$ is a subspace estimated from the SVD of a dictionary of T1 recovery curves2, where $$$\Omega_\mathrm{tr}$$$ returns the vector of sampled training data $$$mathbf{d}_\mathrm{tr}$$$, and where subscript $$$(n)$$$ denotes mode-$$$n$$$ unfolding of the tensor. $$$R(\cdot)$$$ is a regularization functional, which for this work was chosen as the temporal total variation (TV) along $$$t_\mathrm{c}$$$ and $$$t_\mathrm{r}$$$.4 $$$\mathcal{G}$$$ and the temporal factor matrices are then extracted from the high-order SVD of $$$\hat{\mathcal{D}}_\mathrm{tr}$$$.
$$$\quad$$$We then recover $$$\mathbf{U_x}$$$ according to:$$\mathbf{\hat{U}_x}=\arg\min_\mathbf{U_x}\|\mathbf{d}_\mathrm{img}-E(\mathbf{U_x\Phi})\|_2^2+R(\mathbf{U_x}),$$where $$$E(\cdot)$$$ combines spatial encoding and sampling, $$$R(\cdot)$$$ is a regularization functional (in this work, spatial TV), and where $$$\mathbf{\Phi}=\mathbf{G}_{(1)}(\mathbf{U}_\mathrm{T2}\otimes\mathbf{U}_\mathrm{T1}\otimes\mathbf{U}_\mathrm{r}\otimes\mathbf{U}_\mathrm{c})^T$$$.
$$$\quad$$$Data were collected on a 3T Siemens Verio from n=5 patients with AMI. Each subject underwent: 1) native T1 mapping using MOLLI 5(3)36; 2) native T2 mapping using T2prep-SSFP mapping7; 3) native T1-T2 mapping using multitasking; and 4) LGE imaging. MOLLI, T2prep-SSFP, and LGE images were collected at diastole during an end-inspiration breath-hold. CMR multitasking images were continuously acquired without ECG triggering or breath-holding over the course of 85 sec, resulting in 6D cardiac- and respiratory-resolved images (16 cardiac bins, 5 respiratory bins, 344 inversion times, 5 T2prep durations); T1 and T2 values were fit at end-diastole and end-inspiration to match the reference method motion states. Segmentwise analysis was performed in six myocardial segments per subject.
Results
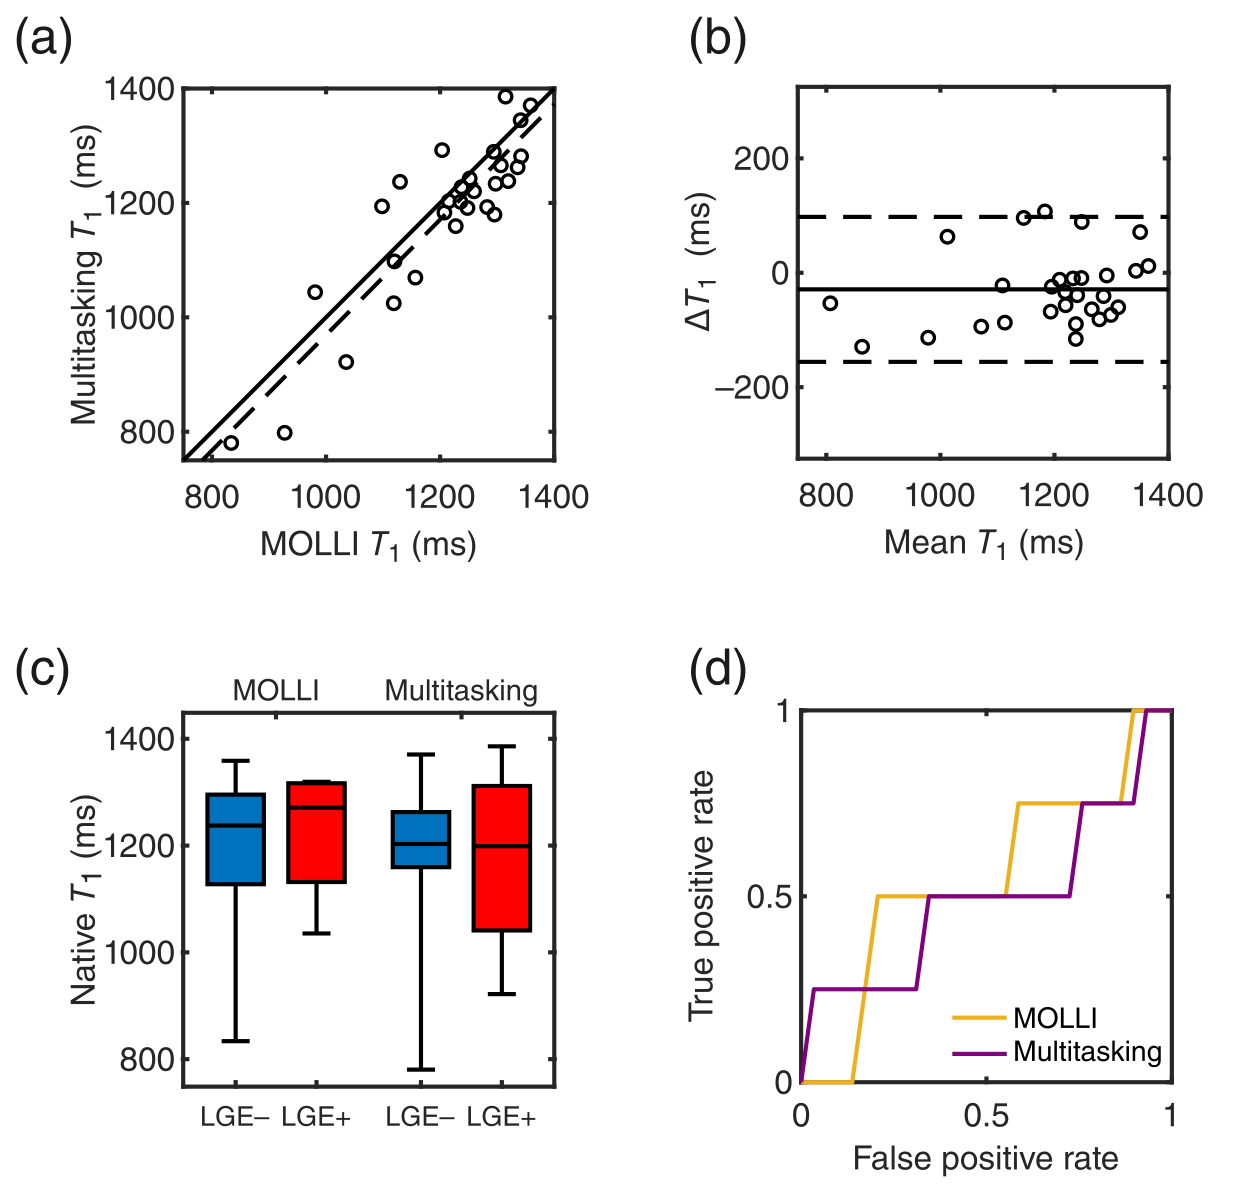
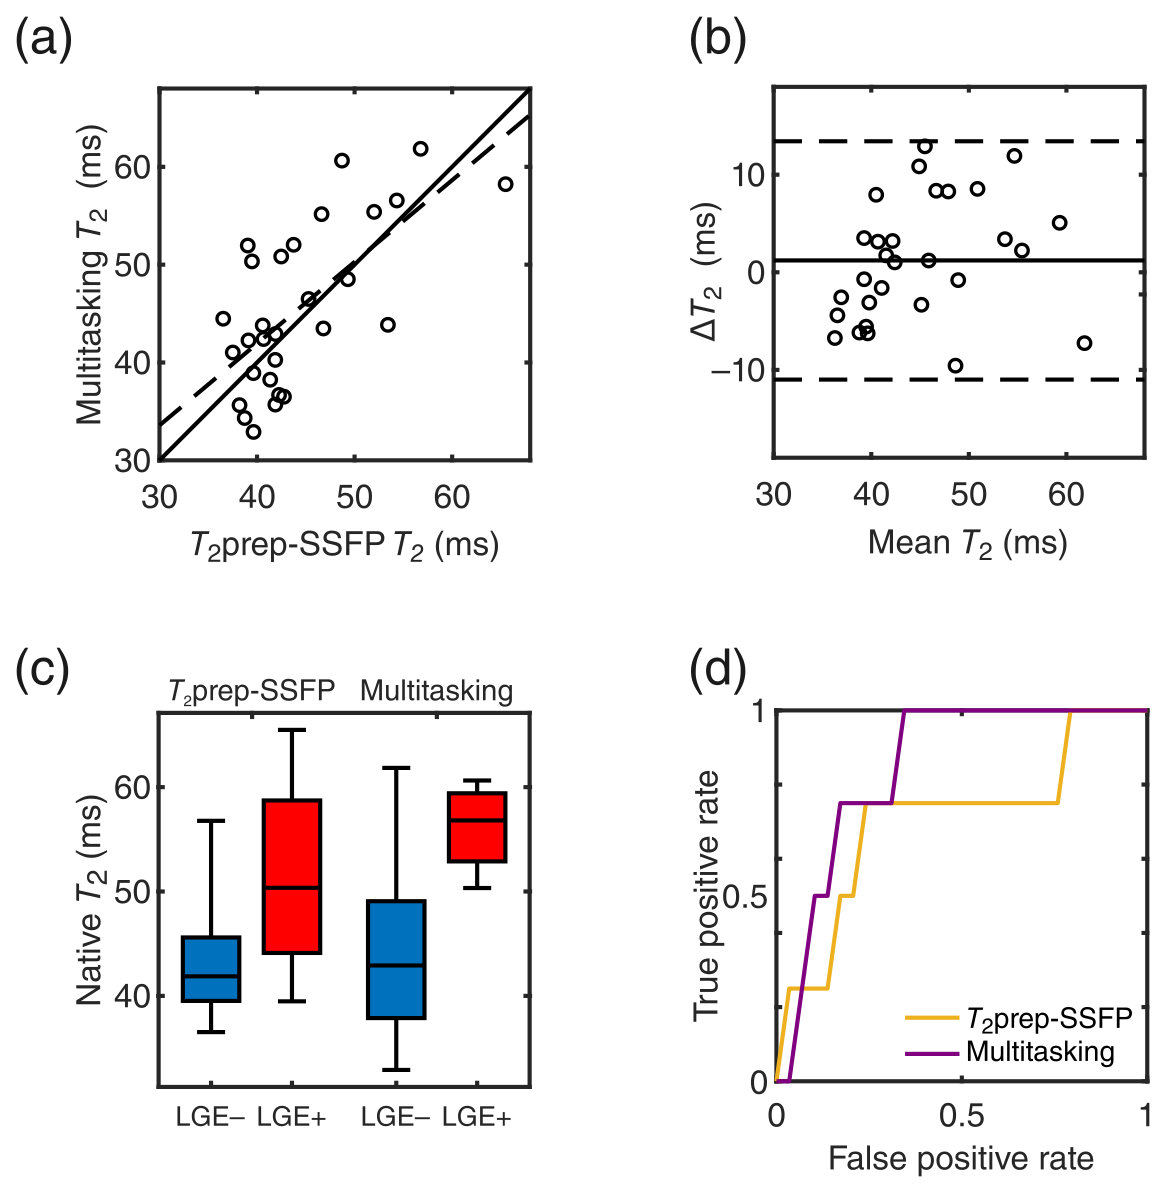
Representative mapping results are in Fig. 2. Comparison of multitasking T1 and T2 values (T1: 1177±147 ms; T2: 45.6±8.3 ms) to MOLLI (T1: 1206±31 ms) and T2prep-bSSFP mapping (T2: 44.3±6.7 ms) were positively correlated (T1: r=0.90, T2: r=0.68) (Figs. 3a,4a). Multitasking T1 showed a –29 ms bias (p=0.02) vs. MOLLI; T2 had no statistically significant bias (p=0.30) (Figs. 3b,4b).
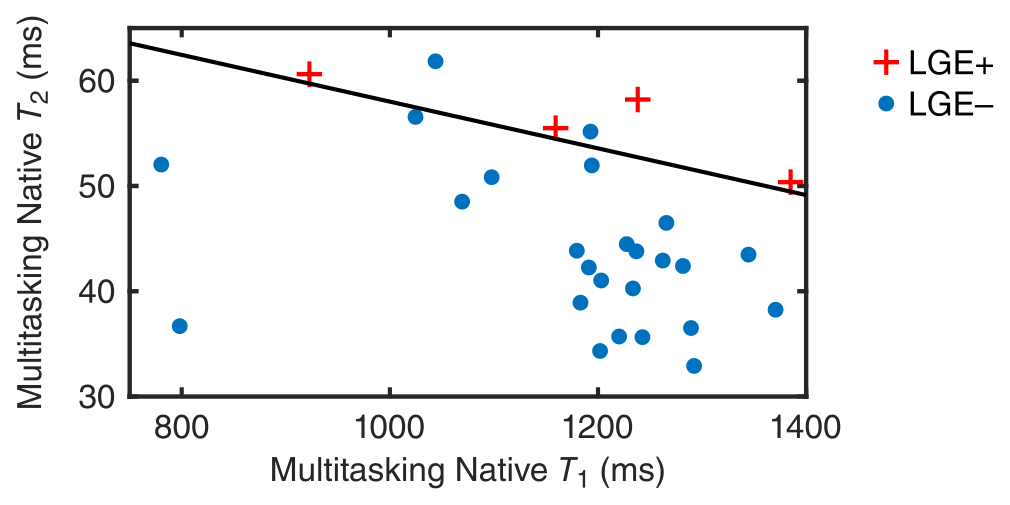
$$$\quad$$$Neither T1 mapping method on its own was predictive of LGE status, with the area under the curve (AUC) of the receiver operating characteristic (ROC) curve = 0.55 for MOLLI and 0.50 for multitasking (Fig. 3c,d); both T2 mapping methods were predictive of LGE status, with the ROC AUC = 0.71 for T2prep-bSSFP mapping and 0.84 for multitasking (Fig. 4c,d). A 2D feature space of multitasking T1 and T2 values (Fig. 5) provided even greater diagnostic accuracy, with the pictured decision boundary yielding 100% sensitivity and 92% specificity.
Discussion and Conclusion
Multitasking T1 and T2 maps showed similar diagnostic accuracy to the reference methods, with native T2 mapping being more predictive of LGE status than native T1. This may be due to the substantially larger fractional increase in T2 than T1 from edema associated with AMI8, 9. The use of both T1 and T2 from the same multitasking scan further increased diagnostic accuracy, demonstrating the value of obtaining multiple measurements. These initial results show great promise for non-ECG, free-breathing multiparameter mapping using low-rank tensor MR multitasking.Acknowledgements
This work was supported by NIH 1R01HL124649.References
- Blume U, Lockie T, Stehning C, Sinclair S, Uribe S, Razavi R, Schaeffter T. Interleaved T1 and T2 relaxation time mapping for cardiac applications. J Magn Reson Imaging. 2009;29(2):480-7.
- Christodoulou AG, Shaw JL, Sharif B, Li D, A general low-rank tensor framework for high-dimensional cardiac imaging: Application to time-resolved T1 mapping. Proc Int Soc Magn Reson Med 2016; 867.
- Liang Z-P, Spatiotemporal imaging with partially separable functions. Proc IEEE Int Symp Biomed Imaging. 2007 12-15 April 2007; Arlington, VA2007; 988-91.
- Feng L, Axel L, Chandarana H, Block KT, Sodickson DK, Otazo R. XD-GRASP: Golden-angle radial MRI with reconstruction of extra motion-state dimensions using compressed sensing. Magn Reson Med. 2016;75(2):775-88.
- De Lathauwer L, De Moor B, Vandewalle J. A multilinear singular value decomposition. SIAM J Matrix Anal Appl. 2000;21(4):1253-78.
- Xue H, Greiser A, Zuehlsdorff S, Jolly M-P, Guehring J, Arai AE, Kellman P. Phase-sensitive inversion recovery for myocardial T1 mapping with motion correction and parametric fitting. Magn Reson Med. 2013;69(5):1408-20.
- Giri S, Chung Y-C, Merchant A, Mihai G, Rajagopalan S, Raman SV, Simonetti OP. T2 quantification for improved detection of myocardial edema. J Cardiovasc Magn Reson. 2009;11(1):56.
- Ferreira VM, Piechnik SK, Robson MD, Neubauer S, Karamitsos TD. Myocardial tissue characterization by magnetic resonance imaging: Novel applications of T1 and T2 mapping. J Thorac Imaging. 2014;29(3):147.
- Higgins CB, Herfkens R, Lipton MJ, Sievers R, Sheldon P, Kaufman L, Crooks LE. Nuclear magnetic resonance imaging of acute myocardial infarction in dogs: alterations in magnetic relaxation times. Am J Cardiol. 1983;52(1):184-8.
Figures