0013
Alterations of Cardiac 4D Hemodynamics and Blood Energetics in Hypertrophic Cardiomyopathy1Department of Radiology, Feinberg School of Medicine, Northwestern University, Chicago, IL, United States, 2Department of Biomedical Engineering, McCormick School of Engineering, Northwestern University, Chicago, IL, United States, 3Department of Medicine, Feinberg School of Medicine, Northwestern University, Chicago, IL, United States
Synopsis
4D flow MRI supports the development of novel energetic biomarkers in hypertrophic cardiomyopathy (HCM) – a disease marked by dynamic left ventricular outflow tract obstruction with mitral regurgitation (MR). We compared kinetic energy and velocity metrics between obstructive and non-obstructive HCM subtypes to determine where in the left heart high kinetic energy and flows were generated. Left atrium showed significantly higher systolic kinetic energy and velocities throughout ventricular systole due to MR. Including these energetic parameters may be useful to detect significant MR that is underestimated by echo, identify patients at higher risk of atrial fibrillation, and inform treatment options.
Introduction
Hypertrophic cardiomyopathy (HCM) has a prevalence of 1 in 500 (0.2%) and is an important cause of arrhythmic sudden cardiac death, heart failure, and stroke.1 HCM is a disease marked by unexplained left ventricular hypertrophy.2,3 The most common phenotype, asymmetric septal, is divided into non-obstructive and obstructive subtypes. Non-obstructive HCM maintains laminar left ventricular outflow tract (LVOT) flow during systolic ejection with some flow acceleration.4 However, obstructive HCM characteristically has narrowed LVOT lumen, systolic anterior motion of the anterior mitral leaflet, and mitral regurgitation (MR), resulting in complex changes in left atrial (LA), left ventricular (LV and LVOT) hemodynamics. Current diagnostic tools are insufficient to fully characterize and quantify abnormalities associated with HCM. Cardiac 4D flow MRI allows for the measurement of time-resolved 3D cardiac blood flow with full coverage of the LA, LV and LVOT and subsequent quantification of energy biomarkers. The aim of this feasibility study was to employ 4D flow MRI for the comprehensive assessment of the effects of HCM on left-sided cardiac 4D (3D+time) hemodynamics in both non-obstructive and obstructive HCM.Methods
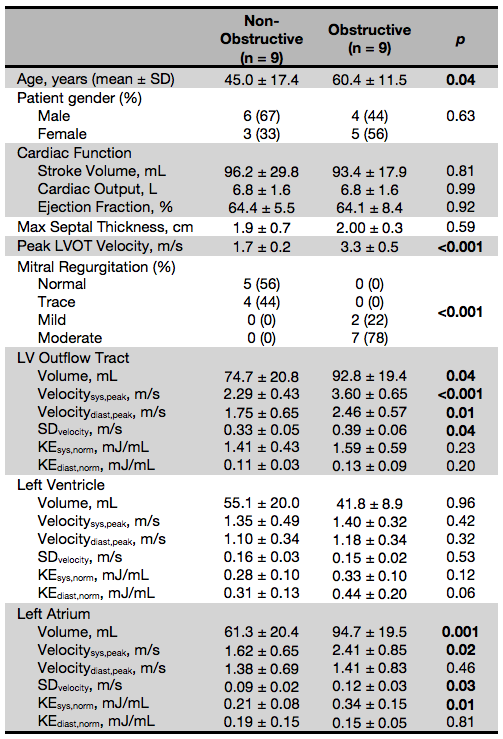
We studied a cohort of consecutively recruited patients with asymmetric septal HCM (n=18) using criteria of interventricular septum thickness of ≥1.5 cm, or ≥1.3 cm for those with familial HCM (Table 1). Patients were divided into non-obstructive HCM (n=9) and obstructive HCM (n=9) based on peak LVOT velocity <2 m/s or ≥2 m/s, respectively. Time-resolved 3D phase-contrast MRI with three-dimensional velocity encoding (4D flow MRI) captured the LVOT, LV, and LA. Data preprocessing included noise filtering and correction for Maxwell terms, eddy currents, and velocity aliasing.5 3D segmentations of the left heart were performed using commercial software (Mimics, Materialise, Belgium). Further segmentation into LVOT, LV, and LA was done by plotting velocity MIPs in systole to identify the high velocity LVOT and approximate position of the mitral valve using custom software (Matlab, MathWorks, Natick, MA). For each voxel in each chamber per time point, velocity and kinetic energy (KE) were calculated using KE=1/2mv2, where velocity (v) came from 4D flow MRI and mass (m) from multiplying voxel volume by blood density (1.05 g/mL). Energy biomarkers were derived for each chamber: peak systolic and diastolic velocity (velocitysys,peak and velocitydiast,peak), standard deviation of chamber velocities (SDvelocity), and total KE normalized to chamber volume in systole and diastole (KEsys,norm and KEdiast,norm). To compare time-resolved average velocity and total KE normalized by chamber volume (KEnorm) between patients, each patient’s velocities and KE were interpolated to the highest temporal resolution using a spline. Energy biomarkers were statistically compared using one-tailed t-tests (alpha=0.05) under the hypothesis that obstructive HCM has higher velocity and KE.Results
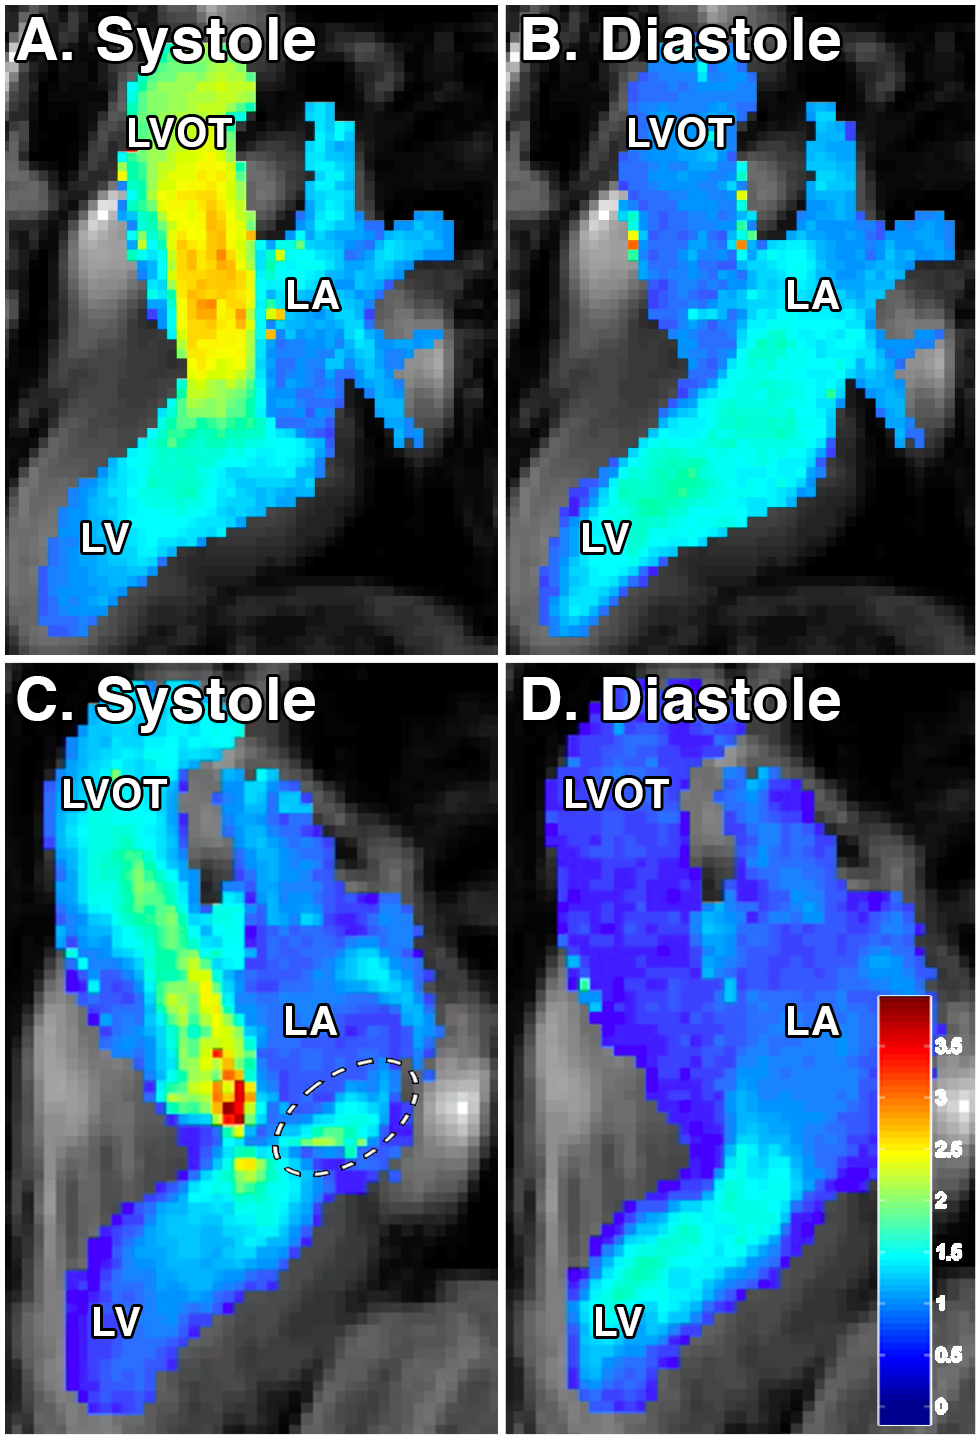
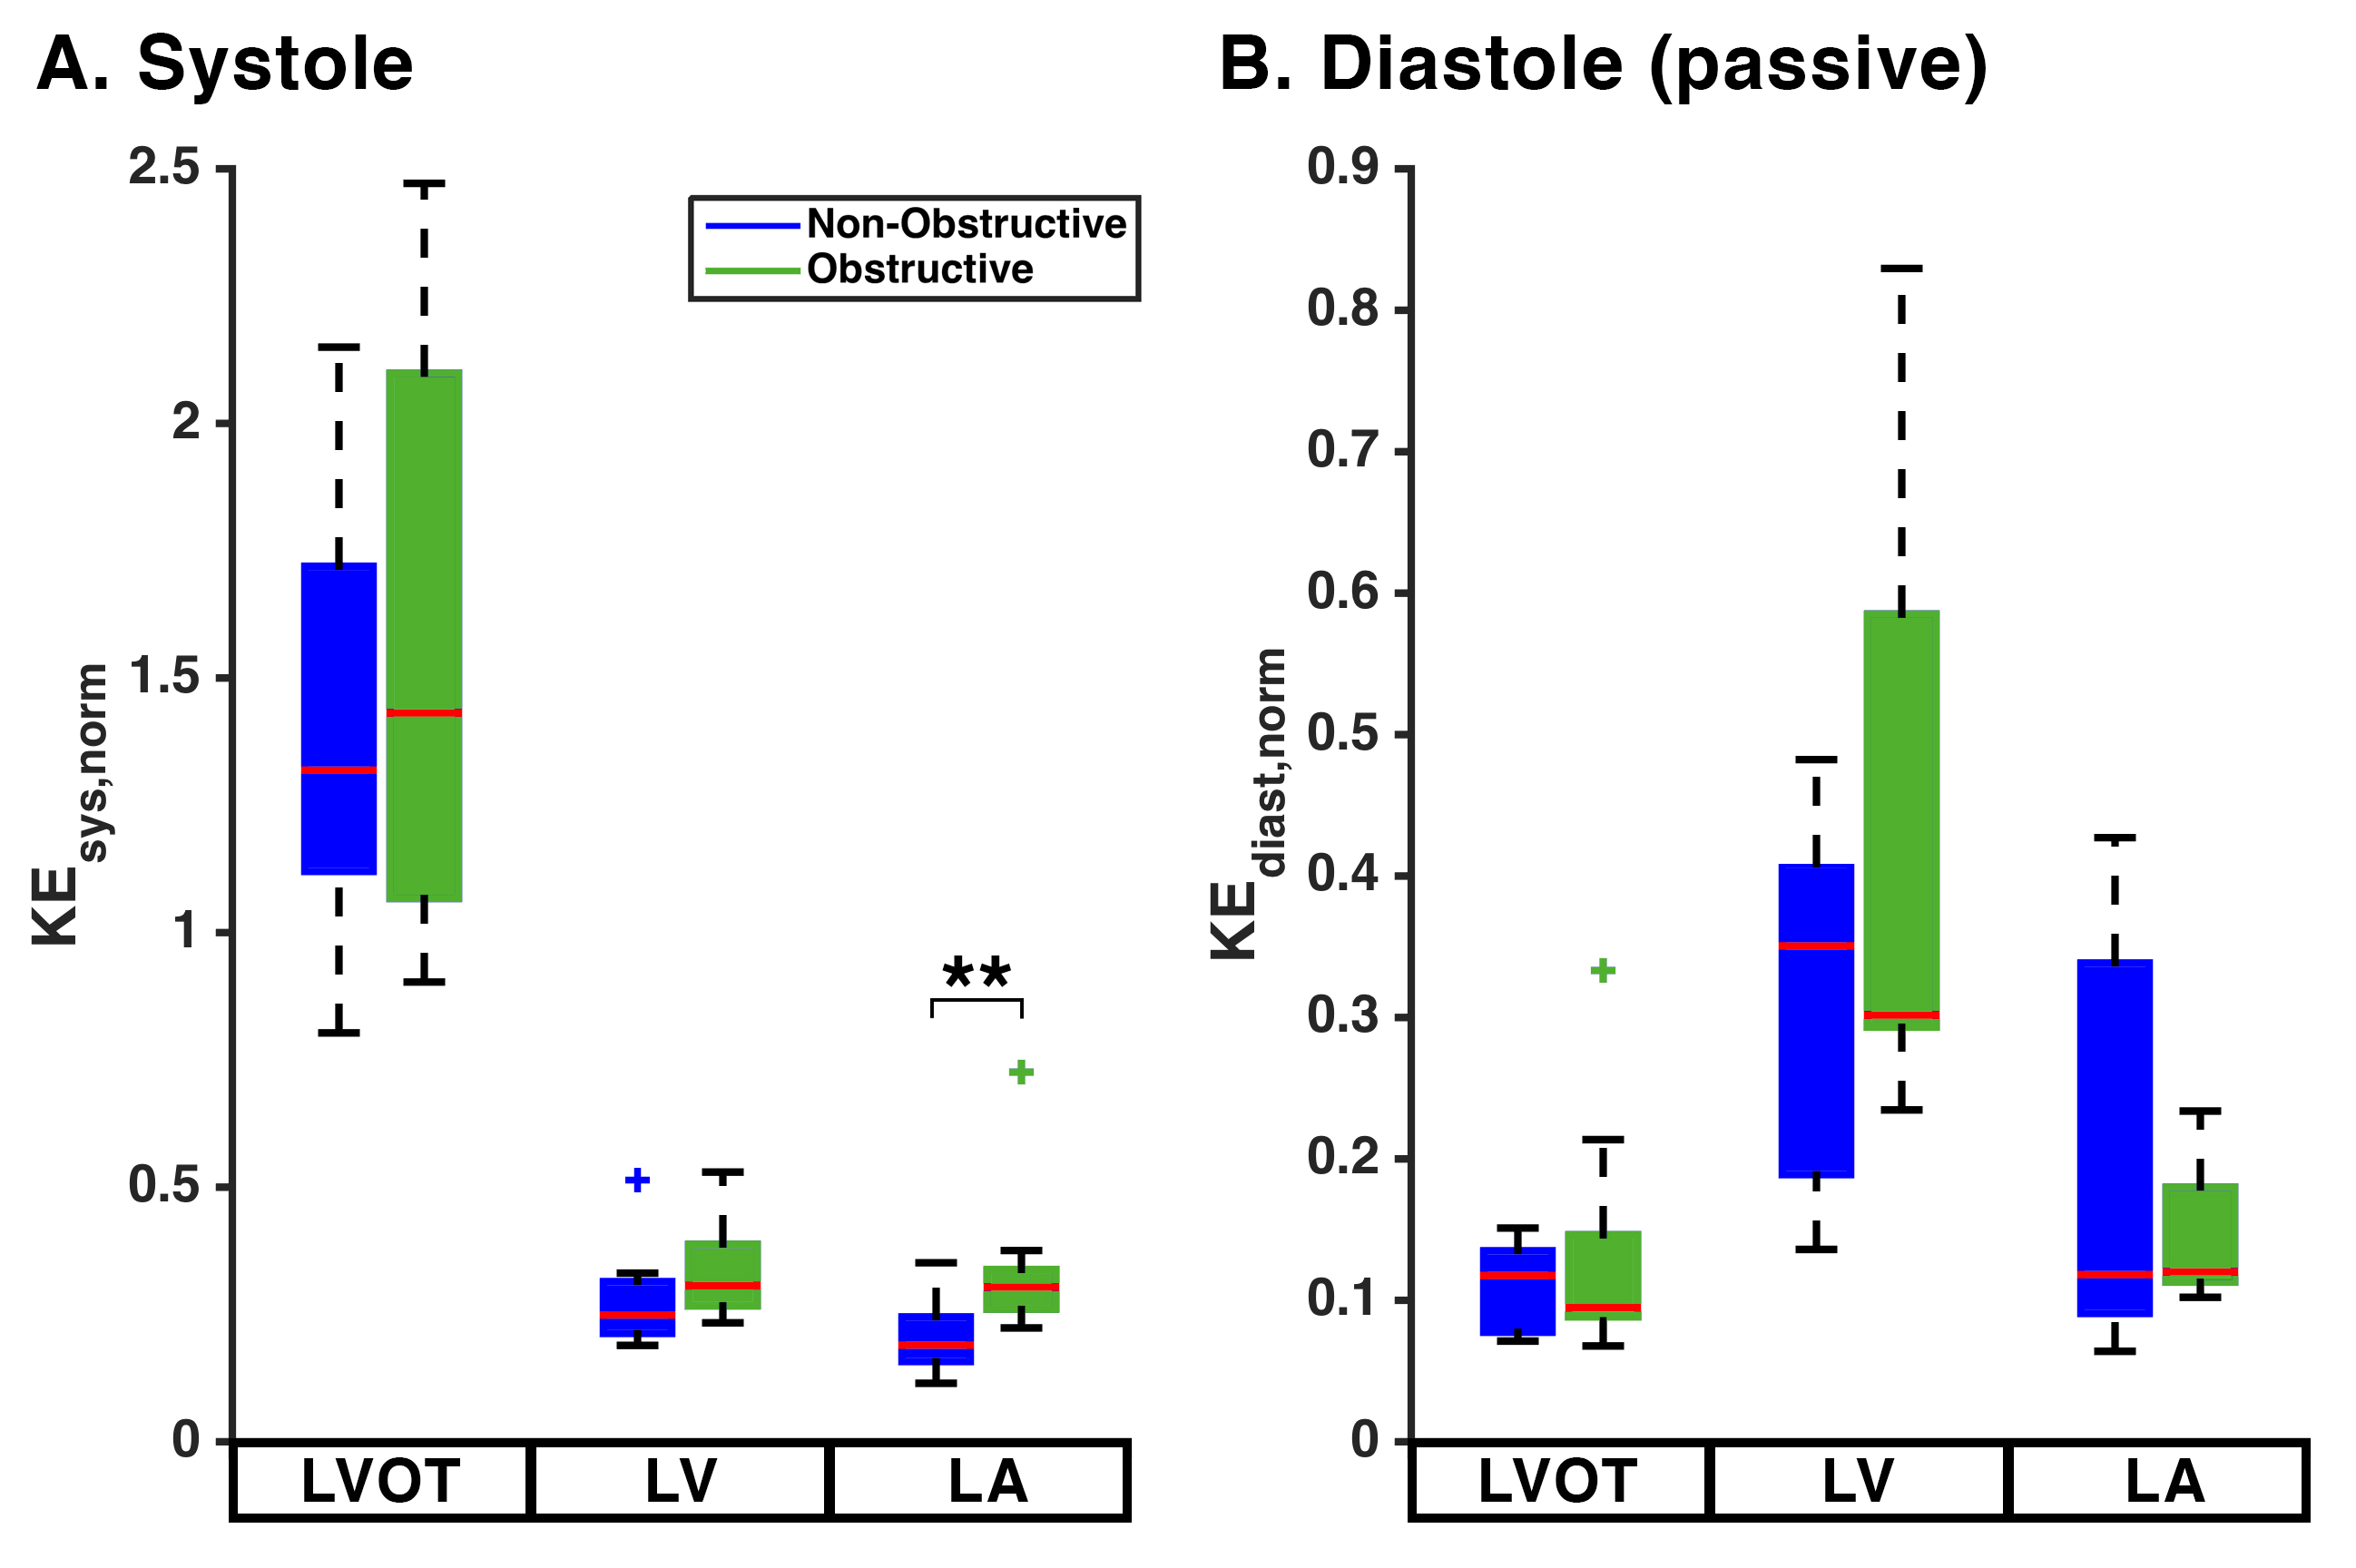
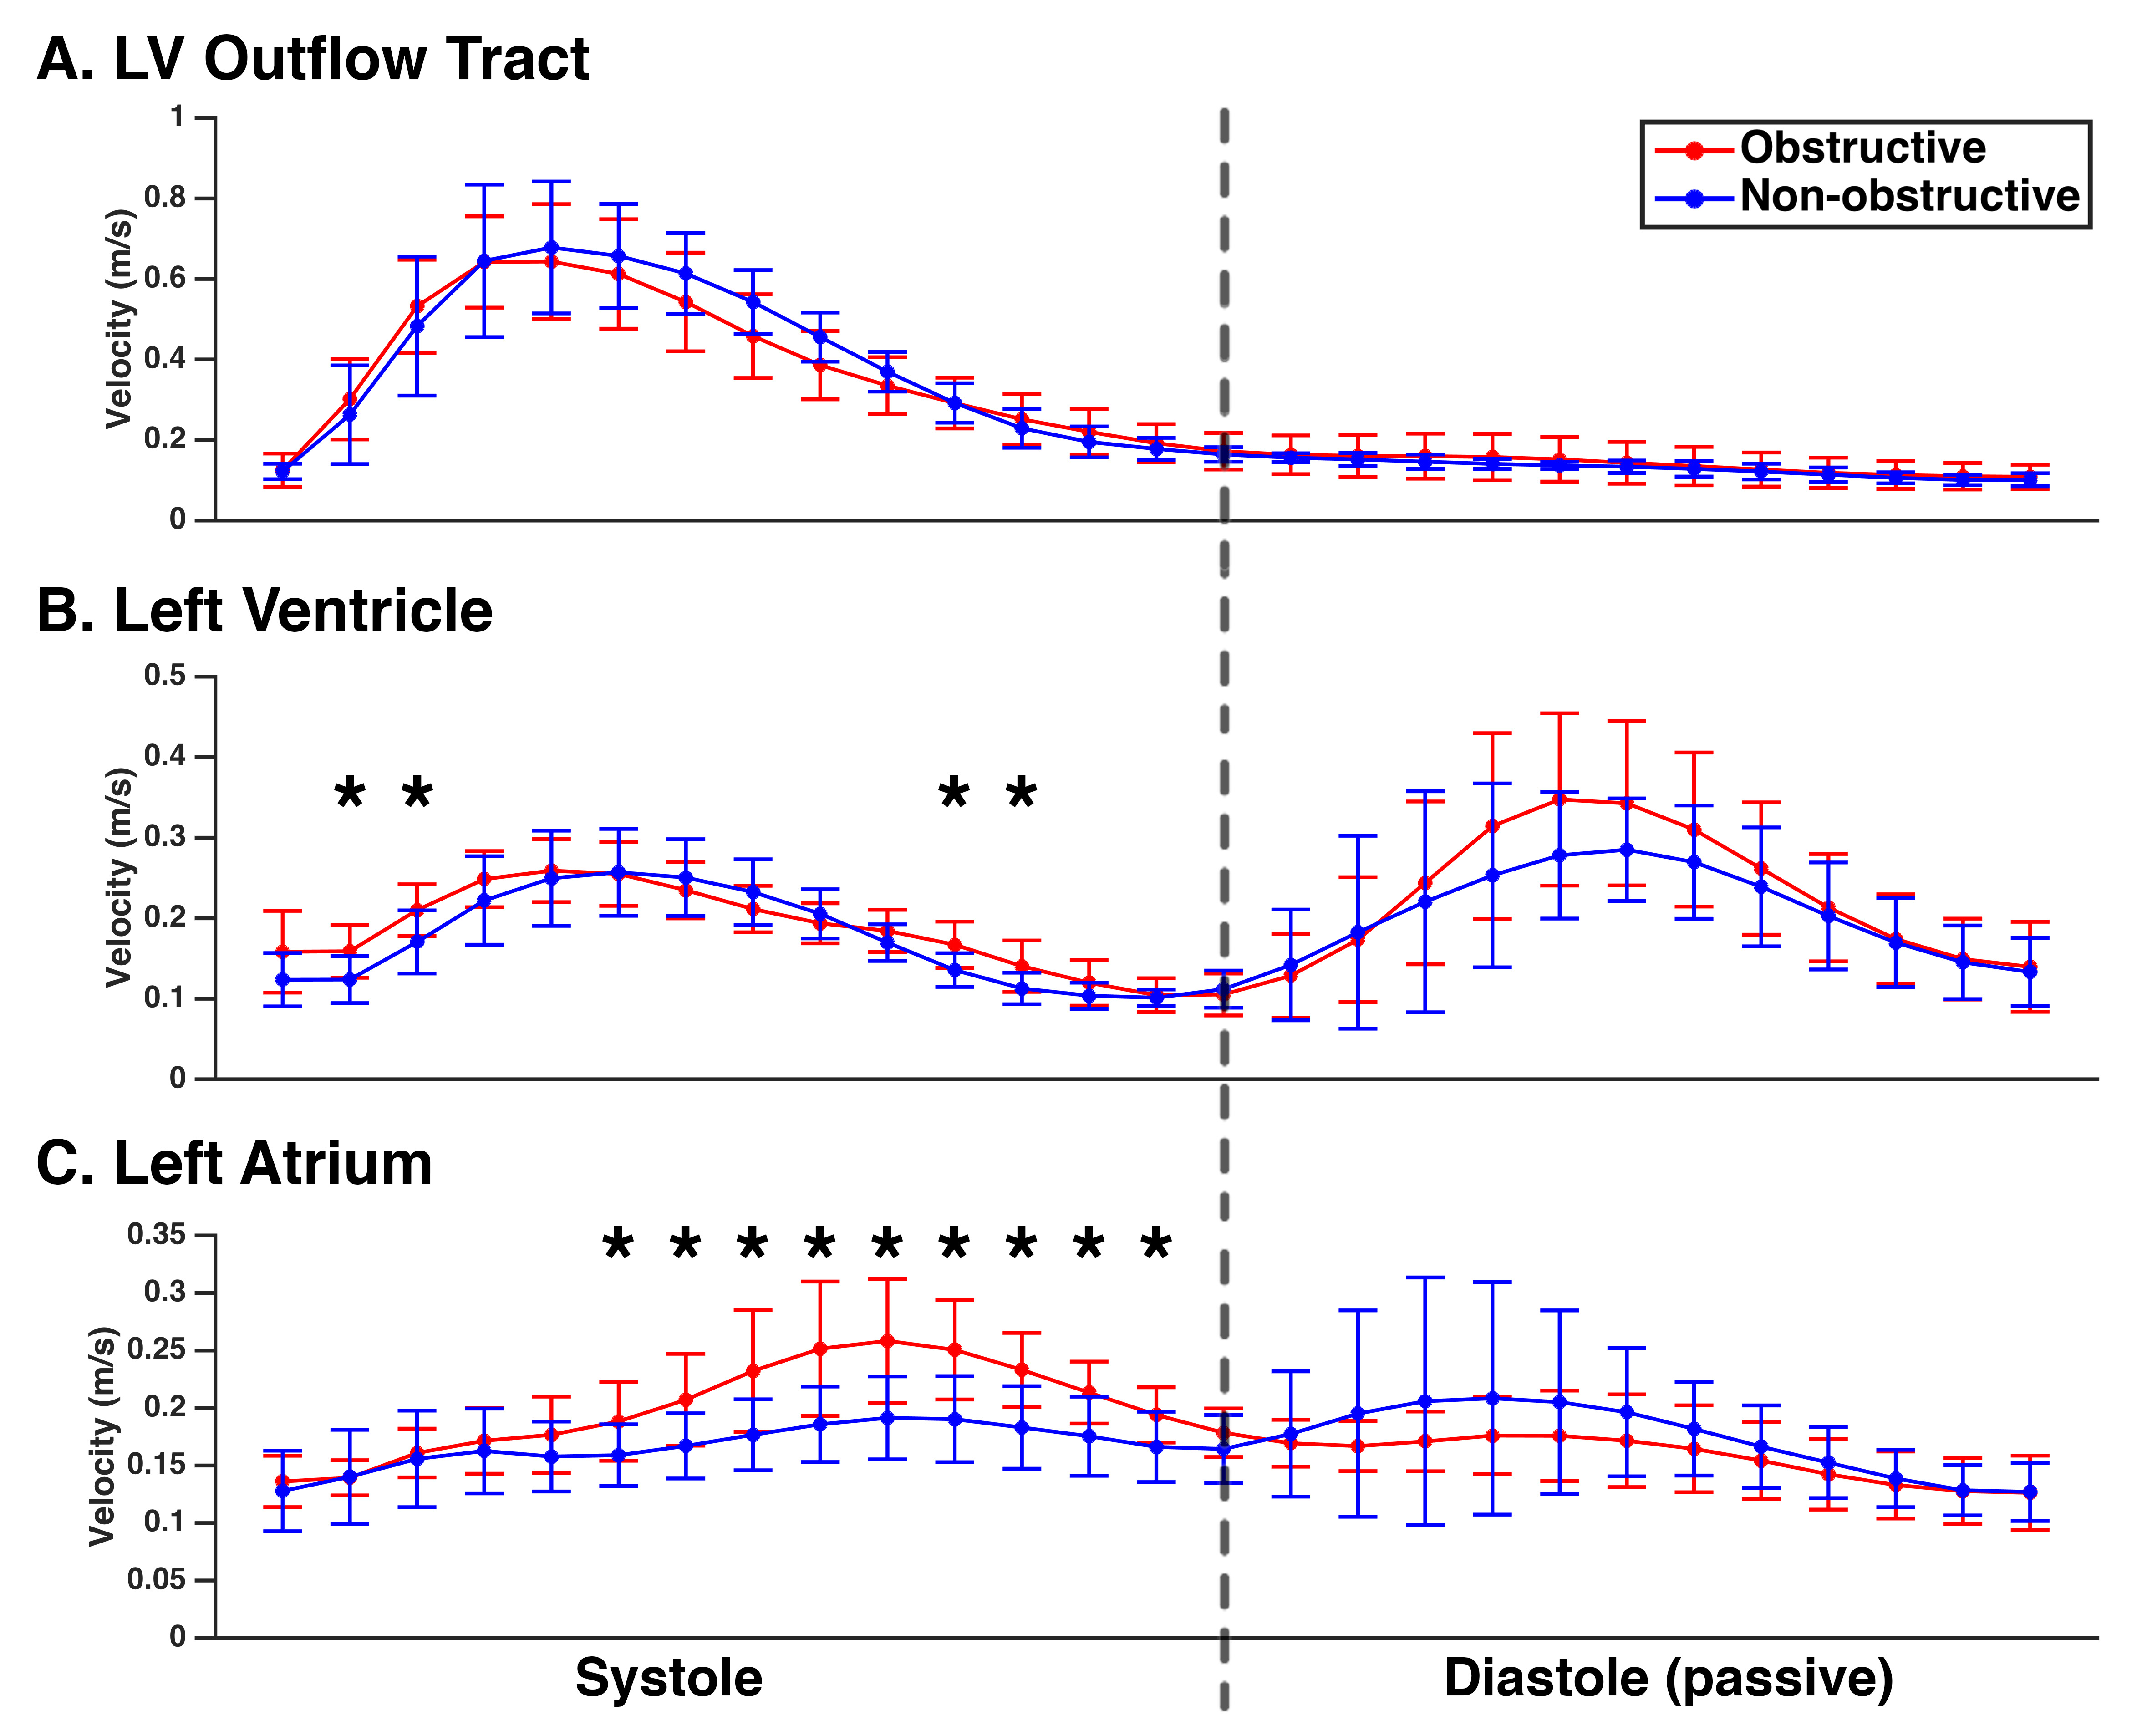
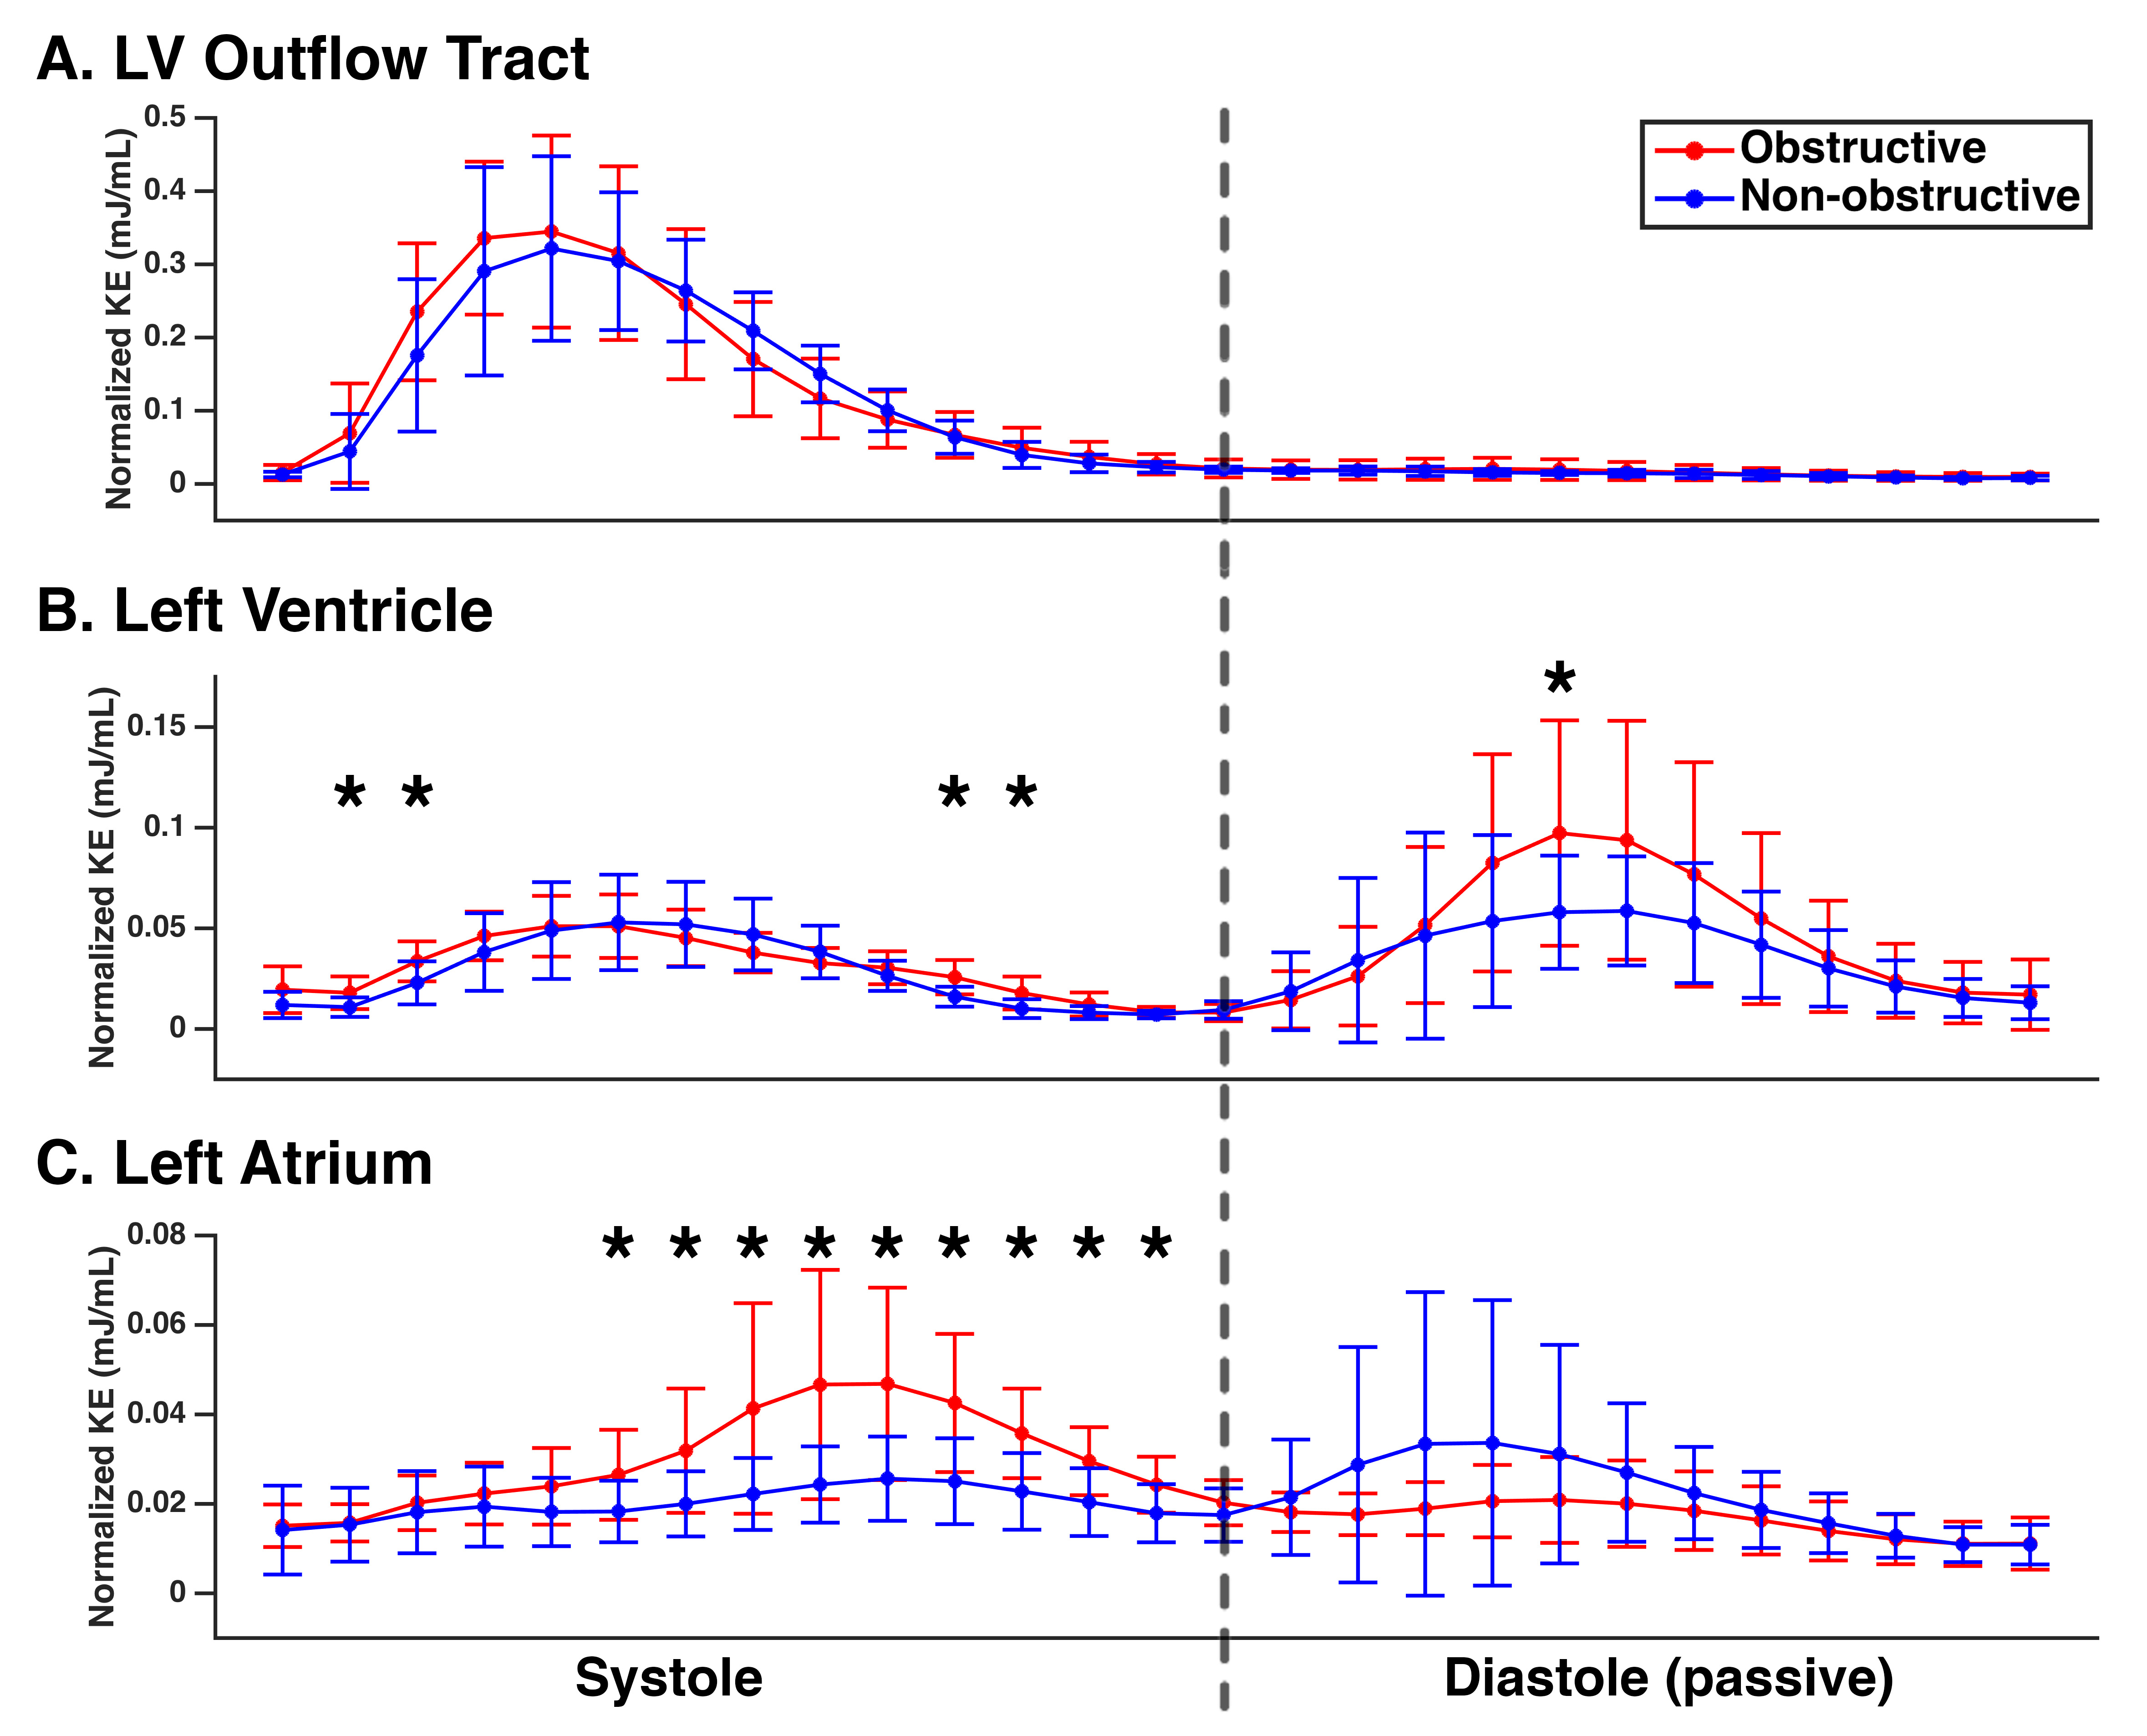
Patient demographics are summarized in Table 1. Age was significantly different between the two subgroups (p=0.04). High velocity and MR severity, characteristic of obstructive HCM, explain increases in peak LVOT velocity and severity of MR (Table 1). Figure 1A depicts laminar LVOT flow seen in a patient with non-obstructive HCM, while Figure 1C displays disrupted LVOT outflow and MR seen in obstructive HCM. For energy parameters (Table 1), obstructive HCM had higher LVOT velocitysys,peak (2.29±0.43 vs. 3.60±0.65 m/s, p<0.001) and velocitydiast,peak (1.75±0.65 vs. 2.46±1.75 m/s, p=0.01) with higher SDvelocity (0.33±0.05 vs. 0.39±0.06 m/s, p=0.04). In the LA, high velocity systolic MR jets in obstructive HCM created elevated velocitysys,peak (1.62±0.65 vs. 2.41±0.85 m/s, p=0.02), SDvelocity (0.09±0.02 vs. 0.12±0.03 m/s, p=0.03), and KEsys,norm (0.21±0.08 vs. 0.34±0.15 mJ/mL, p=0.01). KEsys,norm and KEdiast,norm are depicted as box plots for each chamber (Figure 2). LVOT average velocities and KEnorm were similar between subgroups throughout the cardiac cycle (Figures 3-4). LV velocities and KEnorm were significantly higher in obstructive patients at two time points at the onset and two near the end of systole. LV KEnorm was also increased at peak diastole in obstructive HCM. Starting immediately after peak LVOT velocity, LA velocities and KEnorm were significantly elevated in obstructive patients through the remainder of systole.Discussion/Conclusions
Velocity and KE analyses are especially effective in characterizing the dynamic, time-varying MR jet observed in obstructive HCM. High velocity MR jets raise the total kinetic energy of the LA during systole. Interestingly, these increased LA velocities are sustained through systole and cease upon opening of the mitral valve. 4D flow MRI offers novel KE and velocity analyses that can help identify how HCM patients are expending more energy to compensate and help visualize the 3D deranged flow patterns. Including these energetic parameters may be useful to detect significant MR that is underestimated by echo, identify patients at higher risk of atrial fibrillation, and inform treatment options.Acknowledgements
This work was supported by NIH R01HL 115828.References
1. Maron, B. J., and M. S. Maron. "Hypertrophic cardiomyopathy." Lancet 381.9862 (2013): 242-55. Print.
2. Maron, B. J., et al. Hypertrophic cardiomyopathy: present and future, with translation into contemporary cardiovascular medicine. J Am Coll Cardiol 64.1 (2014): 83-99. Print.
3. Gersh, B. J., et al. "2011 ACCF/AHA guideline for the diagnosis and treatment of hypertrophic cardiomyopathy: executive summary: a report of the American College of Cardiology Foundation/American Heart Association Task Force on Practice Guidelines." J Am Coll Cardiol 58.25 (2011): 2703-38. Print.
4. Allen, B. D., et al. "Three-Dimensional Haemodynamics in Patients with Obstructive and Non-Obstructive Hypertrophic Cardiomyopathy Assessed by Cardiac Magnetic Resonance." Eur Heart J Cardiovasc Imaging 16.1 (2015): 29-36. Print.
5. Bock J, Kreher B, Hennig J, Markl M. Optimized pre-processing of time-resolved 2d and 3d phase contrast mri data. Proceedings of the 15th Annual Meeting of ISMRM, Berlin, Germany. 2007:3138
Figures