0012
30 times accelerated 4D flow MRI in the carotids using a Pseudo Spiral Cartesian acquisition and a Total Variation constrained Compressed Sensing reconstruction1Radiology and Nuclear Medicine, Academic Medical Center (AMC), Amsterdam, Netherlands, 2Biomedical Engineering and Physics, Academic Medical Center (AMC), Amsterdam, Netherlands
Synopsis
4D flow MRI enables visualization and quantification of complex blood flow, and provides relevant biomarkers, such as wall shear stress. A 4D flow MRI acquisition, however, takes between 15-40 min, which complicates its use in clinical practice. In this work, we developed a technique to reduce scan time by prospectively undersampling k-space in a pseudo-spiral Cartesian fashion. Combined with a Compressed Sensing reconstruction using a total variation sparsifying transform in time, this technique makes 4D flow MRI in the carotid arteries 20-30 times faster, while preserving accuracy in flow and wall shear stress measurements.
Introduction
4D flow MRI enables comprehensive visualization and quantification of complex blood flow, and provides relevant biomarkers, such as wall shear stress (WSS)1,2. A traditional 4D flow MRI acquisition, however, takes between 15-40 min, which complicates its use in clinical practice. In this work, we developed a technique to reduce scan time by prospectively undersampling k-space in a pseudo spiral Cartesian fashion. Combined with a Compressed Sensing reconstruction employing a total variation sparsifying transform in time, we show that the undersampled data can be reconstructed at full image accuracy. We investigated the performance of this technique up to acceleration factors of 30 in a carotid flow phantom and a healthy volunteer.Methods
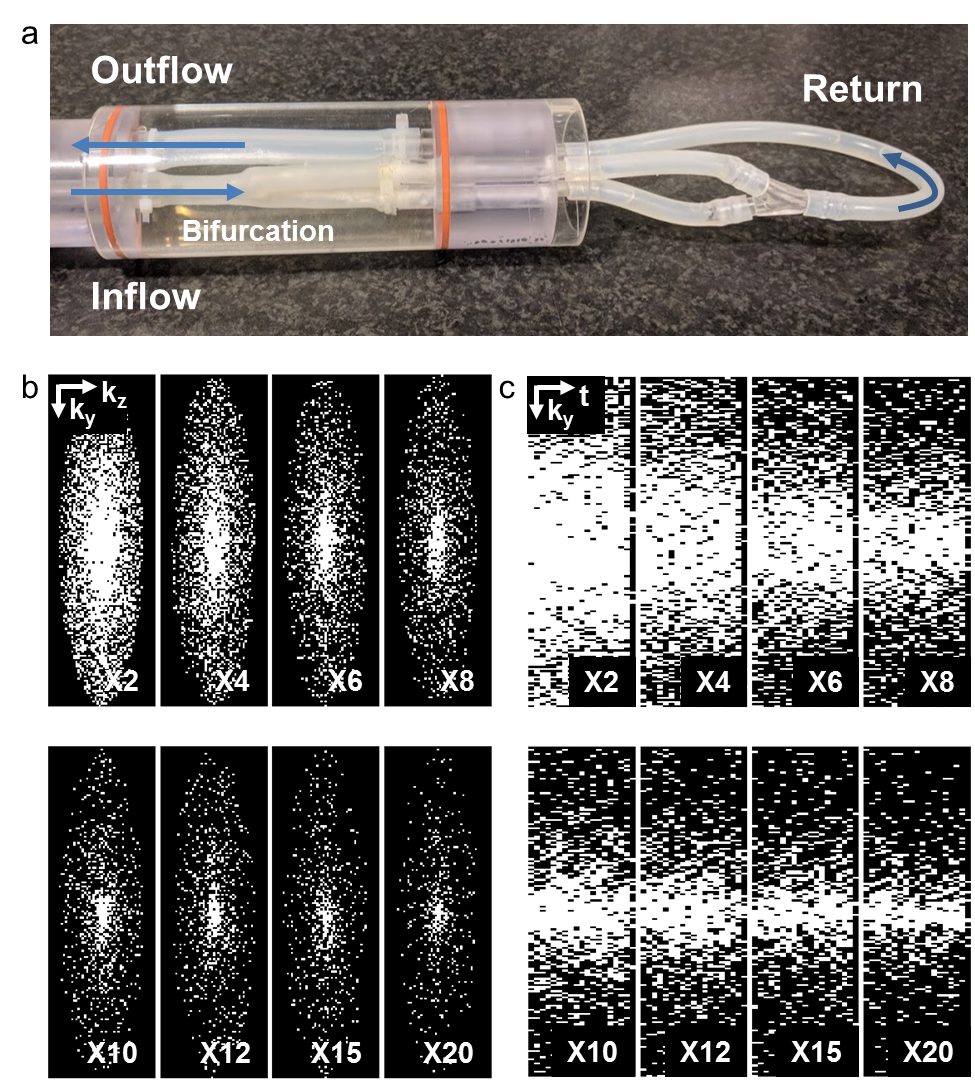
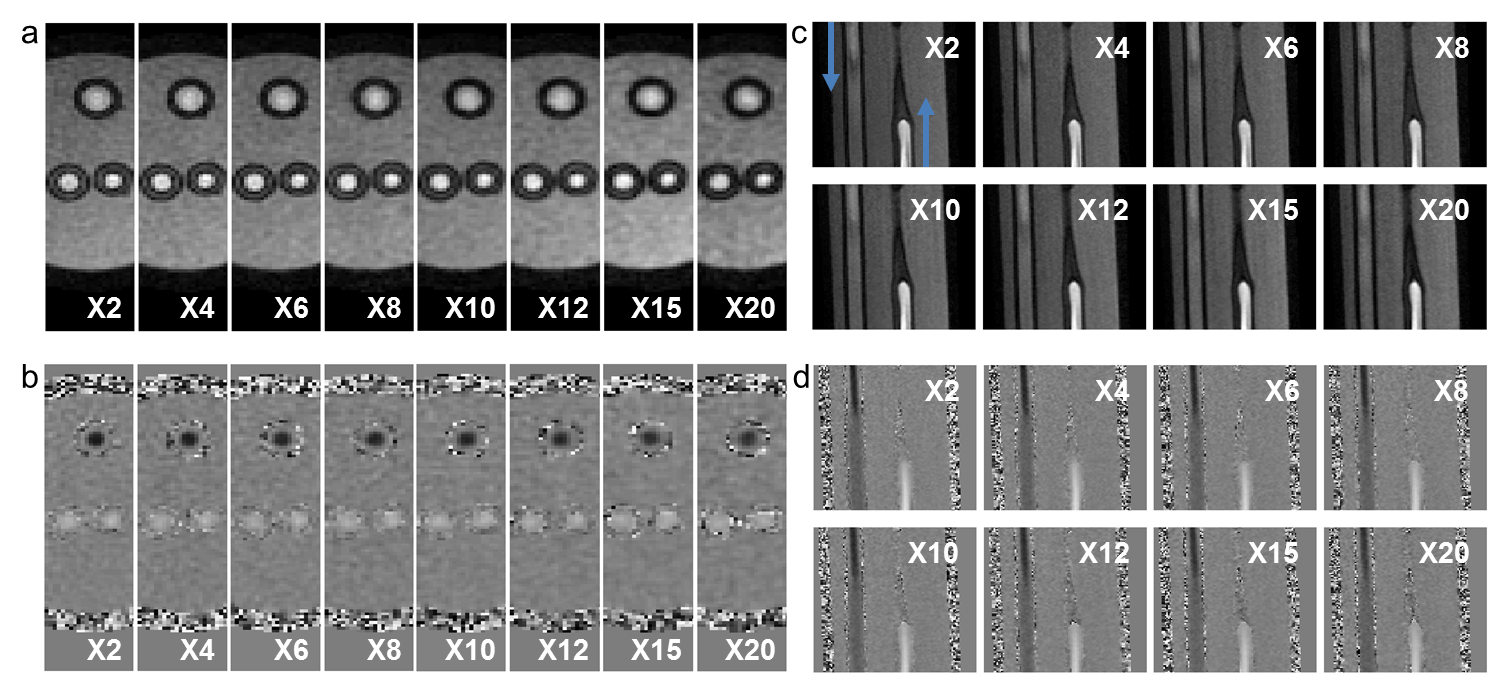
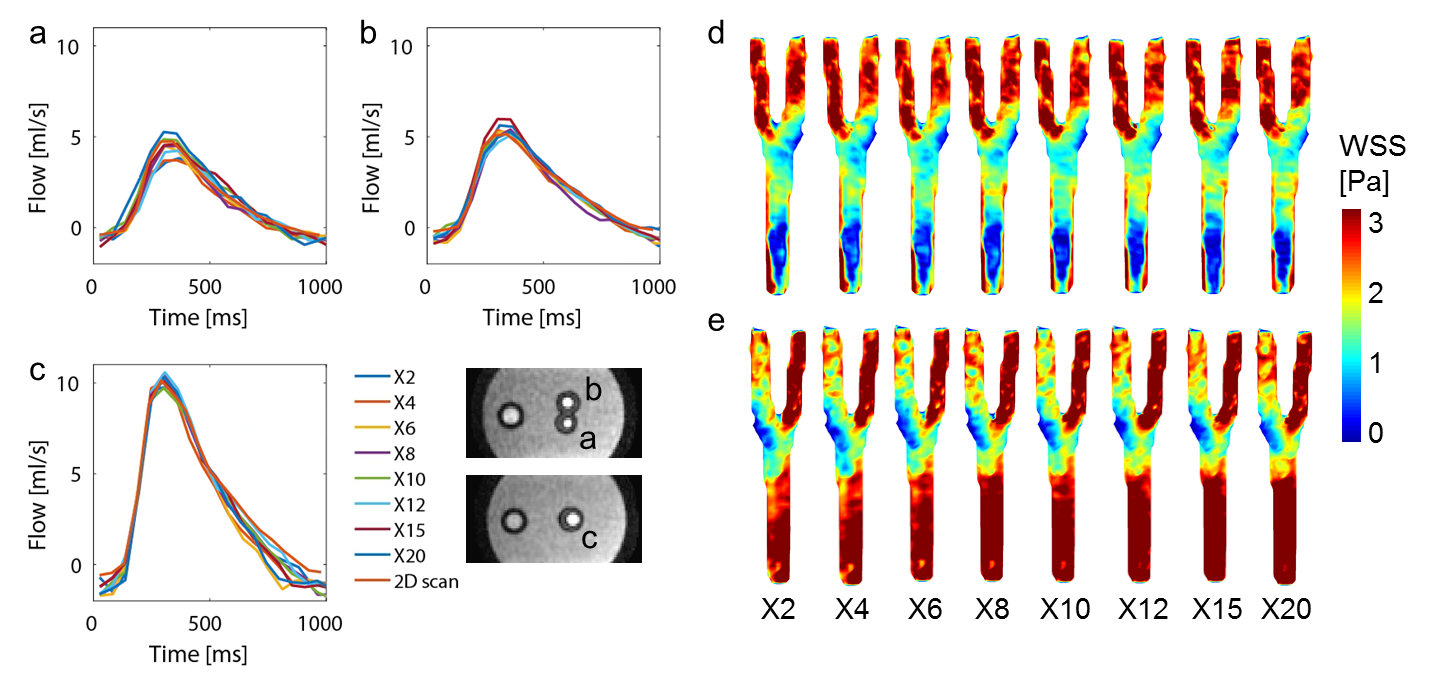
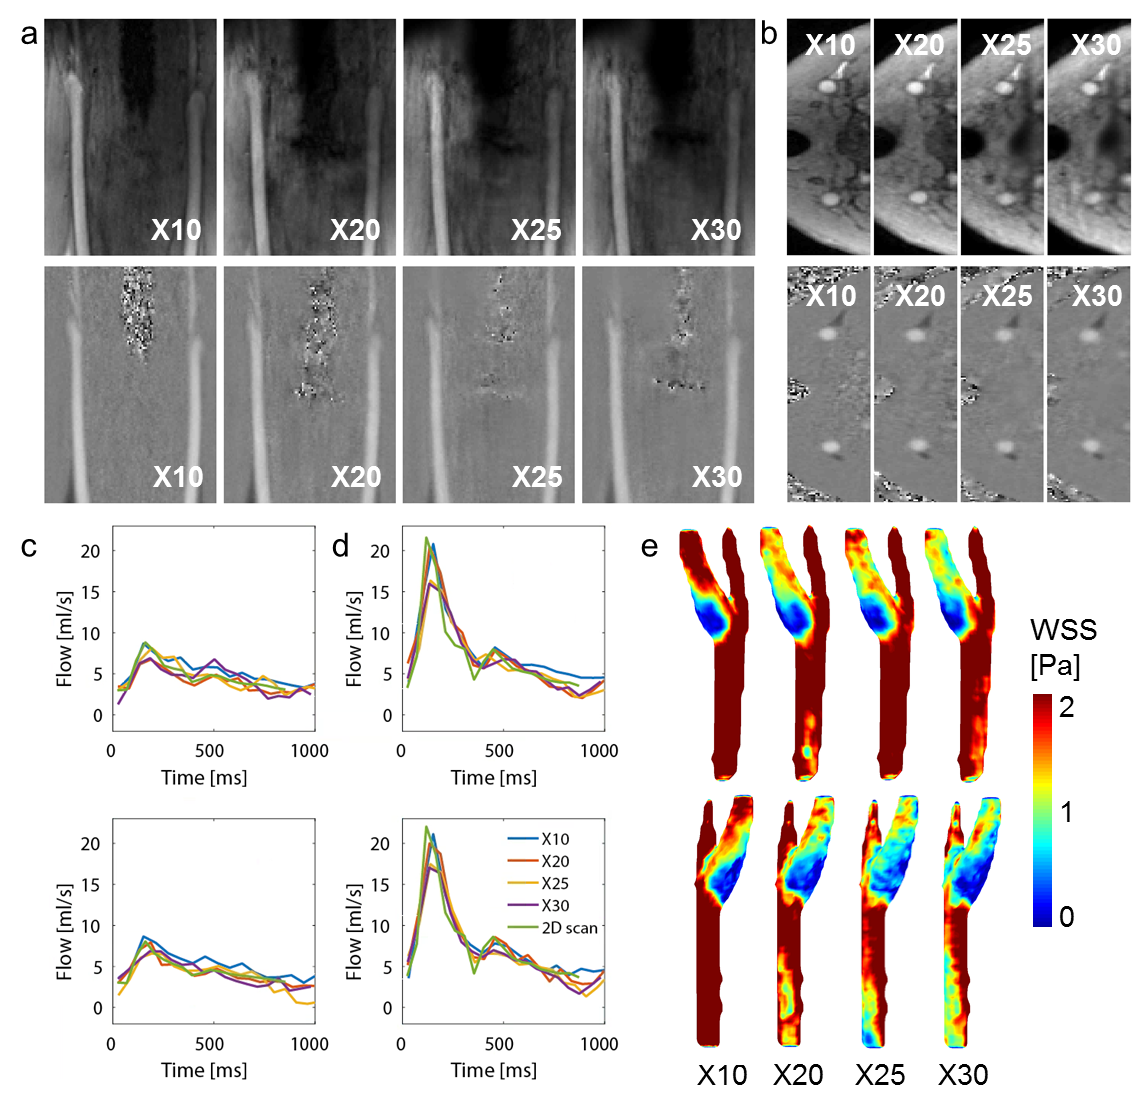
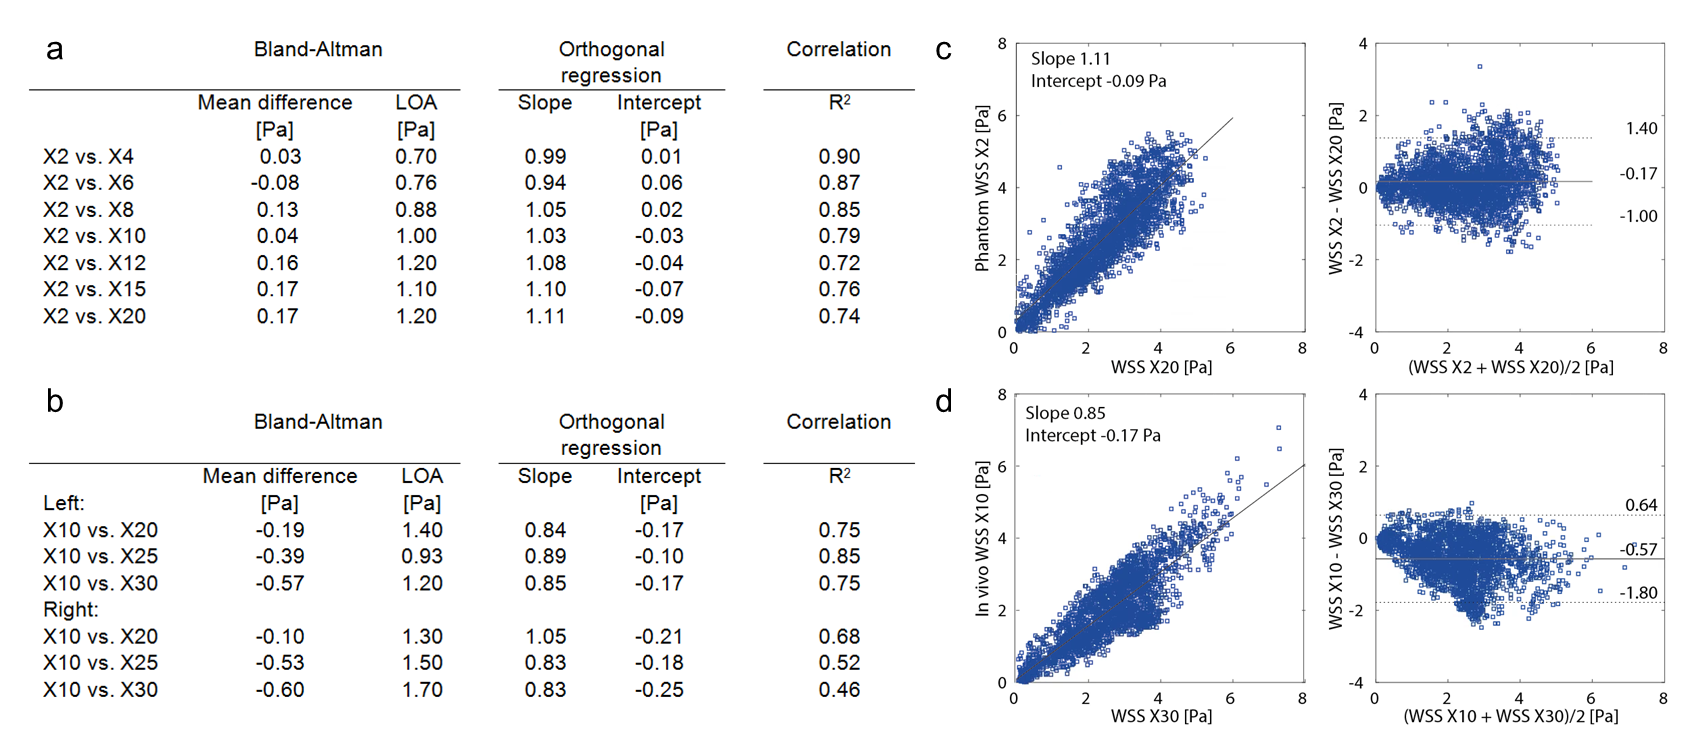
Using our pseudo spiral Cartesian sampling method, incoherent undersampling patterns were created in time and two phase encoding directions. More specifically, data was sampled along a predefined trajectory with spiral arms of 100 Cartesian readouts. The scanner software was modified to continuously change k-line coordinates within each heartbeat and during a retrospectively gated scan. After cardiac binning, this leads to unique undersampling patterns per cardiac frame. The spiral shape of the trajectory additionally creates a variable density pattern, providing a fully sampled center at any acceleration factor. The technique was tested on a flow phantom (Figure 1a) consisting of a silicon carotid artery, in which pulsatile water flow could be applied. 4D flow MRI was performed at a Philips 3T Ingenia scanner (Philips Healthcare, Best, The Netherlands) using a 32-channel head coil. The scans were accelerated X2-X20 times, with corresponding scan times decreasing from 45:57 to 4:30 min (non-accelerated scan time: 1:44 hours). Scan parameters were: TR/TE=8.1/4.5ms, VENC=150m/s, matrix size=160x160x40, FOV=128x128x32mm3, spatial resolution=0.8x0.8x0.8mm3, and 19 cardiac frames. As a reference, fully sampled 2D scans with identical spatio-temporal resolution and scan settings were acquired at two planes perpendicular to the tubes. The acceleration technique was then applied on the carotids of one male healthy volunteer (25 years) using an 8-channel neck coil. Using the same settings, the scans were accelerated X10-X30 times (scan times: 9:08-2:32 min). Raw data was processed with MRecon (Gyrotools, Zurich, Switzerland). Compressed Sensing reconstruction was performed with BART3 using a total variation constraint in time. A regularization parameter of r=0.01 and 10 iterations led to the highest image quality and was used for all reconstructions. Flow curves were calculated from ROIs drawn in the same slices for all scans (GTFlow, Gyrotools, Zurich, Switzerland). For WSS calculation4, a 3D segmentation of the carotids was created in Mimics (Materialise, Leuven, The Netherlands) on the scan with the lowest acceleration factor. WSS between the scans was compared pixel-wise using Bland-Altman plots and an orthogonal regression analysis.Results
Figure 1b-c shows the resulting variable density undersampling patterns for the phantom scan. Magnitude and velocity images after Compressed Sensing reconstruction are shown in Figure 2. Both image types look similar for all acceleration factors. The tube walls show a slight blurring for X20. Flow curves at common, internal, and external carotids (CCA, ICA and ECA) are plotted in Figure 3 for the phantom, together with WSS for all acceleration factors. Even for X20 the flow curves and WSS are similar to the 2X reference. Magnitude and velocity images, together with flow values of the in vivo scan are shown in Figure 4. Although the velocity images show a high contrast, blurring can be observed around the region of the carotid bulb for high acceleration factors. WSS is shown for left and right carotid respectively. The highest flow deviation from the 2D reference in the phantom scan was 9% for X20. For the in vivo scan the deviation was 25% for X30 compared to the 2D reference scan. As shown in Table 1, WSS values are slightly overestimated for acceleration factors higher than X8 in the phantom (maximal mean difference 0.17 Pa) compared to X2. In the in vivo scans X30 underestimated WSS (maximal mean difference -0.60 Pa) compared to the lowest acceleration.Discussion
The developed acceleration technique shows an overall high consistency in flow curves between accelerated scans and the 2D reference. 4D flow MRI can be done 20 times faster without losing accuracy in flow. In studies with similar techniques, acceleration factors up to 19 have been shown to provide clinically acceptable image quality5. 30 times accelerated scans show more undersampling artifacts and a lower flow during peak systole, but remain acceptable in the WSS calculation. With a scan time of 2:32 min carotid WSS estimation could serve as a valuable addition in clinical protocols.Conclusion
With pseudo spiral Cartesian undersampling and a Compressed Sensing reconstruction, 4D flow MRI can be accelerated reliably between 20 and 30 times in the carotid arteries.Acknowledgements
Funded by NWO Grant HTSM2014. We thank Maarten Versluis (Philips), Gérard Crelier (Gyrotools) and Martin Bührer (Gyrotools) for their support.References
1. Markl M, Frydrychowicz A, Kozerke S, Hope M, Wieben O. 4D flow MRI. J Magn Reson Imaging. 2012;1036:1015-1036.
2. Ooij P Van, Potters W V, Nederveen AJ, et al. A Methodology to Detect Abnormal Relative Wall Shear Stress on the Full Surface of the Thoracic Aorta Using Four-Dimensional Flow MRI. 2015;1227:1216-1227.
3. Uecker M. Berkeley Advanced Reconstruction Toolbox Target Audience: 2015;163(1991):25176.
4. Potters W V., Marquering HA, VanBavel E, Nederveen AJ. Measuring Wall Shear Stress Using Velocity-Encoded MRI. Curr Cardiovasc Imaging Rep. 2014;7(4):1-12.
5. Cheng JY, Hanneman K, Zhang T, et al. Comprehensive Motion-Compensated Highly Accelerated 4D Flow MRI With Ferumoxytol Enhancement for Pediatric Congenital Heart Disease. 2015.
Figures