0009
Quantitative MRI detects acute vascular effects of e-cig aerosol inhalation13400 Spruce St, University of Pennsylvania, Philadelphia, PA, United States, 2Radiology, University of Pennsylvania, Philadelphia, PA, United States, 3University of Pennsylvania, Philadelphia, PA, United States
Synopsis
The rapid rise in the popularity and use of the electronic cigarettes among adolescents are unsettling trends in spite of the limited science that exists on the health effects of e-cigarettes. The purpose of this project was to introduce a noninvasive method for the study of the systemic acute effects of e-cigarette aerosol inhalation on the cardiovascular system by means of quantitative MRI that targets various vascular territories. Preliminary data show reduced femoral vein SvO2 and impaired flow-mediated dilation in the femoral artery, along with elevated aortic arch pulse-wave velocity after an e-cigarette challenge equivalent to one conventional cigarette.
INTRODUCTION
The current tools available for detecting the earliest presymptomatic vascular changes, brought about by endothelial dysfunction (EDF), are relatively limited. Building on recent work in the investigators’ laboratory in which multiple functional and mechanical surrogate measures of EDF were quantified in tobacco cigarette smokers1 we propose to examine the acute effects of aerosol inhalation by quantitative MRI (qMRI). In this pilot study, we hypothesize that the oxidative stress exerted by nicotine-free e-cigarette (e-cig) aerosol causes EDF. In healthy non-smokers, we examined acute effects by assessing vascular reactivity via dynamic femoral oximetry2, arterial hyperemia3, femoral artery flow-mediated dilation4, central pulse-wave velocity5 and neurovascular reactivity6, all as part of a single integrated MRI protocol.METHODS
The evaluation of systemic EDF by qMRI protocol comprises three parts1: peripheral vascular reactivity, central artery stiffness and neurovascular reactivity.
Peripheral vascular reactivity
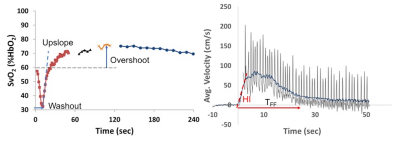
Blood oxygenation (SvO2) and flow velocity in the femoral vein and artery, respectively, are simultaneously quantified during reactive hyperemia in response to 5 minutes of cuff-induced ischemia3. Prior to the cuff inflation SvO2 is measured and the arterial velocity is time-resolved for estimating the resistive index (RI) and hyperemic index (HI). RI is a measure of vascular resistance and HI represents the rate of change in the average velocity resistance during hyperemia. Fig 1 shows time-courses of SvO2 and velocity of a healthy subject. At four time points (prior to cuff inflation and 60s, 90s, 120s after the cuff release) vessel wall images of the femoral artery are acquired to determine the maximal flow mediated dilation (FMD); note the missing data points about 60, 90 and 120s of SvO2 time-course (Fig 1a).
Central artery stiffness
The stiffness of the central artery is assessed in terms of aortic arch pulse-wave velocity (PWV) with a non-triggered projection method5. Velocity-dependent signals from the proximal (ascending aorta) and distal (proximal descending aorta) slices are time-resolved without gating by acquiring velocity-sensitized projections only repeatedly to map the complex difference signal intensity. In this manner, scan time is significantly shortened (~10s) while eliminating gating errors compared to conventional MRI methods7. The time-resolved “velocity” waveforms are spatially averaged along the readout direction within the vessel boundaries for each time-point and plotted jointly to determine the transit time via the “foot-to-foot” method as commonly done in tonometry8.
Neurovascular reactivity
Quantified in terms of the change in superior sagittal sinus blood flow in response to a hypercapnic stiumulus in the form of a breath-hold. The change in blood flow is measured at a temporal resolution of 3 seconds9 and the slope of the flow-velocity versus time curve (referred to as breath-hold index, BHI) is computed. The qMRI protocol was implemented at 3T (Siemens Prisma) with an extremity, body matrix and head/neck coil. Average acquisition time (including patient and coil set-up) was approximately 50 mins. This protocol was repeated after an e-cig challenge consisting of 16 successive 3s long drags (equivalent to smoking one conventional cigarette) and inhalation of the e-cig aerosol. To date, three non-smoking females (ages 23±1 years, Hct 0.40±0.01), free of cardiovascular disease underwent the qMRI protocol before and after an e-cig challenge.
RESULTS
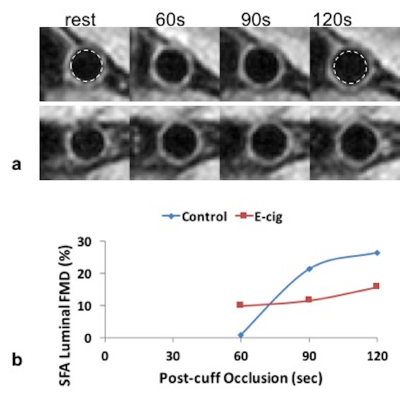
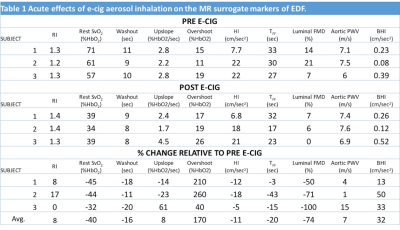
The changes in the surrogate markers of EDF derived with qMRI are summarized in Table 1. Across the subjects all the parameters either increased or decreased after the e-cig challenge except RI and upslope. The changes in FMD and PWV parallel previous studies on acute effects of e-cig aerosol using conventional techniques10,11. Fig 2 shows vessel wall images of the femoral artery before and after the e-cig challenge used to estimate luminal FMD. Intuitively, the impairment in FMD is in line with the decrease in HI and TFF, which are related to the rate of increase in blood flow velocity and duration of hyperemia after the cuff release. The large decrease in the baseline SvO2 is unexpected (further study is warranted) and is responsible for the large increase in overshoot after the e-cig aerosol inhalation. Based on the initial experience the BHI estimation requires a high degree of subject compliance.CONCLUSIONS
The observed effects on the cardiovascular system is caused by the aerosol alone (i.e. absence of nicotine) and the initial results suggest acute systemic EDF from inhalation of e-cig aerosol is detectable with qMRI. This is consistent with the previous findings that e-cig aerosol contains ultrafine particles, which are taken up by the alveoli from where they translocate into the vascular space12 leading to altered physiological outcomes such as elevated PWV and impaired FMD. The definitive conclusions require studies in larger numbers of subjects, which is in progress.Acknowledgements
NIH Grants K25 HL111422, RO1 HL109545 and RO1 HL139358.References
[1] Langham et al, JCMR 2015; [2] Langham et al, JACC 2010; [3] Langham et al, JCMR 2011; [4] Langham et al, JCMR 2013; [5] Langham et al, MRM 2011; [6] Wehrli et al, ISMRM 2015; [7] Mohiaddin et al, J Appl Physiol 1993; [8] Laurent et al, European heart journal 2006; [9] Rodgers et al, ISMRM 2013; [10] Rundell et al, Inhal Toxicol 2007; [11] Vlachopoulos et al, JACC 2016; [12] Nemmar et al, Toxicol Lett 2004.Figures


