0007
Impact of field strength (1.5, 3.0 and 7.0 Tesla) and sequence on quantification of aortic flow volumes, peak velocity and wall shear stress using 4D flow MRI1Experimental and Clinical Research Center, a joint cooperation between the Charité Medical Faculty and the Max-Delbrueck Center for Molecular Medicine and HELIOS Hospital Berlin Buch, Department of Cardiology and Nephrology, Berlin, Germany, 2DZHK (German Center for Cardiovascular Research), partner site Berlin, Berlin, Germany, 3Physikalisch-Technische Bundesanstalt (PTB), Braunschweig and Berlin, Germany, 4SCO:SSIS Statistical Consulting, Berlin, Germany, 5Clinic Agatharied, Department of Cardiology, Ludwig-Maximilians-University Munich, Hausham, Germany, 6Siemens Healthcare, Erlangen, Germany, 7Department of Radiology, Northwestern University, Feinberg School of Medicine, Chicago, IL, United States
Synopsis
For implementing 4D flow in clinical routine, standardization is important. We evaluated equivalence of 4D flow parameters in different sequences and at three different field strengths. Ten healthy volunteers were scanned at 1.5T, 3.0T and 7.0T. At 1.5T, three different sequences were applied. Ascending aorta, aortic arch and descending aorta of each scan were evaluated for diagnostic quality. After exclusion of non-diagnostic segments, equivalence testing for flow, wall shear stress and peak velocity was performed. Acceptable equivalence was determined by intra-rater analysis. Comparison of different field strengths as well as different sequences did not reach equivalence. 4D flow sequences are not interchangeable.
Introduction
4D flow MRI providing hemodynamic information has entered the clinical arena. 4D flow allows time-resolved visualization of complex flow patterns and quantification of flow volumes or velocities in patients with aortic valve and aortic pathologies1-6. Additionally, more advanced parameters such as wall shear stress (WSS) can be quantified.
4D flow MRI has been applied using various sequences and at different field strengths.
For use in clinical routine as well as further follow up studies, standardization and awareness of confounders are crucial. Our aim was to evaluate the equivalence of 4D flow-derived aortic hemodynamic parameters using different sequences and at three different field strengths.
Methods
We included ten healthy volunteers (six women, mean age: 33±9 years).
They were scanned at 1.5T (Magnetom Avanto fit), 3.0T (Magnetom Verio), and 7.0T (research system) (all Siemens Healthcare, Erlangen, Germany). Furthermore, at 1.5T, three prototype sequences using different scan parameters were applied. The parameters are listed in Table 1.
At 7.0T a local single-channel transmit, 16-channel receive coil was used, that provided an optimized transmit magnetic field within the heart.
Diagnostic quality was evaluated for the ascending aorta, the aortic arch and the descending aorta in each subject and sequence. Segments with non-diagnostic quality were excluded. Non-diagnostic quality was defined as artifacts, blurriness or signal loss across/in the segments.
All remaining segments were evaluated for flow volumes (forward flow and regurgitation fraction) as well as WSS and peak velocity using a previously published approach5, 7-9. Briefly, data were corrected for Maxwell terms and eddy-currents (MATLAB, The MathWorks Inc., USA). The aorta was manually segmented (Mimics, Materialise, Belgium) before positioning of 2D planes for flow quantification (EnSight, Version 10.0, USA) and calculation of peak velocity and WSS (MATLAB). Measurements were done at different aortic locations (figure 1).
Bland-Altman analyses were used to assess mean difference, limits of agreement (95% confidence interval (CI) of difference) and range of agreement between sequences for each parameter.
Futhermore, we tested the equivalence of sequences as this parameter is relevant for clinical use. For equivalence testing one reader analyzed a subset of data twice (intra-rater analysis). Bland-Altman analyses were also performed on the intra-rater analysis for each parameter. The 95% CI obtained in the Bland-Altman analyses on the intra-rater analysis was defined as the range of equivalence acceptable between sequences. Equivalence was reached if the limits of the 95% CI of the comparison between sequences respectively field strengths laid within the limits of the 95% CI of the intra-rater analysis.
Statistical analysis was performed with SAS 9.4 (SAS Institute Inc. USA) and Graph Pad Prism 6.0 (GraphPad Software Inc., USA).
Results
At 7.0T two scans were not evaluable due to technical reasons.
Image Quality
90% of the segments with non-diagnostic image quality were obtained at 7.0T, and 60% in the aortic arch (table 2).
After exclusion of non-diagnostic segments, 134 segments remained for analysis.
Comparison of field strengths
Bland-Altman plots for the intra-rater analysis showed excellent agreement for all parameters (see figure 2 – grey area). Comparison of field strengths showed less, but still sufficient, agreement (see figure 2 – black lines). Equivalence was not reached for flow, WSS or velocity (see figure 2).
Comparison of sequences at 1.5T
Bland-Altman plots for the intra-rater analysis showed excellent agreement for all parameters (see figure 3 – grey area). Comparison of sequences showed less, but still sufficient, agreement (see figure 3 – black lines). However, the result did not reach equivalence (see figure 3).
Discussion
The different aortic 4D flow-derived parameters were quantifiable at all field strengths and with all sequences.
The Bland-Altman analyses showed sufficient agreement, whereas equivalence was not obtained for the different settings. Equivalence is a basic requirement for exchangeability in a clinical setting.
The large number of segments with non-diagnostic quality at 7.0T was caused by systematically low flip angles in the arch and descending aorta resulting in low contrast. Modifying the coil's hardware to specifically target the aorta or using a multi-transmit-channel coil combined with RF shimming will solve this problem.
Carlsson et al compared two 4D flow sequences with different acceleration techniques at 1.5T and 3.0T10. They found significant differences in peak flow. Interestingly, other groups did not find significant differences between 1.5T and 3.0T comparing mean values for net flow, peak velocity and WSS11.
The phenomenon of method-related cut-offs is well known and following our results, it is also relevant in 4D flow MRI.
Conclusion
Clinically important parameters of aortic 4D flow MRI depend on sequence characteristics as well as on field strength. 4D flow sequences are not interchangeable and larger studies are required to establish sequence- and field-strength specific normal ranges.Acknowledgements
We would like to thank the technicians Kerstin Kretschel, Evelyn Polzin, Denise Kleindienst and Martina Kohla for assisting in acquiring the MRI data, the study nurses Elke Nickel-Szczech and Annette Köhler-Rohde for assisting in the organization of the scans.References
1. van Ooij P, Markl M, Collins JD, et al. Aortic Valve Stenosis Alters Expression of Regional Aortic Wall Shear Stress: New Insights From a 4-Dimensional Flow Magnetic Resonance Imaging Study of 571 Subjects. J Am Heart Assoc 2017;6(9).
2. Lorenz R, Bock J, Barker AJ, et al. 4D flow magnetic resonance imaging in bicuspid aortic valve disease demonstrates altered distribution of aortic blood flow helicity. Magn Reson Med 2014;71(4):1542-1553.
3. Barker AJ, Markl M, Burk J, et al. Bicuspid aortic valve is associated with altered wall shear stress in the ascending aorta. Circ Cardiovasc Imaging 2012;5(4):457-466.
4. von Knobelsdorff-Brenkenhoff F, Karunaharamoorthy A, Trauzeddel RF, et al. Evaluation of Aortic Blood Flow and Wall Shear Stress in Aortic Stenosis and Its Association With Left Ventricular Remodeling. Circ Cardiovasc Imaging 2016;9(3):e004038.
5. Geiger J, Hirtler D, Gottfried K, et al. Longitudinal Evaluation of Aortic Hemodynamics in Marfan Syndrome: New Insights from a 4D Flow Cardiovascular Magnetic Resonance Multi-Year Follow-Up Study. J Cardiovasc Magn Reson 2017;19(1):33.
6. Arnold R, Neu M, Hirtler D, Gimpel C, Markl M, Geiger J. Magnetic resonance imaging 4-D flow-based analysis of aortic hemodynamics in Turner syndrome. Pediatr Radiol 2017;47(4):382-390.
7. Potters WV, van Ooij P, Marquering H, vanBavel E, Nederveen AJ. Volumetric arterial wall shear stress calculation based on cine phase contrast MRI. J Magn Reson Imaging 2015;41(2):505-516.
8. van Ooij P, Potters WV, Nederveen AJ, et al. A methodology to detect abnormal relative wall shear stress on the full surface of the thoracic aorta using four-dimensional flow MRI. Magn Reson Med 2015;73(3):1216-1227.
9. Rose MJ, Jarvis K, Chowdhary V, et al. Efficient method for volumetric assessment of peak blood flow velocity using 4D flow MRI. J Magn Reson Imaging 2016;44(6):1673-1682.
10. Carlsson M, Toger J, Kanski M, et al. Quantification and visualization of cardiovascular 4D velocity mapping accelerated with parallel imaging or k-t BLAST: head to head comparison and validation at 1.5 T and 3 T. J Cardiovasc Magn Reson 2011;13:55.
11. Strecker C, Harloff A, Wallis W, Markl M. Flow-sensitive 4D MRI of the thoracic aorta: comparison of image quality, quantitative flow, and wall parameters at 1.5 T and 3 T. J Magn Reson Imaging 2012;36(5):1097-1103.
Figures
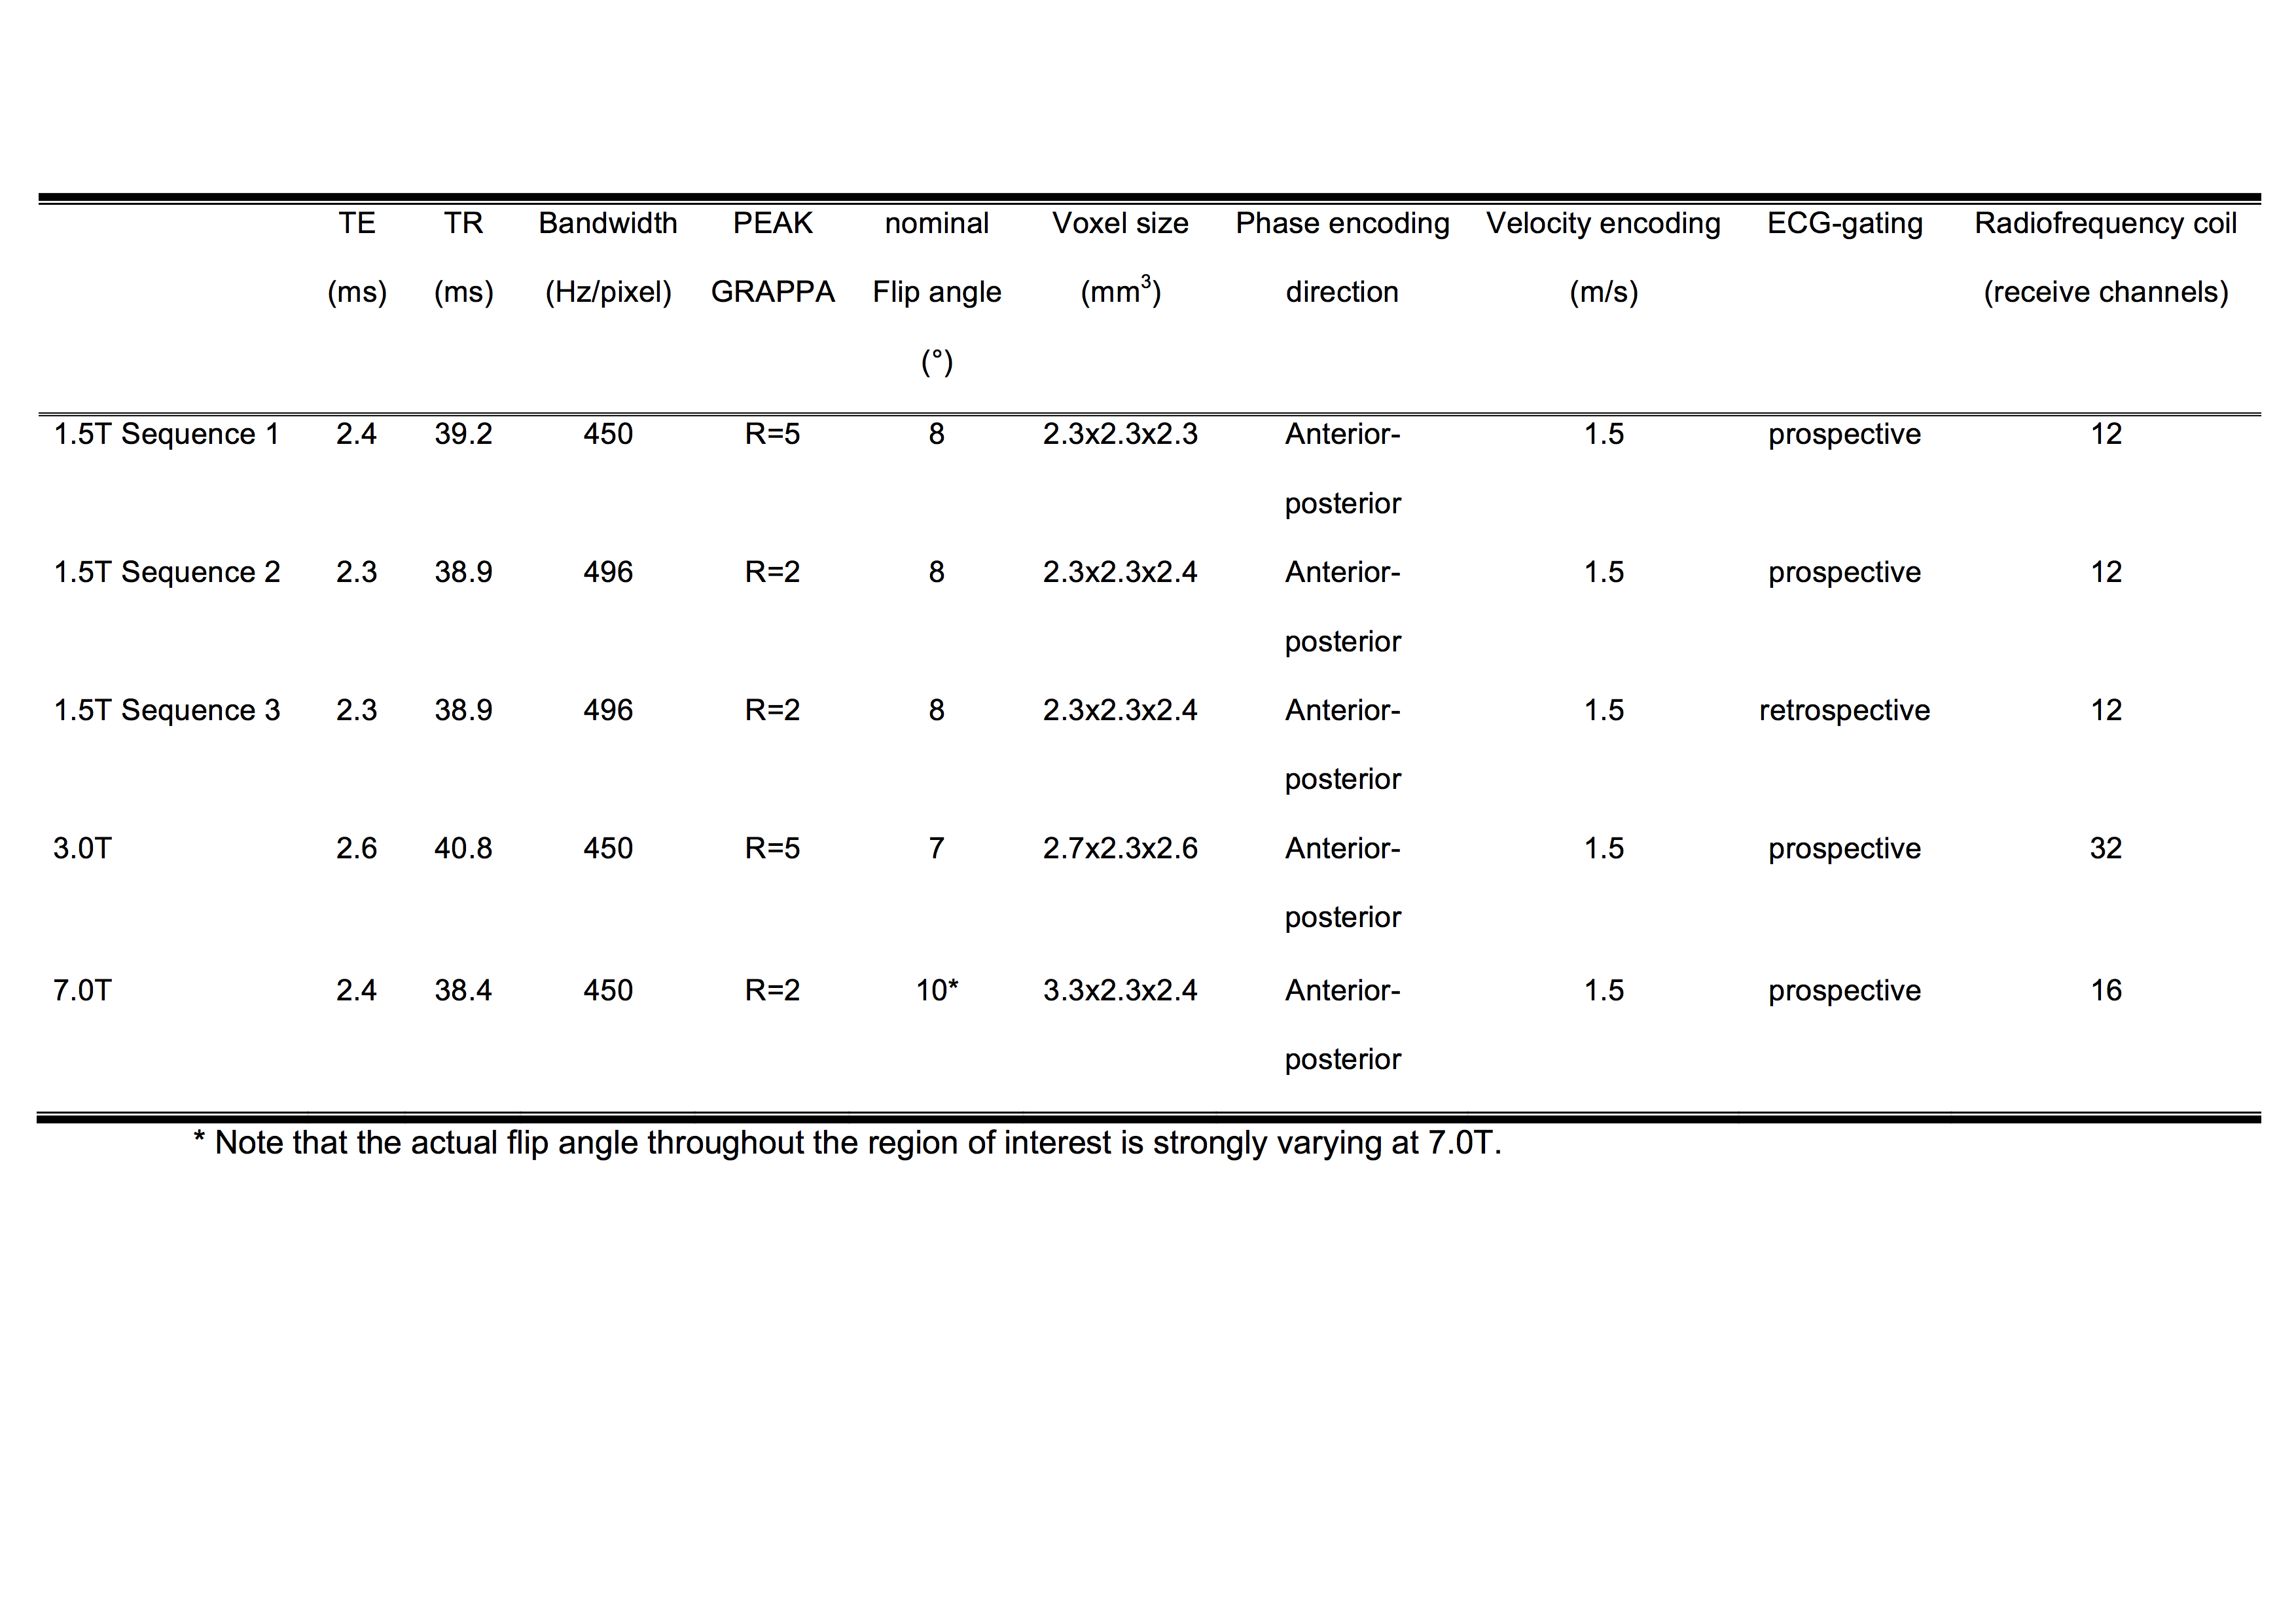
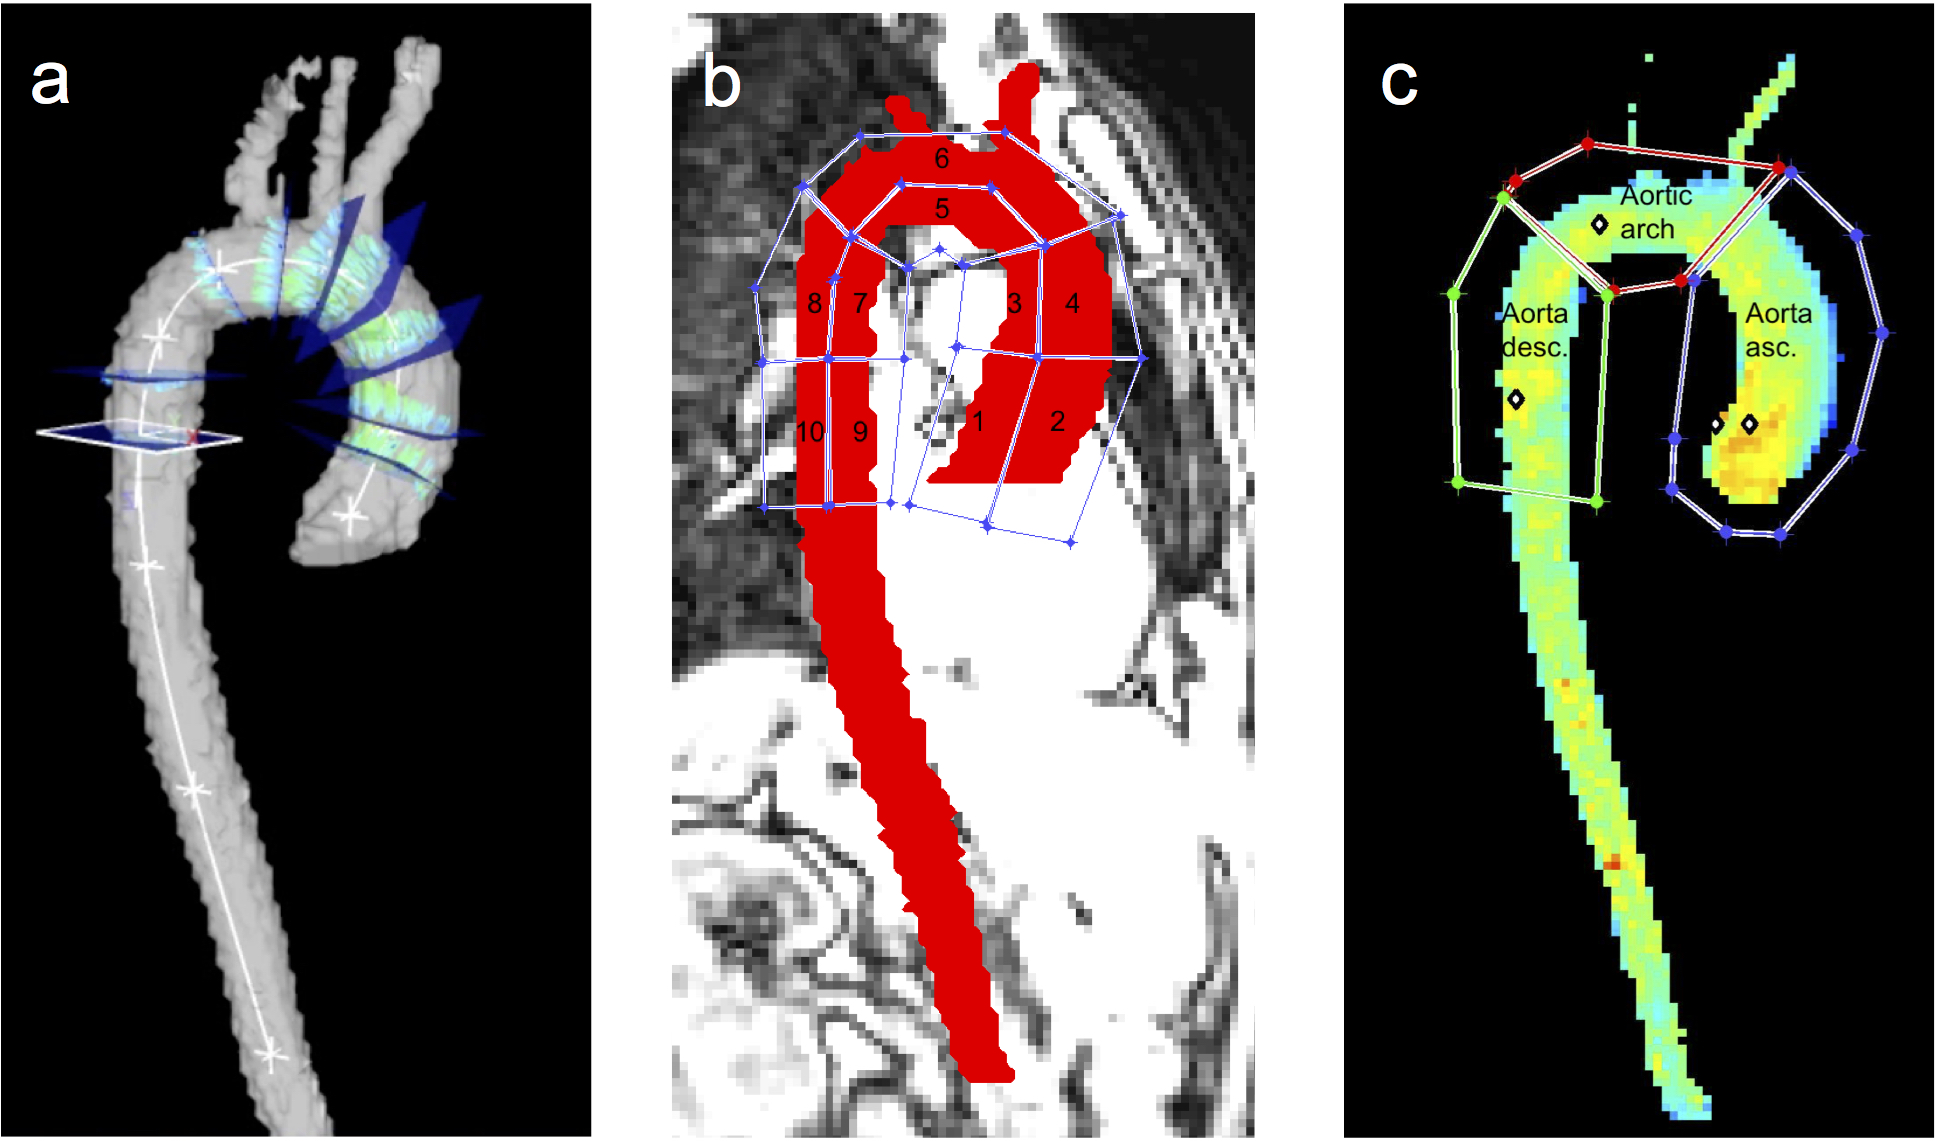
Figure 1 Visualization of the locations used for quantitative assessment in the thoracic aorta
a) Flow was evaluated in nine axial planes in the aorta
b) WSS was evaluated in ten aortic wall regions
c) Peak velocity was evaluated in the ascending aorta, the aortic arch and the descending aorta
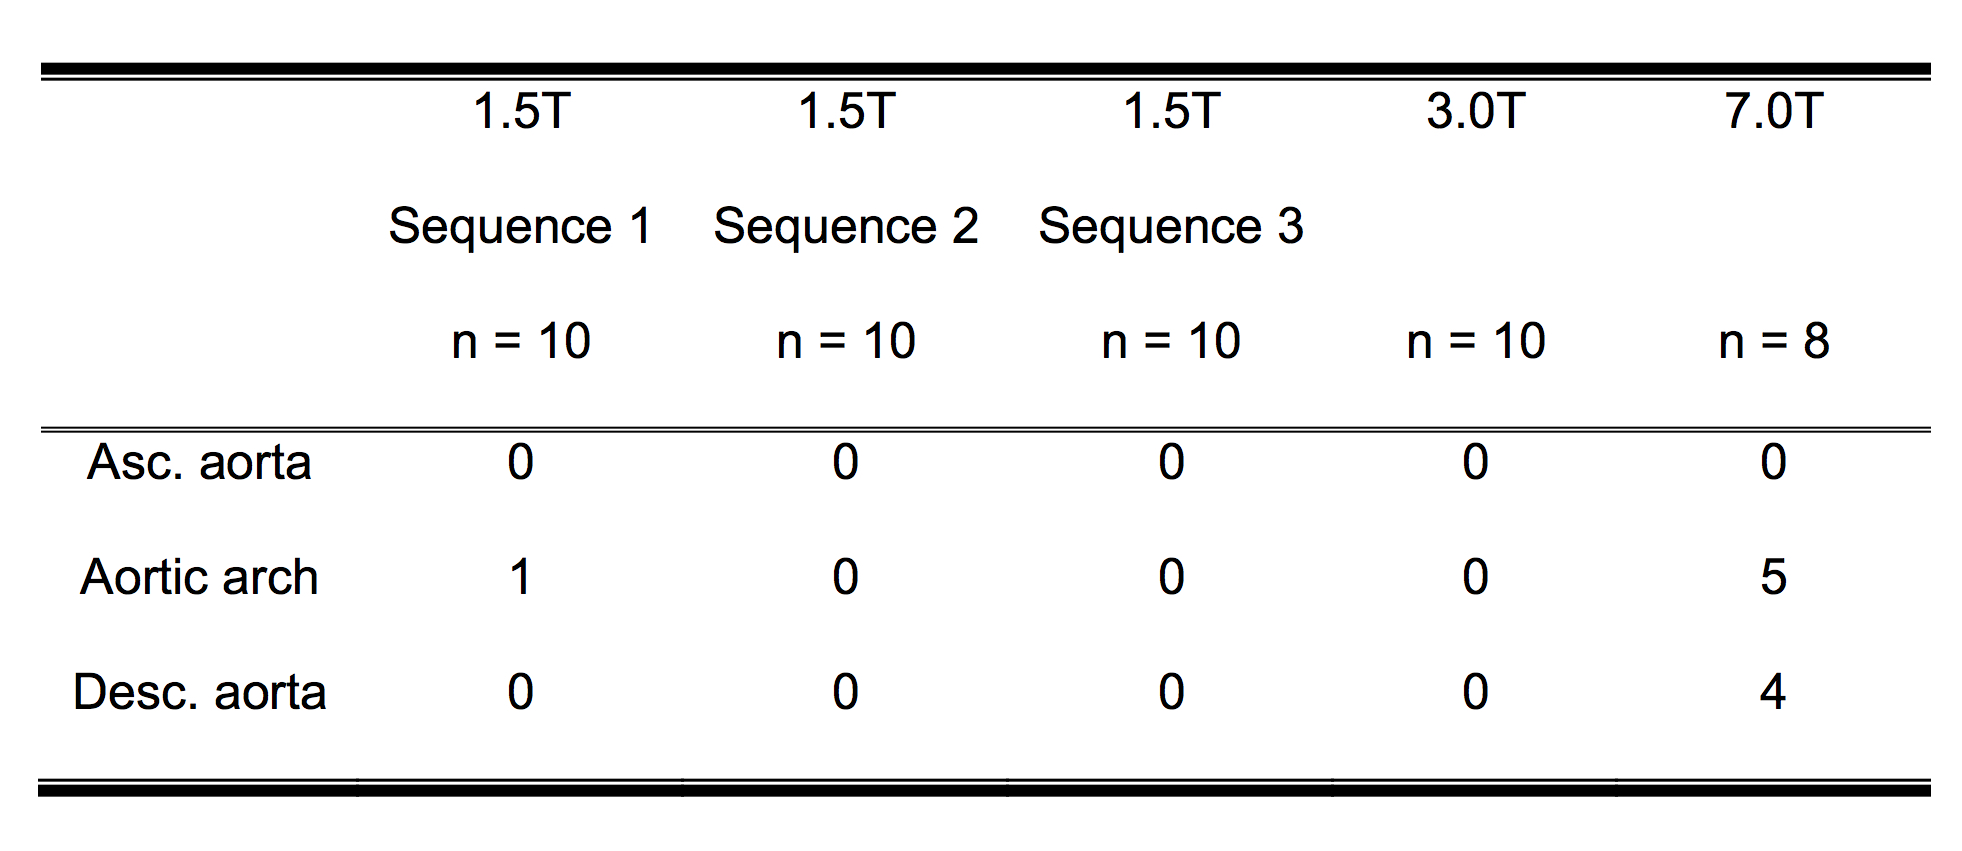
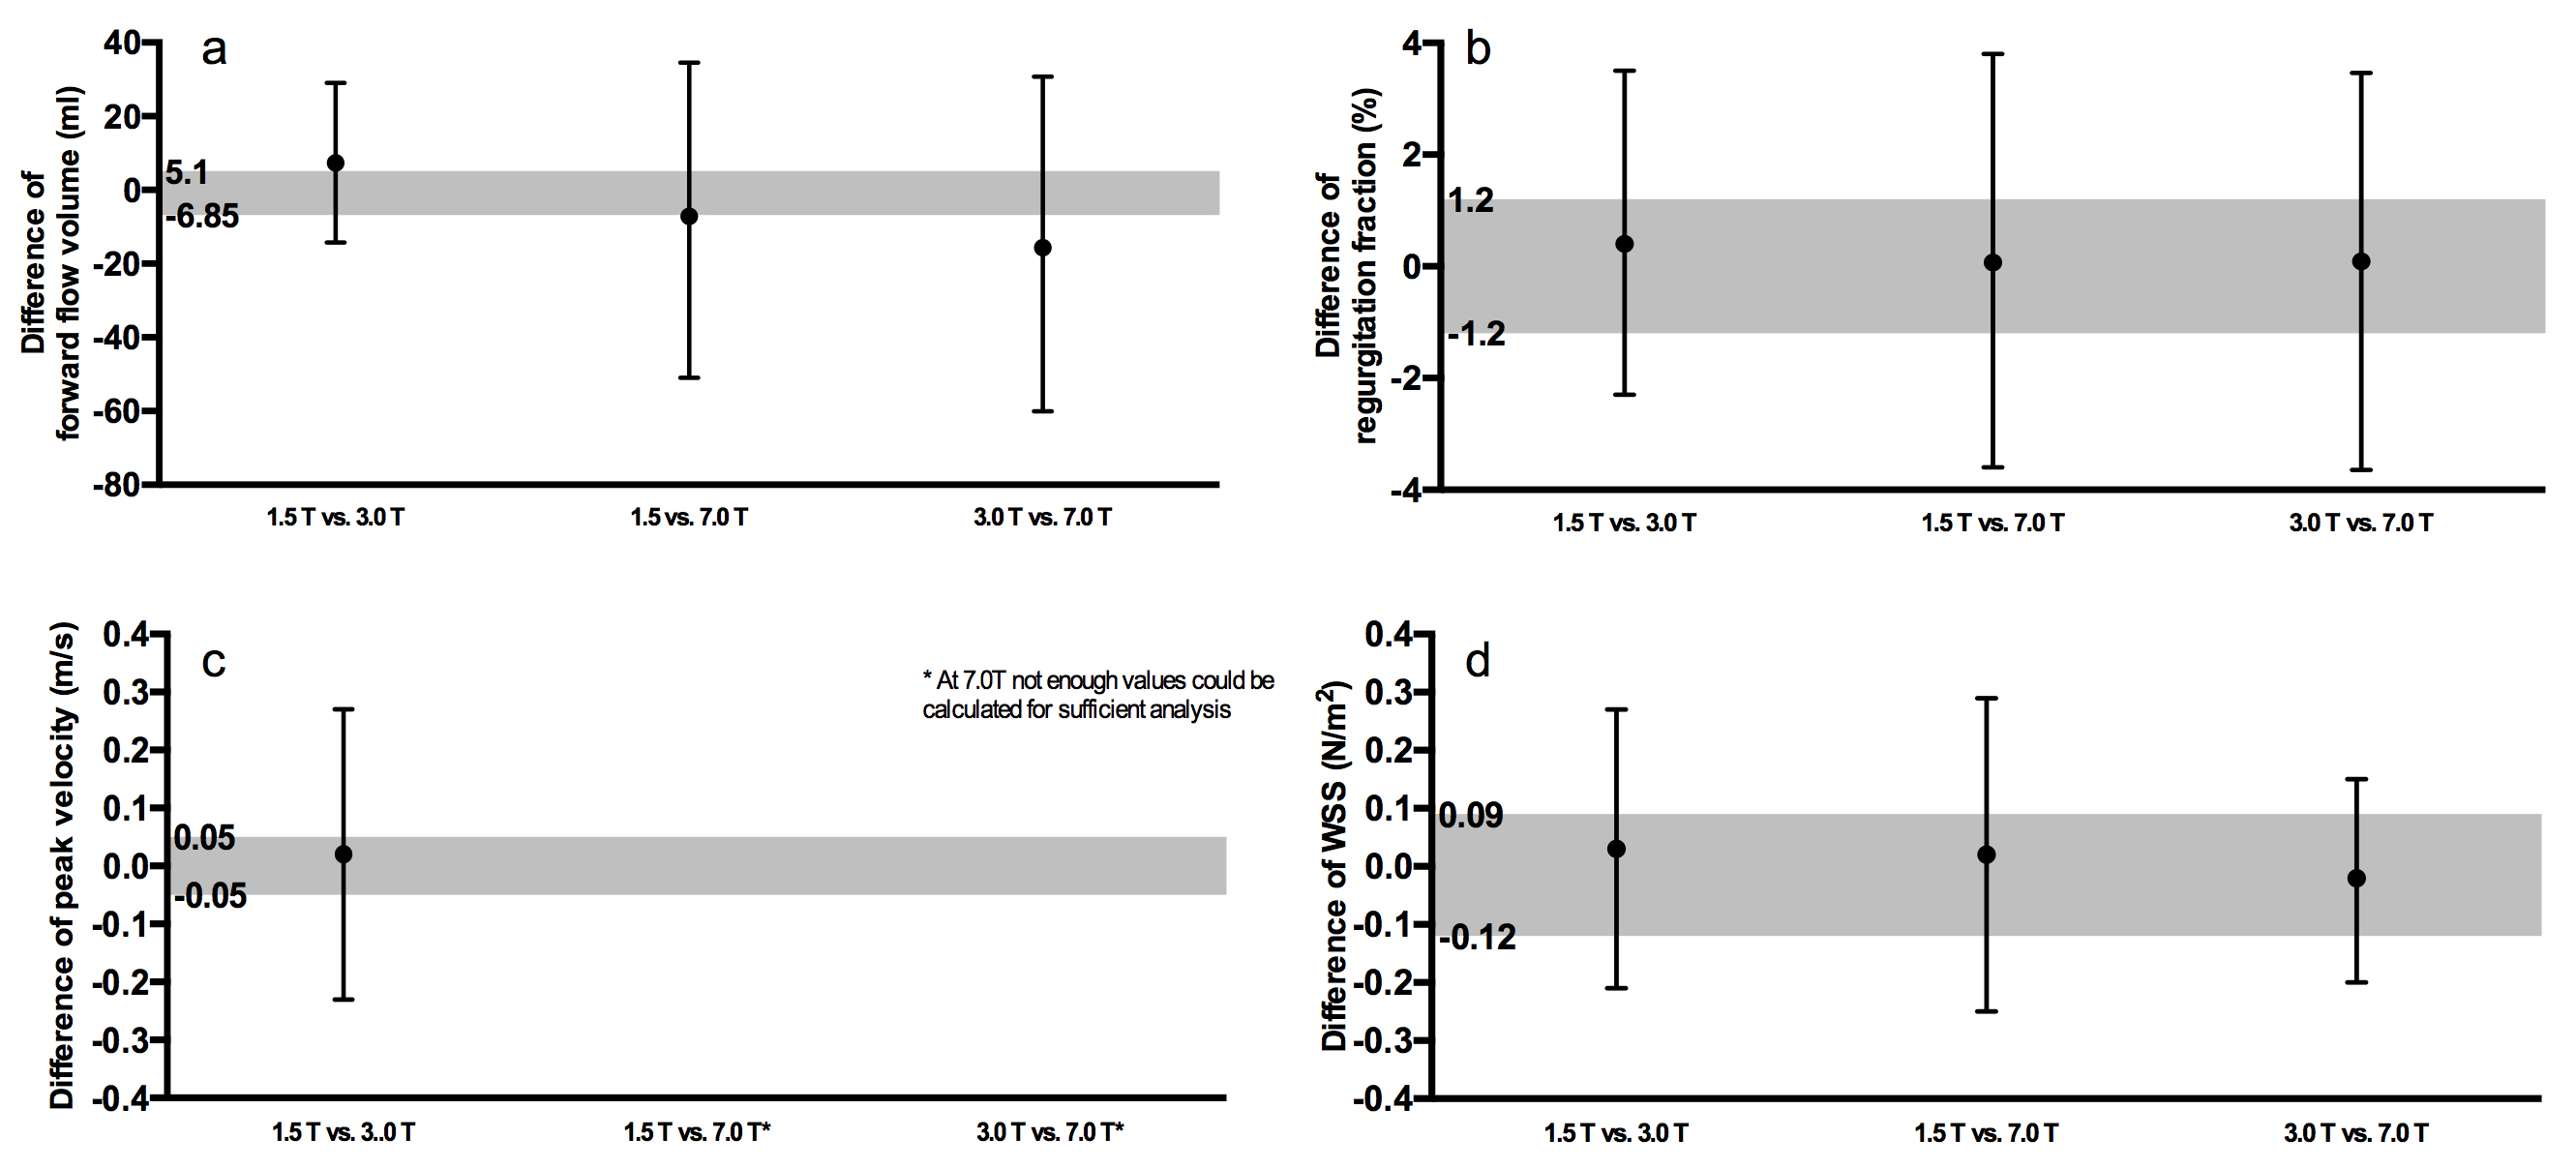
Figure 2 Influence of field strength on
a) forward flow
b) regurgitation fraction
c) peak velocity
d) WSS
The grey area displays the 95% CI of the Bland-Altman plot of the intra-rater analysis.
The black lines show the 95% CI of the Bland-Altman plot of the comparison of field strengths (black dot = mean value).
Non-equivalence between field strengths is shown as the 95% CI for field strength comparison (black lines) are larger than the range of accepted equivalence (grey area).
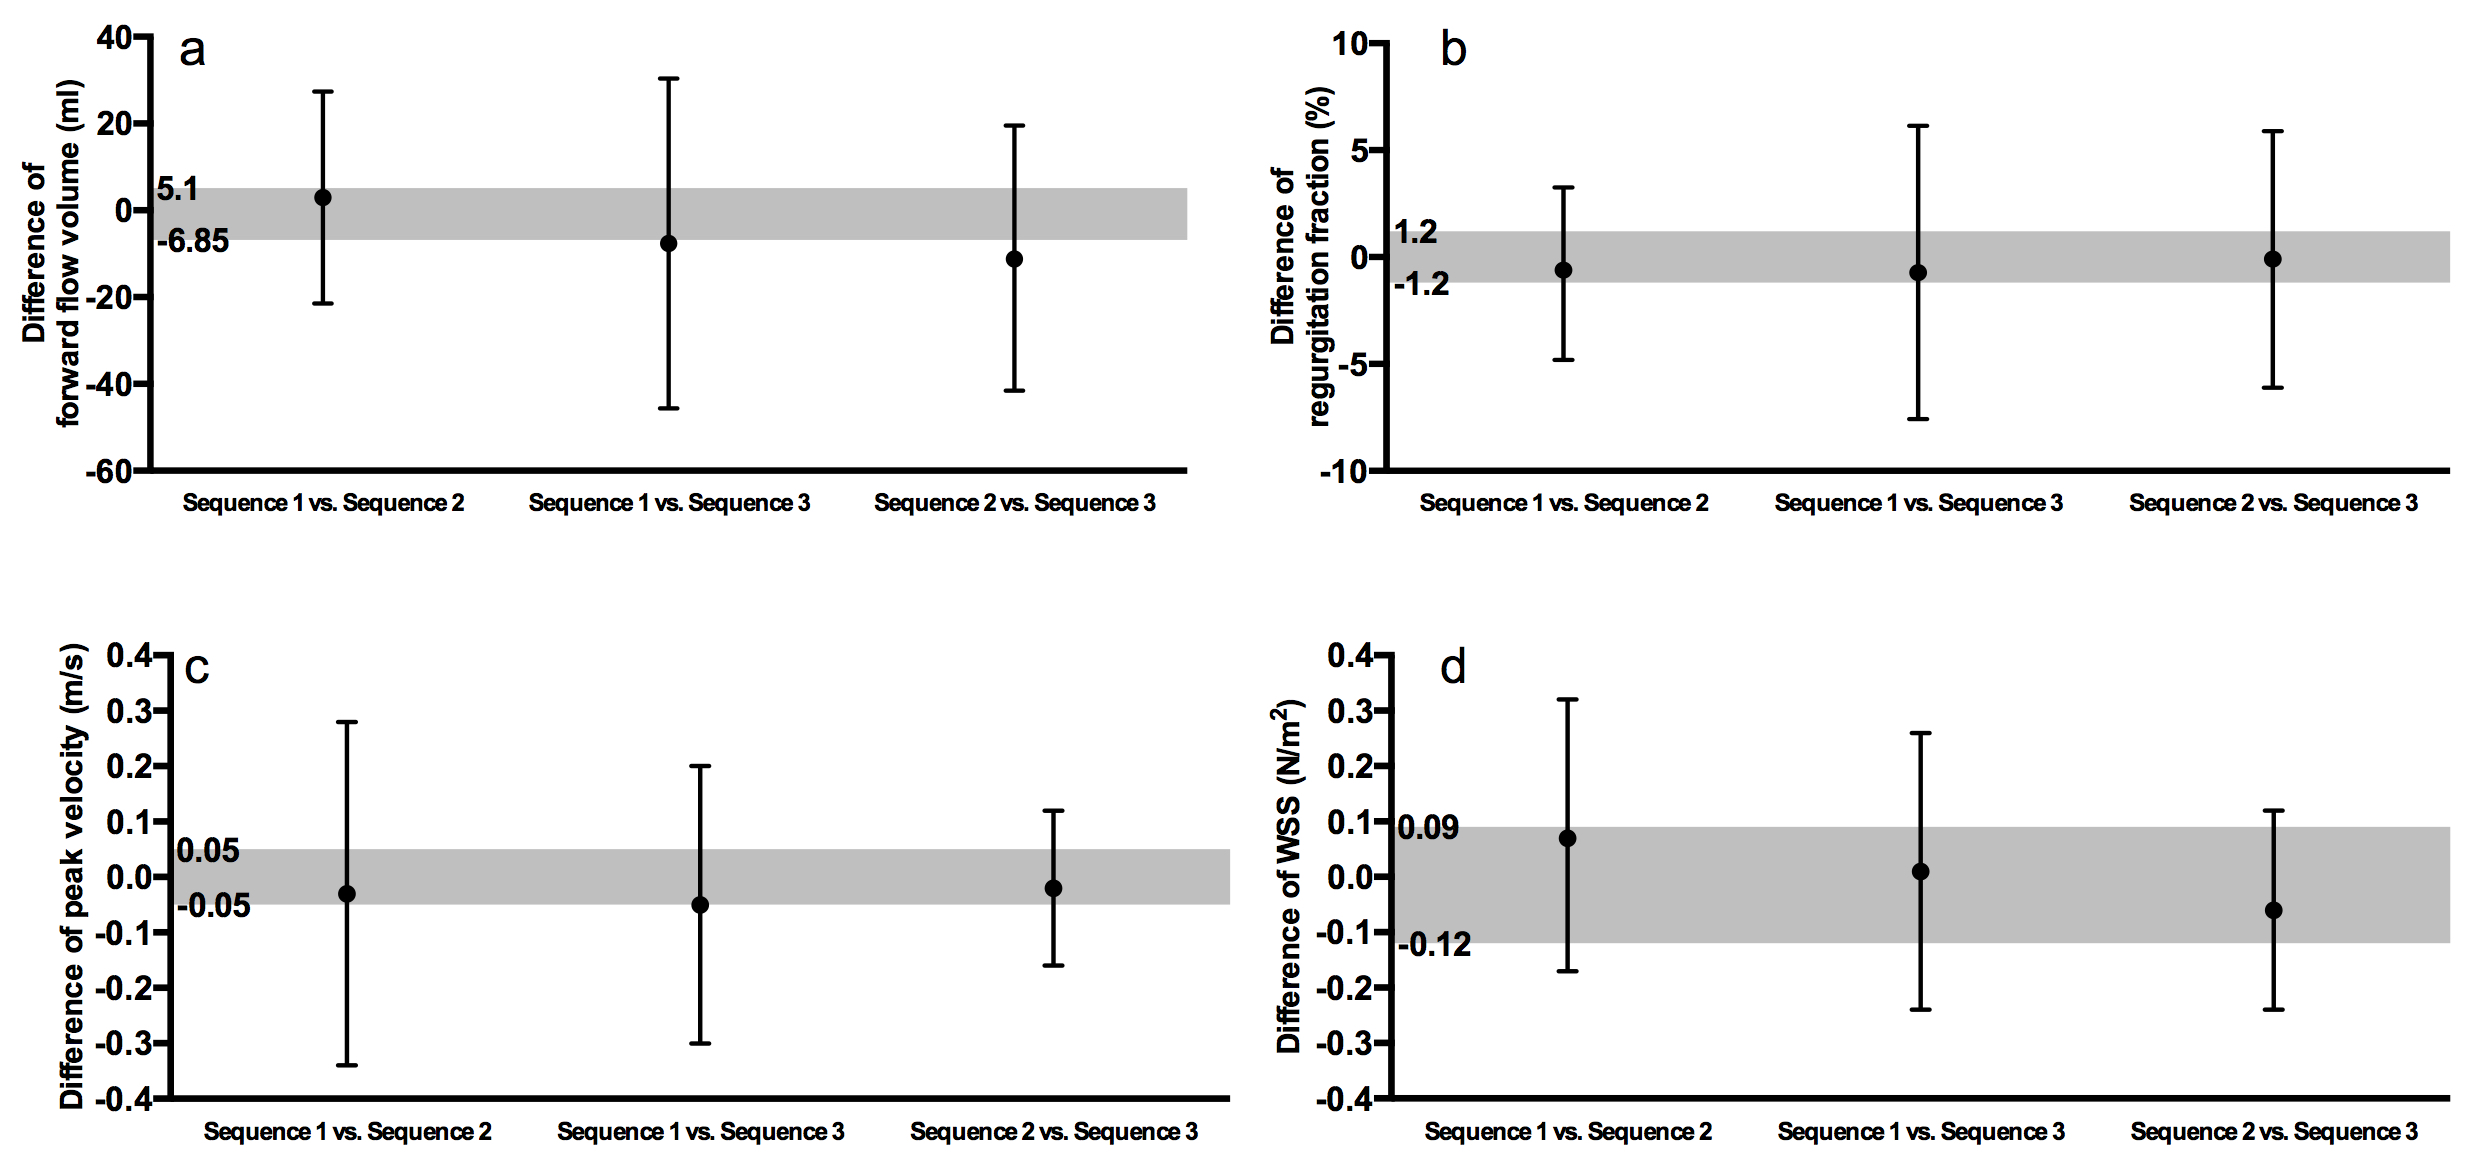
Figure 3 Influence of different sequences at 1.5T on
a) forward flow
b) regurgitation fraction
c) peak velocity
d) WSS
The grey area displays the 95% CI of the Bland-Altman plot of the intra-rater analysis.
The black lines show the 95% CI of the Bland-Altman plot of the comparison of sequences (black dot = mean value).
Non-equivalence between sequences is shown as 95% CI for sequence comparison (black lines) are larger than the range of accepted equivalence (grey area).