0004
Caval Blood Flow Distribution in Fontan Circulation: Comparison between ASL-Measured Pulmonary Perfusion and 4D Flow1Bioengineering, University of Texas at Dallas, Richardson, TX, United States, 2Radiology, UT Southwestern Medical Center, Dallas, TX, United States, 3Pediatrics, UT Southwestern Medical Center, Dallas, TX, United States, 4Advanced Imaging Research Center, UT Southwestern Medical Center, Dallas, TX, United States
Synopsis
Caval flow contribution to each lung is of interest in Fontan circulation due to the increased risk of developing pulmonary arteriovenous malformations when flow is unevenly distributed. Existing methods to assess this risk are invasive and require ionizing radiation, posing additional risks to pediatric patients during longitudinal monitoring. In this study, we demonstrate a non-invasive, non-ionizing assessment of the origin of pulmonary blood flow, as well as quantitative pulmonary perfusion using arterial spin labeled MR, and compare with the previously proposed 4D-flow measurement of caval flow distribution.
Introduction
In several congenital heart defects, the Fontan procedure is performed at an early age to direct venous blood from the superior and inferior venae cavae (SVC/IVC) to the left and right pulmonary arteries (LPA/RPA), bypassing the right heart. This junction of the SVC and IVC directly to the pulmonary arteries can lead to venous blood being unequally divided between the lungs, rather than being mixed in the right heart. Uneven distribution of venous blood from the IVC has been shown to play a role in the development of pulmonary arteriovenous malformations (PAVMs) in Fontan circulation, due to the exclusion of hepatic blood flow from the affected lungs1, 2. This preferential flow of hepatic blood from the IVC can be monitored using catheterization1, and abnormal lung perfusion has been reported in Fontan cases using scintigraphy2, but non-invasive and non-ionizing techniques would be beneficial for repeated evaluation in children. The purpose of this study was to investigate the use of two arterial spin labeled (ASL) MR techniques, FAIR3 and pCASL4 to quantify lung perfusion and assess the origin of pulmonary blood in Fontan patients, and compare the differential flow measurements with 4D-flow.Methods
19 patients with Fontan circulation (age 15.2 ± 2.4 years, 14 male) were scanned with both ASL and 4D-Flow on a 1.5T Philips Ingenia between December 2016 and July 2017, with IRB approval and informed assent.
ASL-MRI:
FAIR perfusion signal is generated using a non-selective inversion to invert inflowing blood from outside of the imaging region, and therefore does not discriminate based on the source vessel of inflowing blood, thus measuring total lung perfusion. pCASL uses a labeling plane to invert blood in a vessel of interest, resulting in a perfusion image containing only blood originating from the labeled vessel. By labeling the IVC, lung perfusion images can be generated with only IVC blood5, allowing for the IVC contribution to each lung to be measured. Both FAIR and pCASL used a coronal 2D-SShTSE, four background suppression pulses, and multiple signal averages over 2-3 minutes of guided breathing to improve SNR and reduce motion artifacts. A proton-density image was also acquired for quantification.
FAIR images contained characteristic bright signal in the pulmonary vasculature, representing a pooled volume of blood, rather than tissue perfusion. Lung perfusion was analyzed after masking these bright vessels to measure the underlying true tissue perfusion. The vessel mask was generated automatically for each patient by fitting the lung perfusion histogram to a lognormal distribution6 and setting the perfusion threshold to the distribution mean + 0.25*SD.
4D-Flow:
4D-flow images were acquired over 10-15 minutes, with velocity encoding of 150 cm/s, and were analyzed using GTFlow to quantify differential IVC flow7. Particle pathlines were generated from the IVC, and differential flow was calculated from the percentage of these particles reaching the LPA and RPA. 4D-flow analysis was unsuccessful in four subjects due to artifacts near the IVC-PA junction caused by metal stents or fenestration closure devices. Statistics were calculated for the remaining 15 subjects.
Results
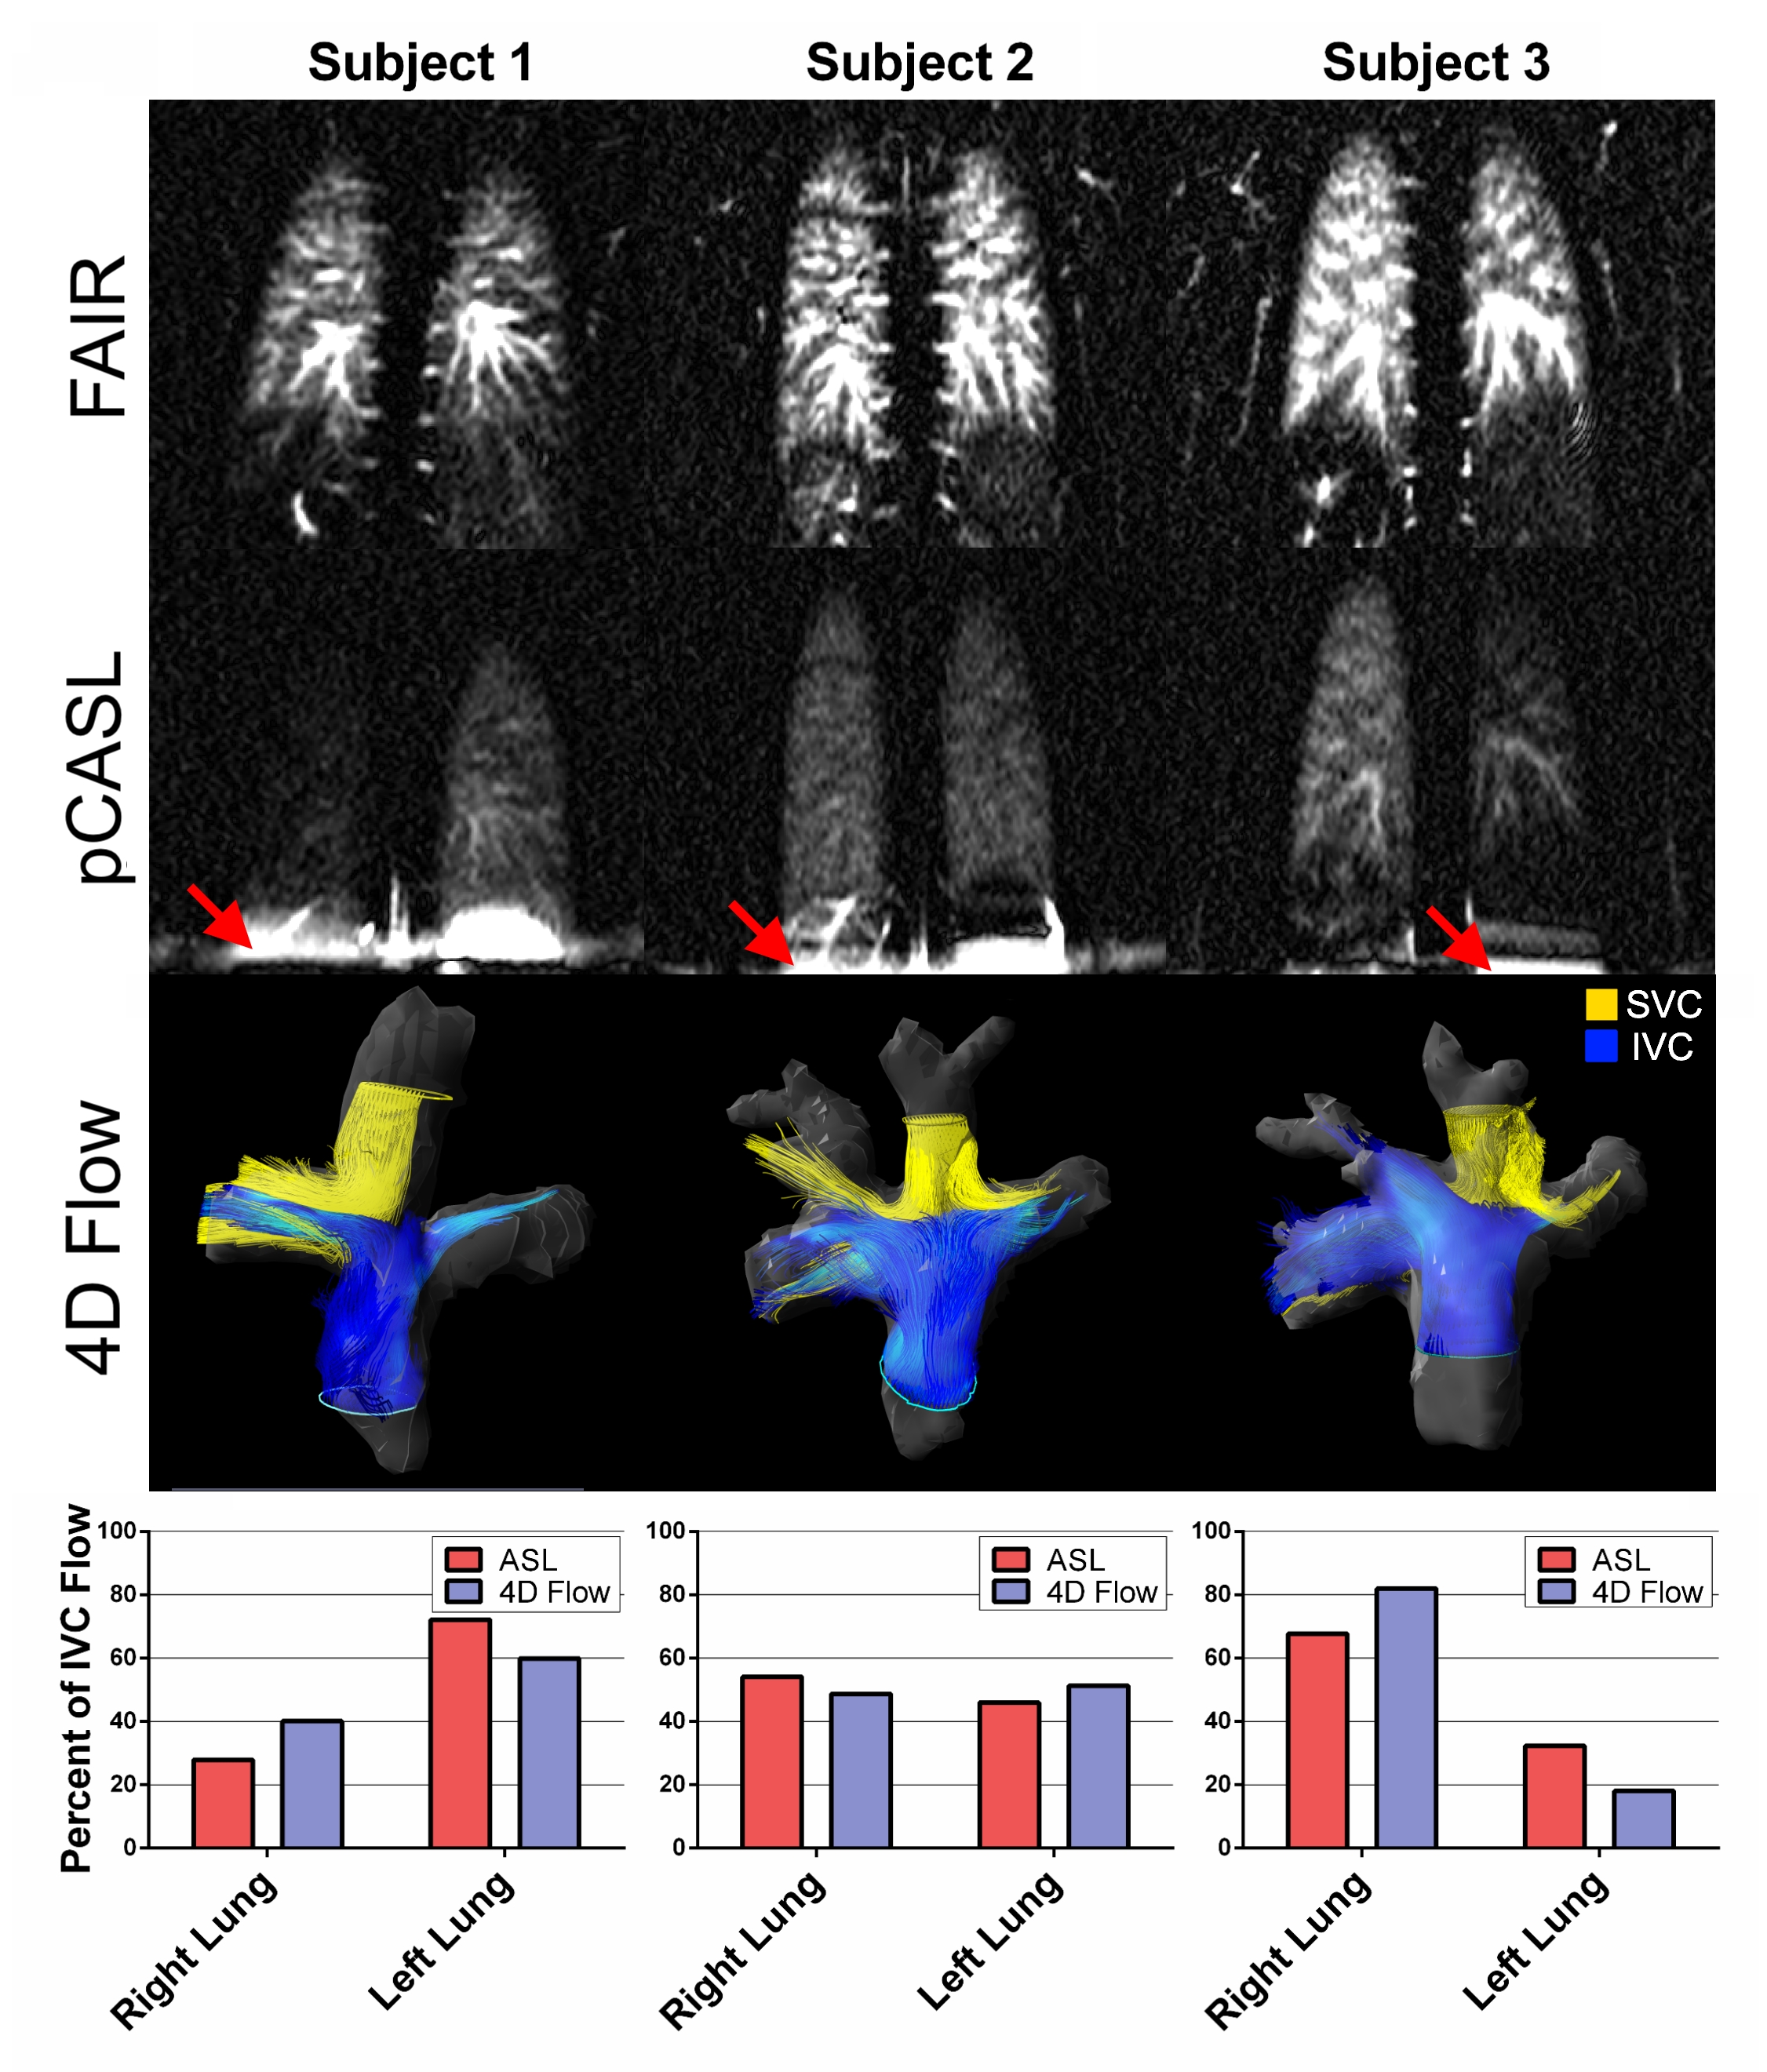
Fig.1 shows coronal FAIR perfusion images, showing total lung perfusion, and pCASL perfusion images, showing only IVC contribution to the lungs. pCASL perfusion images showed good agreement with 4D-flow pathlines from the IVC in three representative subjects.
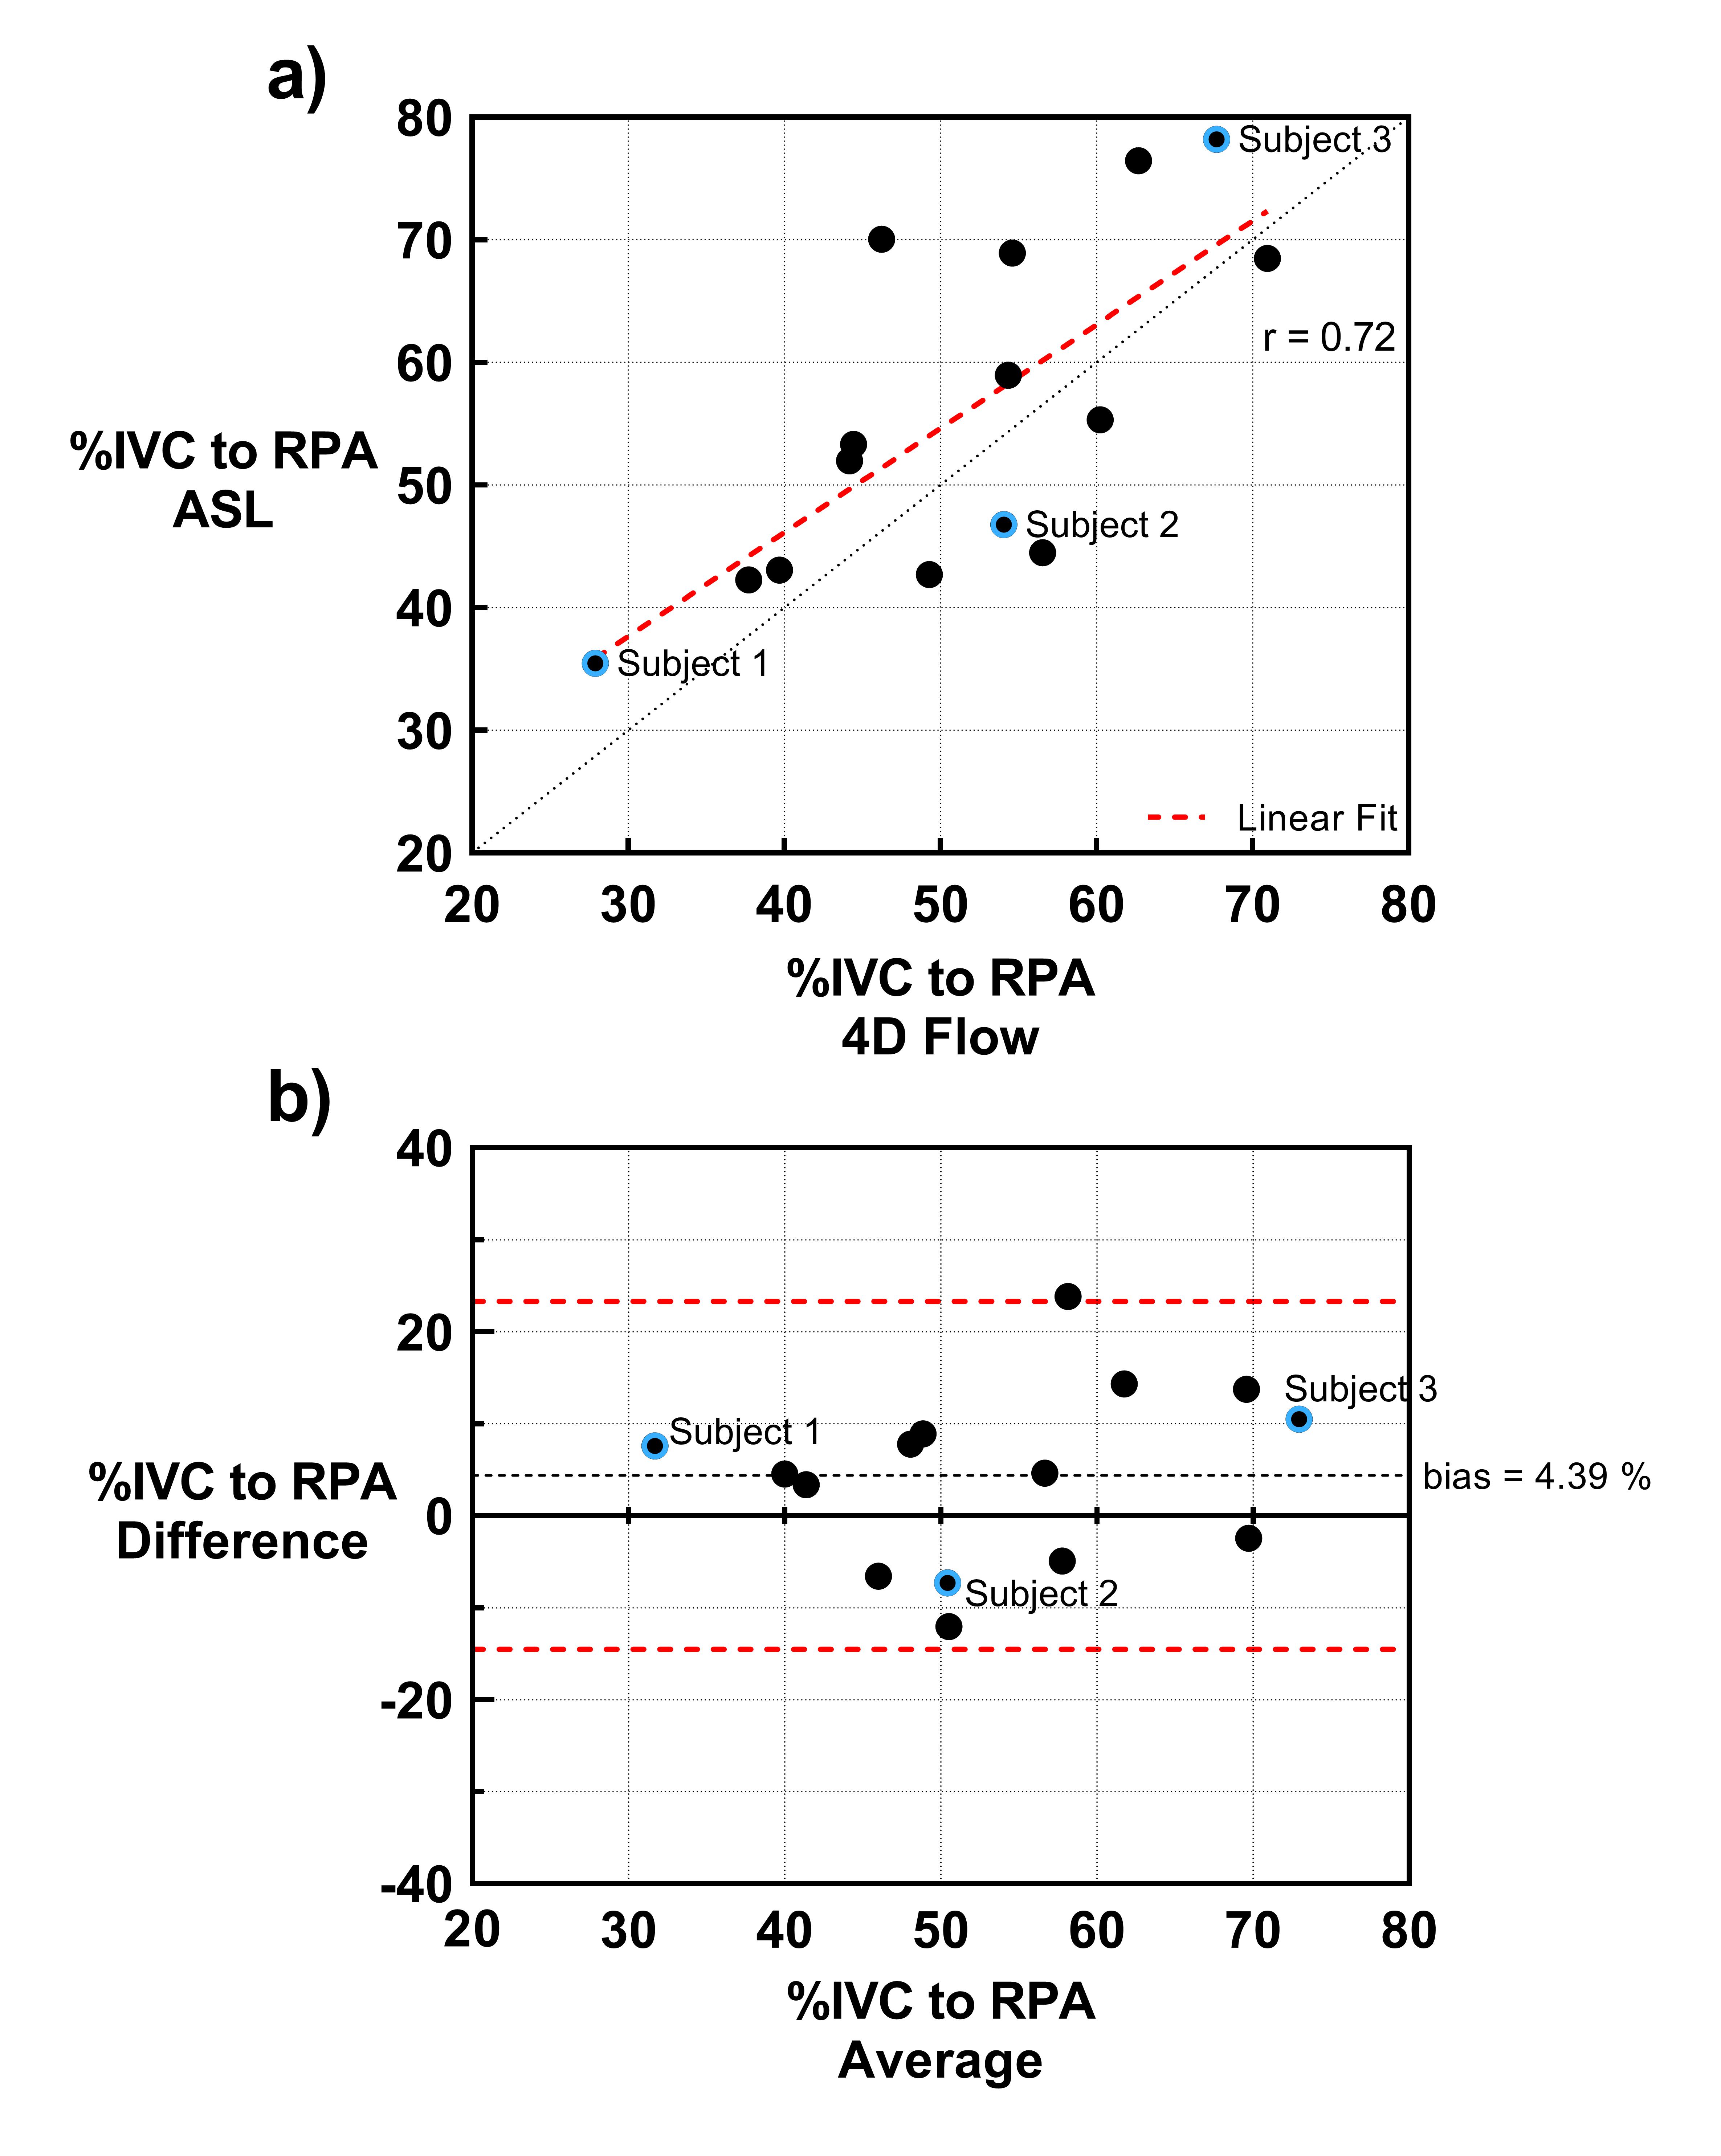
The mean percentage of IVC flow to the right lung across all subjects using ASL and 4D-Flow was 52% and 56%, respectively, and ranged from 28-71% with ASL and 36-78% with 4D-Flow. Fig. 2a shows good agreement between the two techniques with a Pearson correlation coefficient of 0.72 (p< 0.01), and Bland Altman analysis in Fig. 2b shows a relatively low bias of 4.39% between the two techniques. Mean total lung perfusion (measured with FAIR) across all subjects was 469 ± 198 mL/100g/min, within the accepted normal range3.
Discussion and Conclusion
ASL can be used to simultaneously assess pulmonary perfusion and differential flow from the IVC. Since the venous blood bypassed the right heart, cardiac triggering was not used in the current study. However, future studies with cardiac triggering could likely improve ASL measurements by reducing signal variations from the cardiac cycle. Future improvements will also consider 3D acquisitions to measure the true total lung perfusion, rather than a single slice, and the reduction of bright pulmonary vessels during acquisition using inflow saturation pulses8. Nevertheless, since this technique is non-invasive and non-ionizing, it can be used with no additional risk to pediatric patients, allowing for a repeatable cardiopulmonary MR examination to evaluate the risk for PAVMs, and to evaluate Fontan revisions without the need for catheterization or contrast-based scans.Acknowledgements
No acknowledgement found.References
1. Imoto Y, Sese A, Joh K. Redirection of the hepatic venous flow for the treatment of pulmonary arteriovenous malformations after Fontan operation. Pediatric cardiology. 2006;27(4):490-492.
2. Cloutier A, Ash JM, Smallhorn JF, et al. Abnormal distribution of pulmonary blood flow after the Glenn shunt or Fontan procedure: risk of development of arteriovenous fistulae. Circulation. 1985;72(3):471-479.
3. Bolar DS, Levin DL, Hopkins SR, et al. Quantification of regional pulmonary blood flow using ASL-FAIRER. Magn Reson Med. 2006;55(6):1308-1317.
4. Dai W, Garcia D, de Bazelaire C, Alsop DC. Continuous flow-driven inversion for arterial spin labeling using pulsed radio frequency and gradient fields. Magn Reson Med. 2008;60(6):1488-1497.
5. Joshua S. Greer, Yue Zhang, Ivan Pedrosa, Madhuranthakam AJ. Non-Contrast Pulmonary Perfusion using pseudo-Continuous Arterial Spin Labeling of the Inferior Vena Cava. International Society for Magnetic Resonance in Medicine. 2015; Toronto.
6. Henderson AC, Prisk GK, Levin DL, Hopkins SR, Buxton RB. Characterizing pulmonary blood flow distribution measured using arterial spin labeling. NMR Biomed. 2009;22(10):1025-1035.
7. Bächler P, Valverde I, Pinochet N, et al. Caval blood flow distribution in patients with Fontan circulation: quantification by using particle traces from 4D flow MR imaging. Radiology. 2013;267(1):67-75.
8. Joshua S. Greer, Yue Zhang, Christopher Maroules, Orhan K. Oz, Ivan Pedrosa, Madhuranthakam AJ. Non-contrast Pulmonary Perfusion at 3T using FAIR with inflow saturation and background suppression. International Society for Magnetic Resonance in Medicine. 2016; Singapore.
Figures