0003
3D Hemodynamics Characterization in Patients with Hypercholesterolemia using 4D Flow data and a Finite Element Method.1Biomedical Imaging Center, Pontificia Universidad Católica de Chile, Santiago, Chile, 2Department of Electrical Engineering, Pontificia Universidad Católica de Chile, Santiago, Chile, 3Department of Radiology and Biomedical Engineering, University of Texas Southwestern, Dallas, TX, United States, 4Institute for Biological and Medical Engineering, Schools of Engineering, Medicine and Biological Sciences, Pontificia Universidad Católica de Chile, Santiago, Chile, 5Department of Structural and Geotechnical Engineering, Pontificia Universidad Católica de Chile, Santiago, Chile, 6Department of Radiology, School of Medicine, Pontificia Universidad Católica de Chile, Santiago, Chile
Synopsis
Familial hypercholesterolemia (FH) is an autosomal dominant disorder of lipoprotein metabolism, that are associated with premature atherosclerosis, early-onset of cardiovascular disease (CVD) with an elevated mortality. It would be prudent to develop and investigate imaging-based hemodynamics biomarkers that assist in cardiovascular risk assessment of FH patients. In this work, we obtain several hemodynamics parameters in HP patients using a single methodology, which is based on the analysis of 4D flow data using a finite element method. We found distinctive biomarkers as WSS (magnitude, axial, circumferential) and Kinetic Energy those present more significant differences along the entire aorta.
Introduction
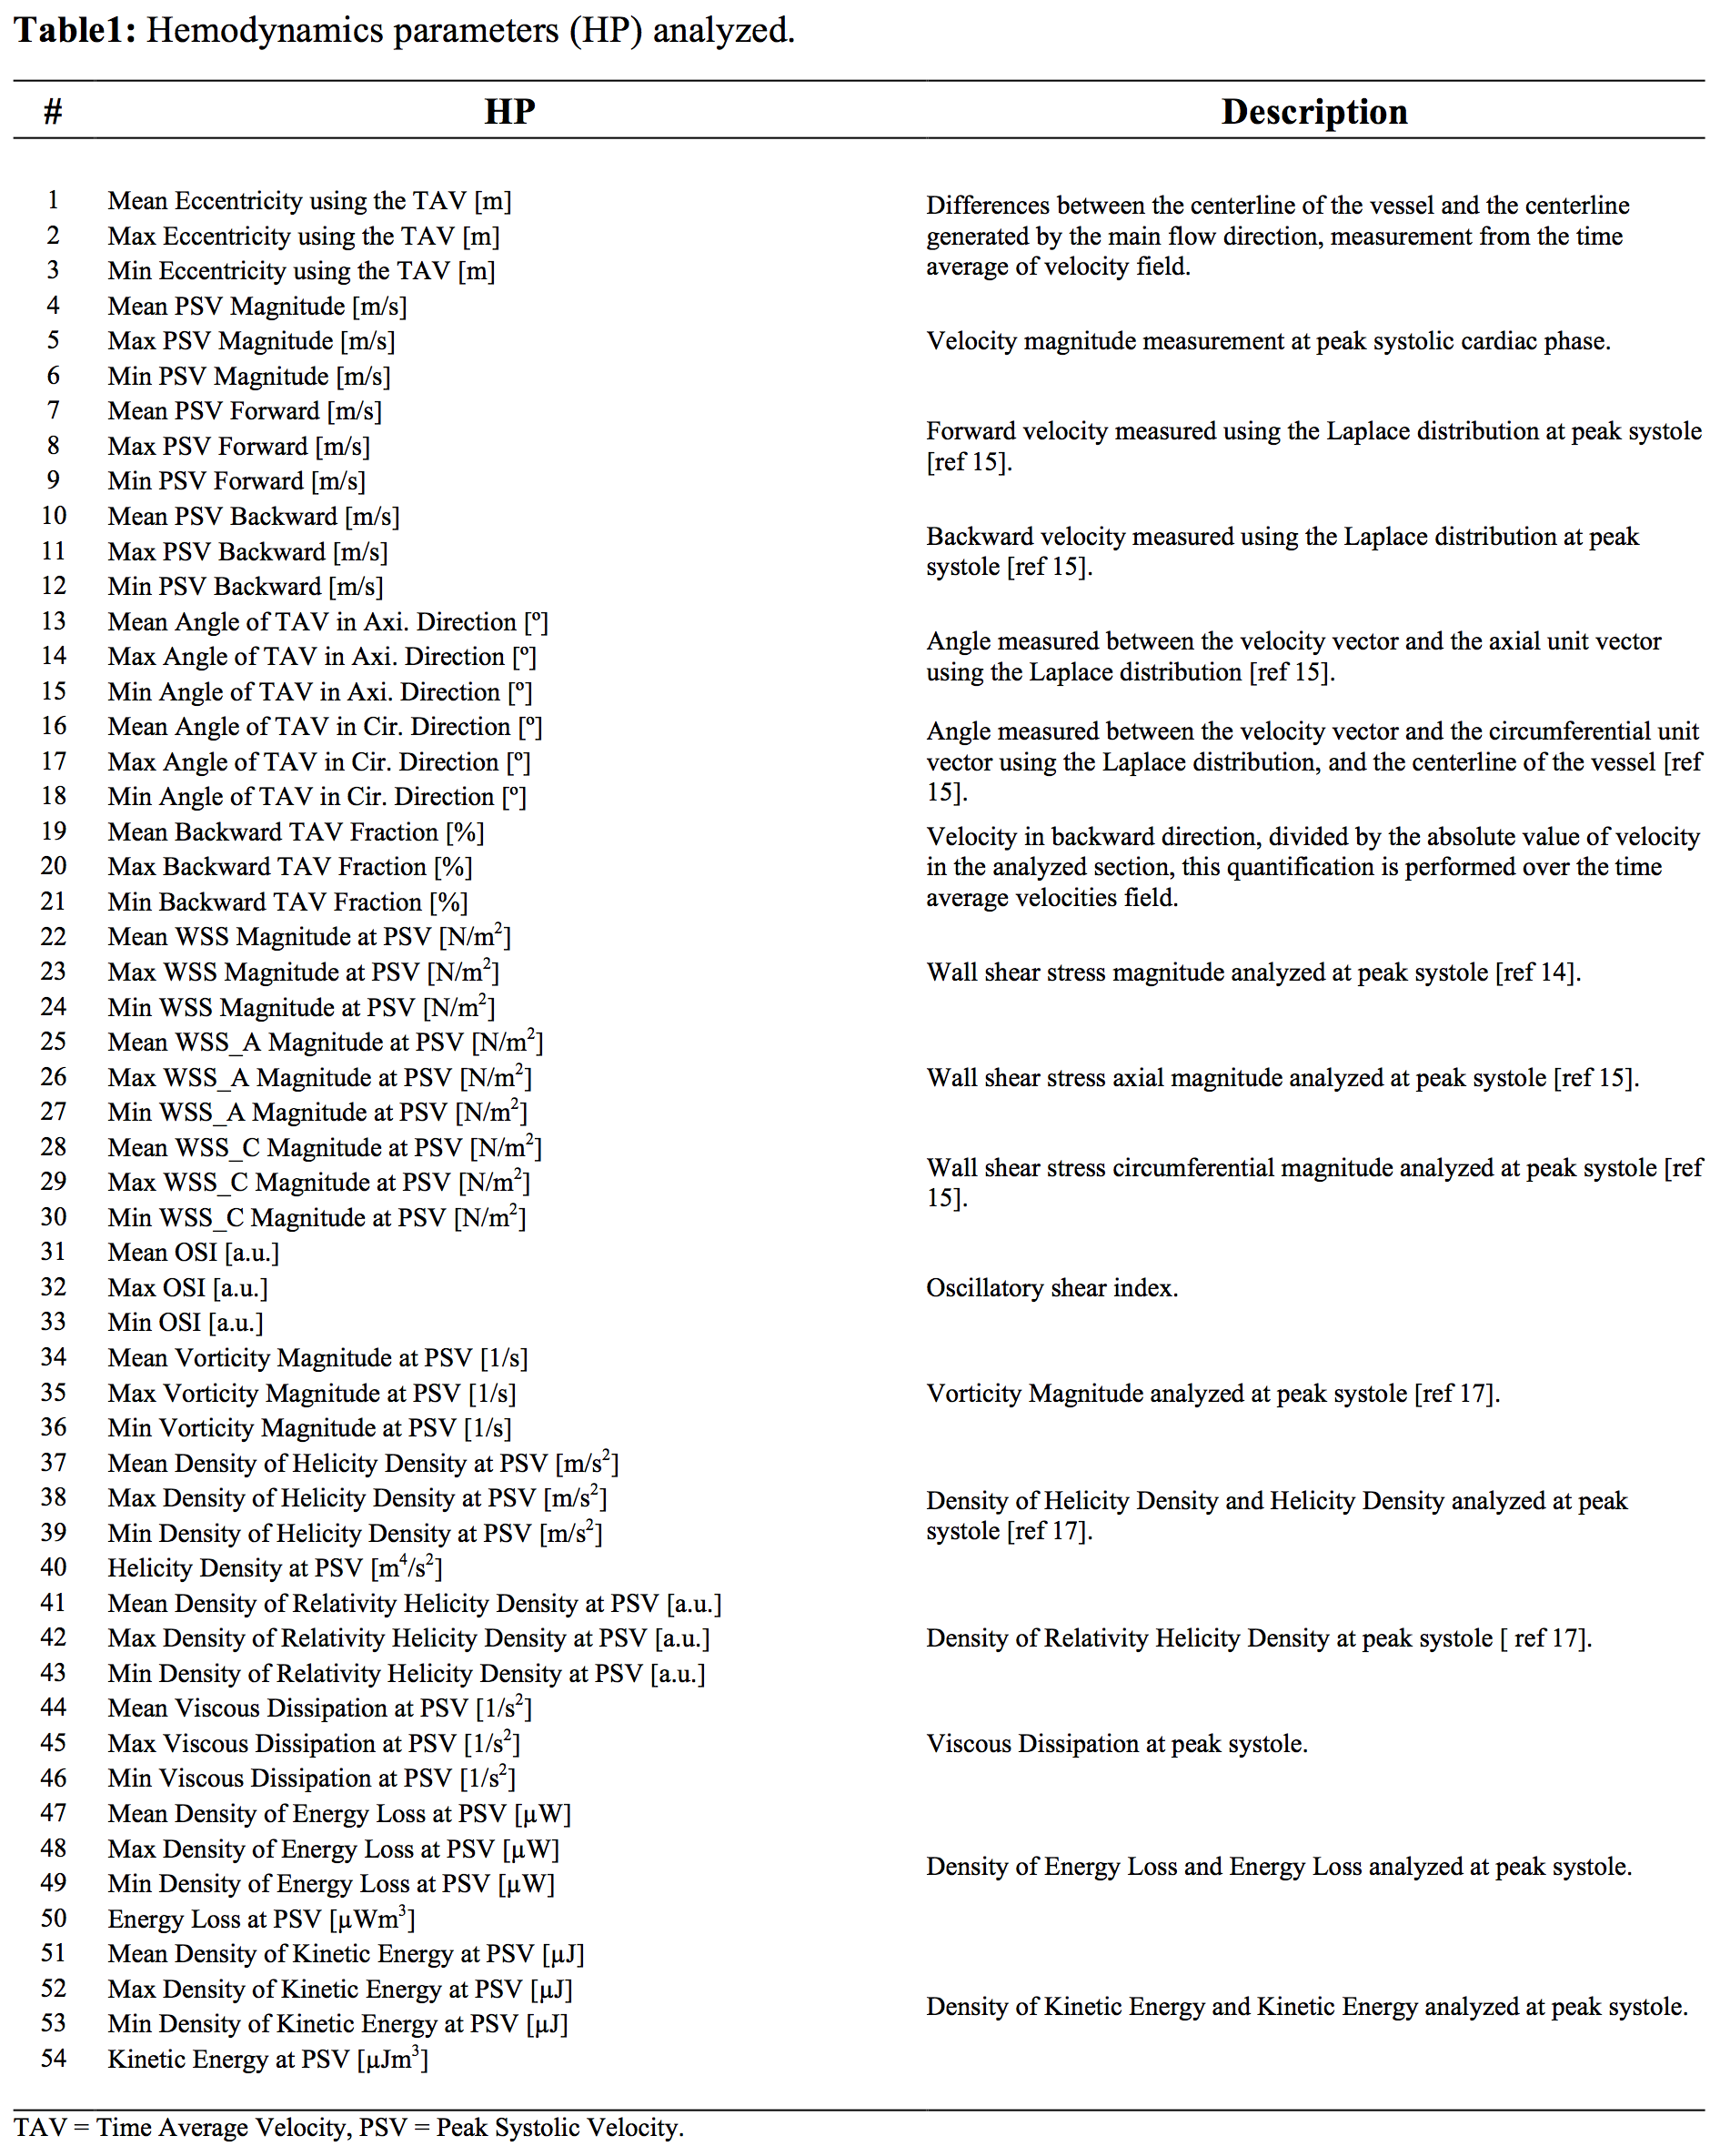
Familial hypercholesterolemia (FH) is an autosomal dominant disorder of lipoprotein metabolism, more specific the mutations in the genes encoding for the low-density lipoprotein receptor (LDLR)1. Elevated levels of LDL cholesterol (LDLC) are associated with premature atherosclerosis, early-onset of cardiovascular disease (CVD) with an elevated mortality2. Some studies have been demonstrated that the FH is related with hypertension, structural changes of the aorta and the increment of the arterial stiffness3-6. A few number of MRI-based biomarkers of atherosclerosis-hypercholesterolemia have been explored, including wall shear stress (WSS) and pulse wave velocity (PWV)7-8. It is known that the abnormal blood flow patterns affect the WSS quantification, leading to dysfunction of the endothelium9. Other MRI-based hemodynamics biomarkers as oscillatory shear index (OSI), vorticity, helicity density, viscous dissipation, energy loss and kinetic energy have not been studied in this type of patients. The objective of this work is to show the applicability of a recently proposed method to obtain several hemodynamics parameters in FH patients using a single methodology, which is based on the analysis of 4D flow data using a finite element method.Methods
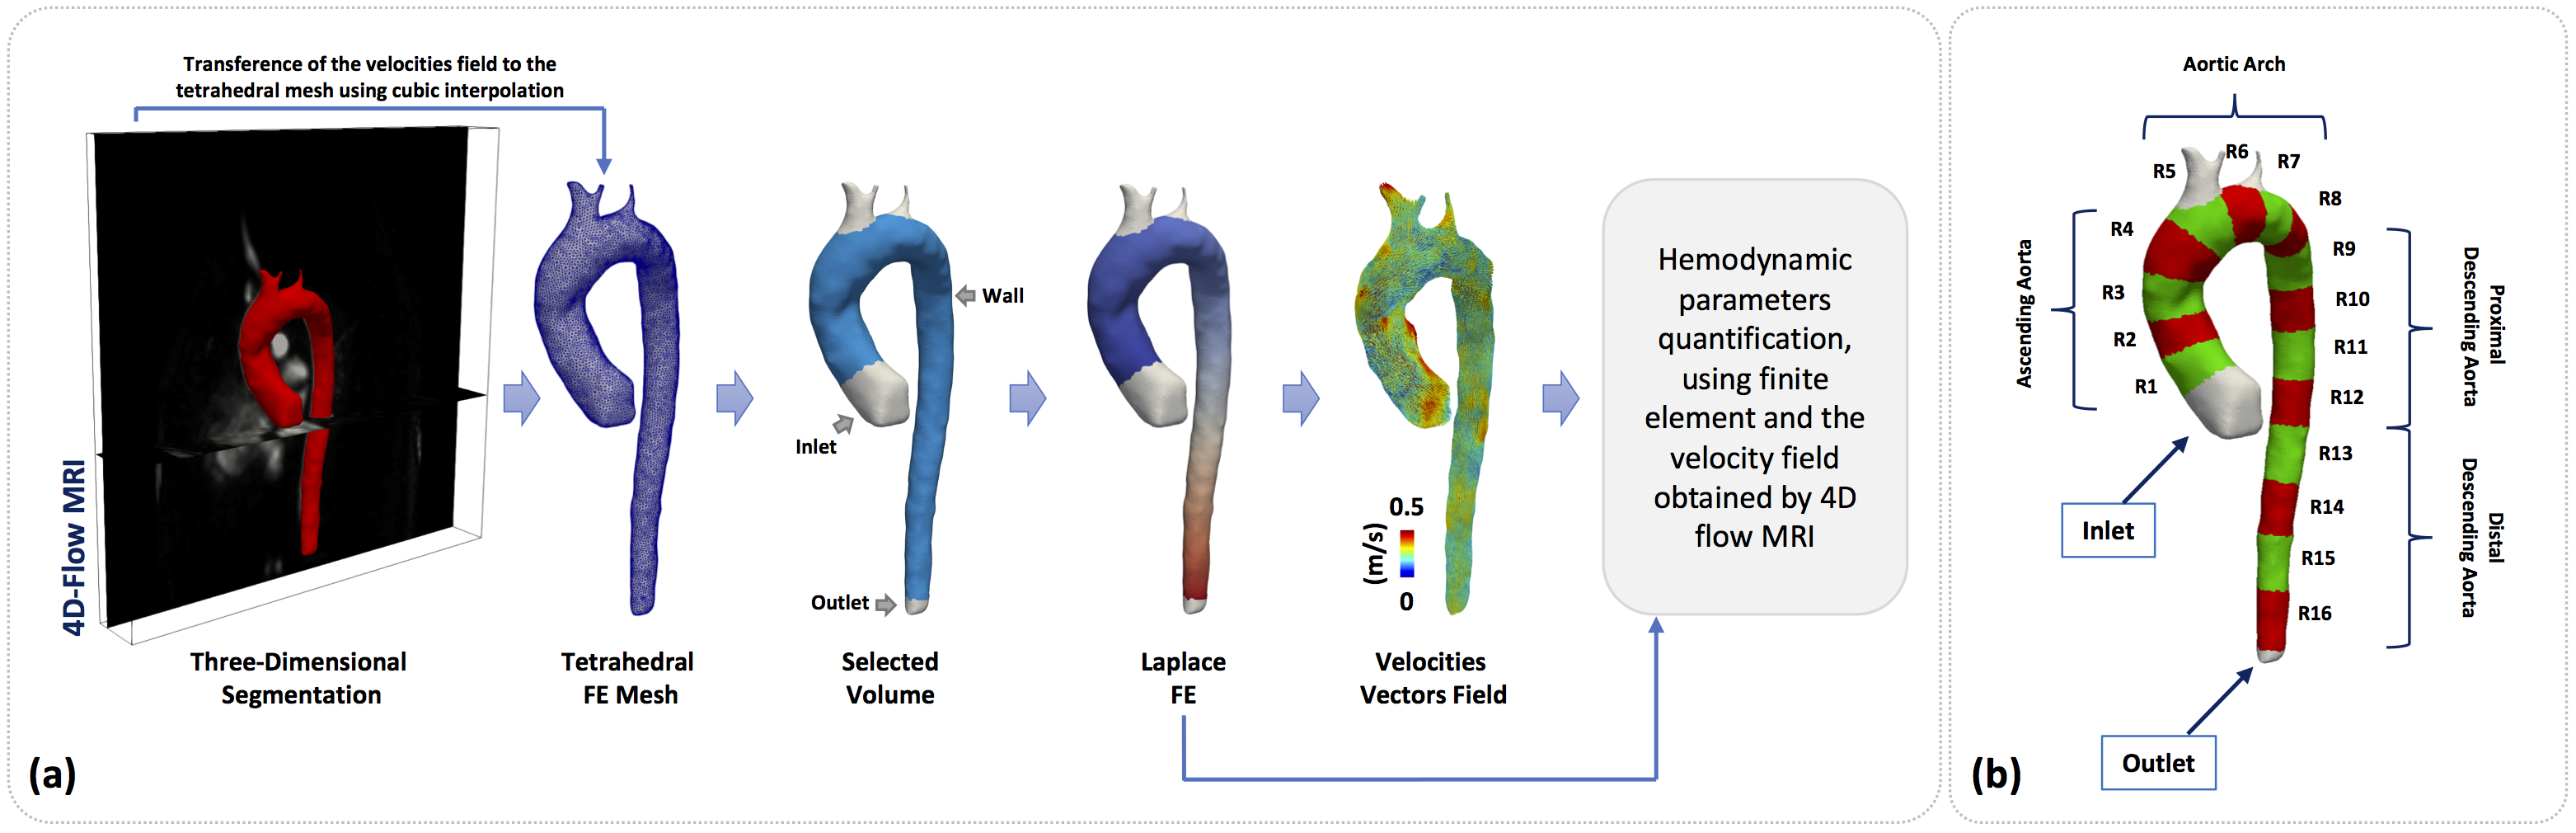
We obtained the velocity gradient from 4D-flow using a finite-element least-squares projection method previously published10,11 in three orthogonal directions, generating continuous 3D maps of different HP described, see Figure1. A total of 18 healthy volunteers (13 male, age 30.4±6.2 years) and 28 FH patients (11 male, age 14.6±3.3 years) were included in the study. The 4D-flow data of volunteers was acquired in 3T Philips Achieva Scanner, and the FH patient data was acquired in 1.5T Philips Ingenia Scanner (Philips Healthcare, Best The Netherlands). Cardiac and self-respiratory gating were used to prevent image displacement. The sequence is performed with a 3D fast field echo phase-contrast during free breathing and retrospective cardiac gating (25 time frames)12. The process for creating the tetrahedral mesh is summarized in Figure2a and was performed in Matlab (The MathWorks, Natick, MA, USA) using the iso2mesh toolbox. Our finite element algorithm is programmed in the software Python (PSF, Wolfeboro Falls, USA) and for visualization we used the software Paraview (Kitware Inc., NY, USA). Sixteen different regions were analyzed for each volunteer and FH patient, see Figure2b. In all these regions, we analyzed the HP described in Figure1. The normal distribution of the data was studied using the Lilliefors test. Results between patients and volunteers were compared using a t-student test for normally-distributed data, and a wilcoxon test for data with non-normal distributions. Also, we generated a correlation matrix between all the HP calculated in the ascending aorta (AAo), aortic arch (AArch), proximal descending aorta (pDAo) and distal descending aorta (dDAo), for the group of volunteers and FH patients.Results
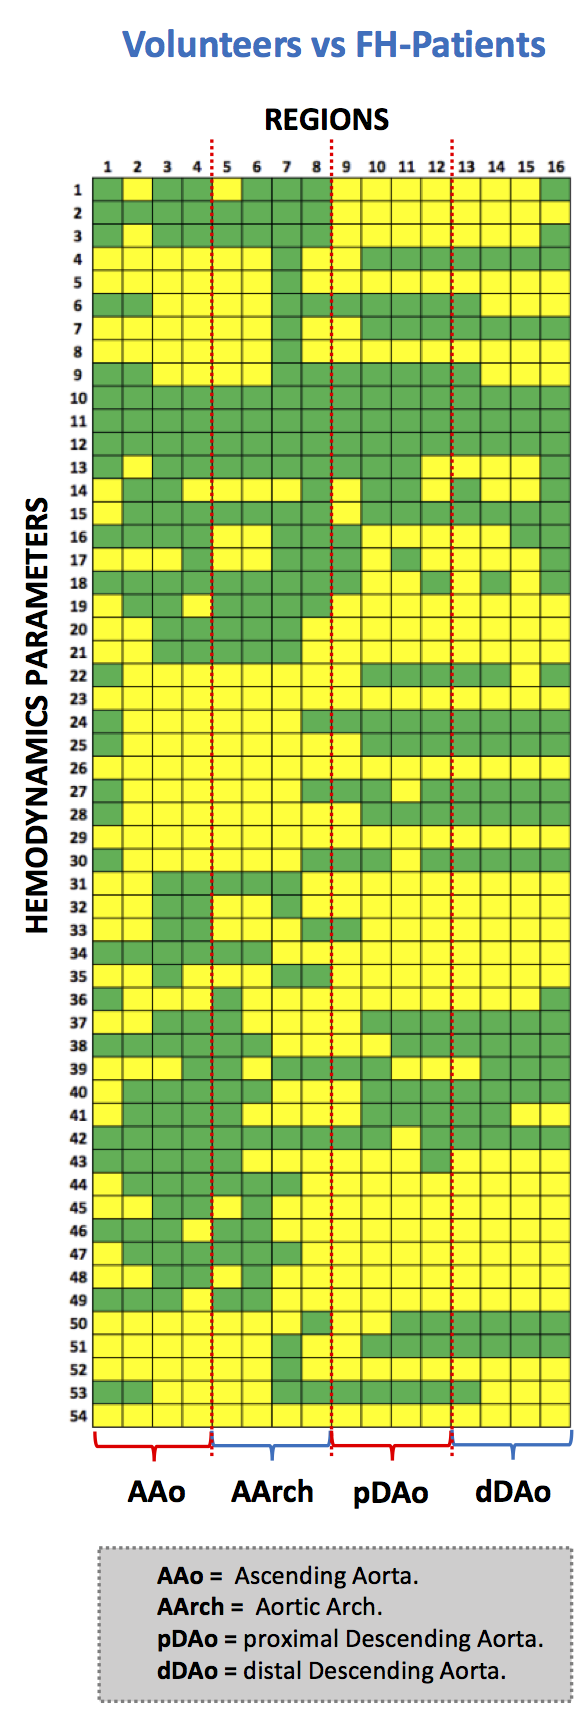
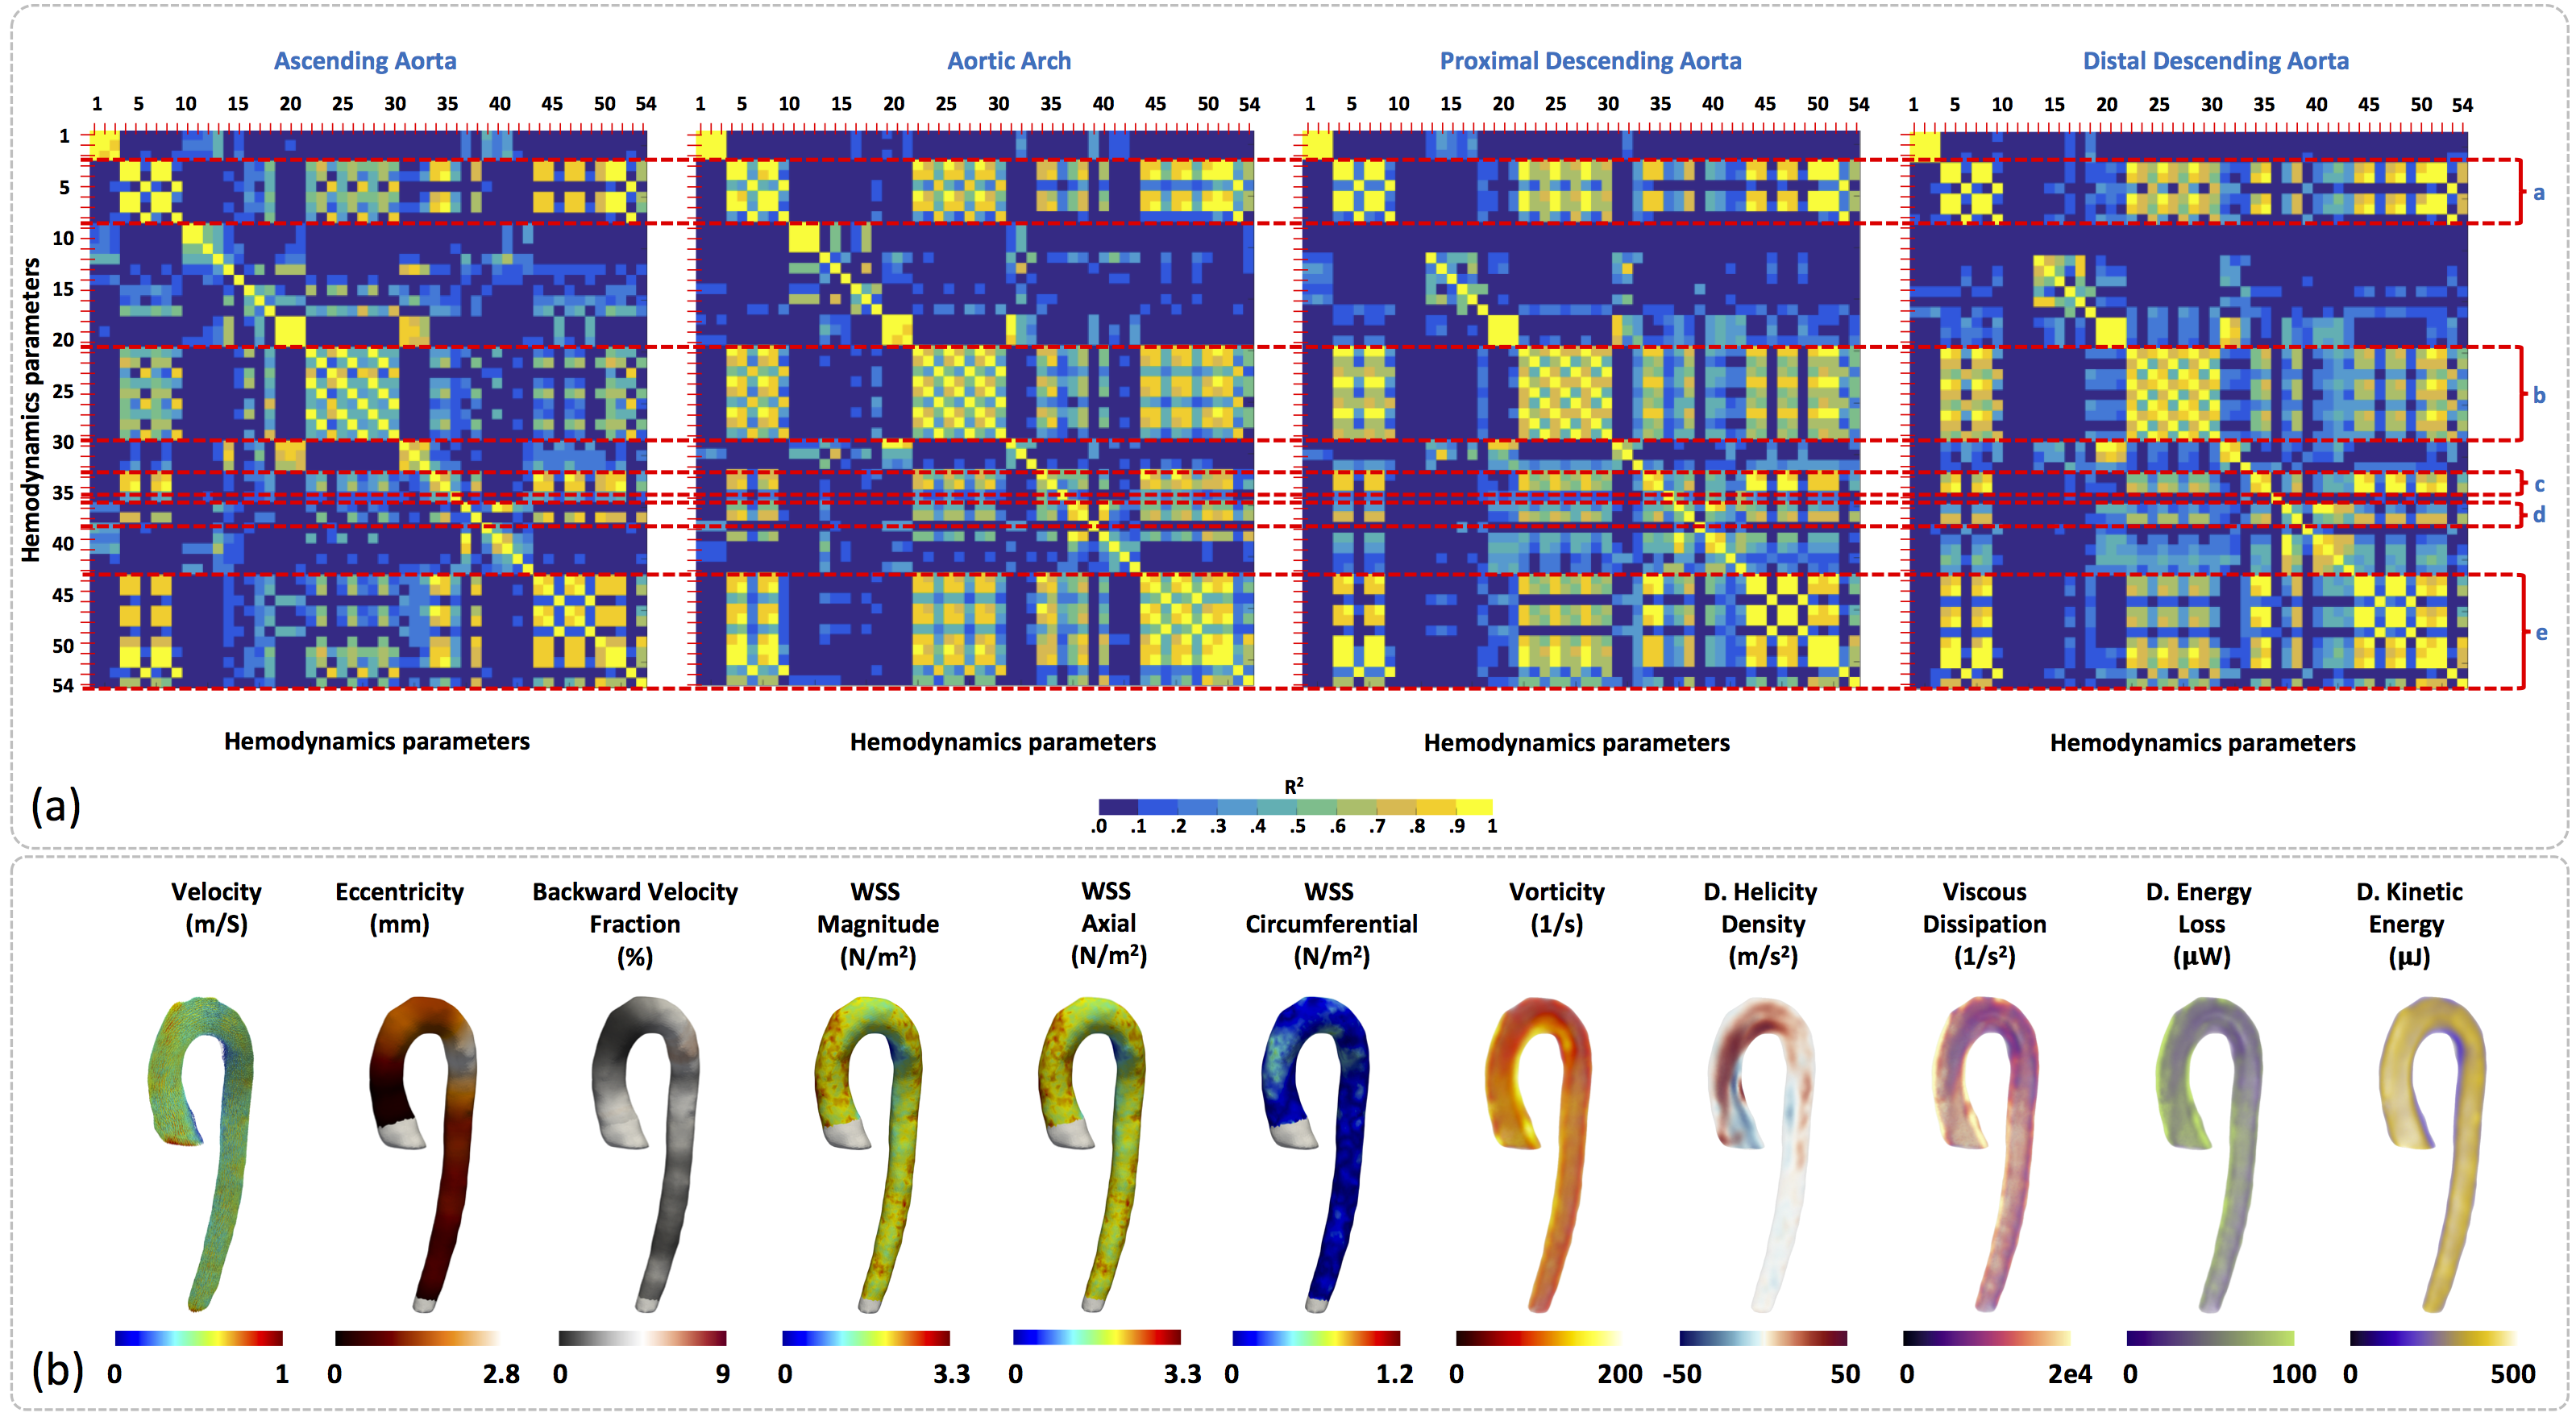
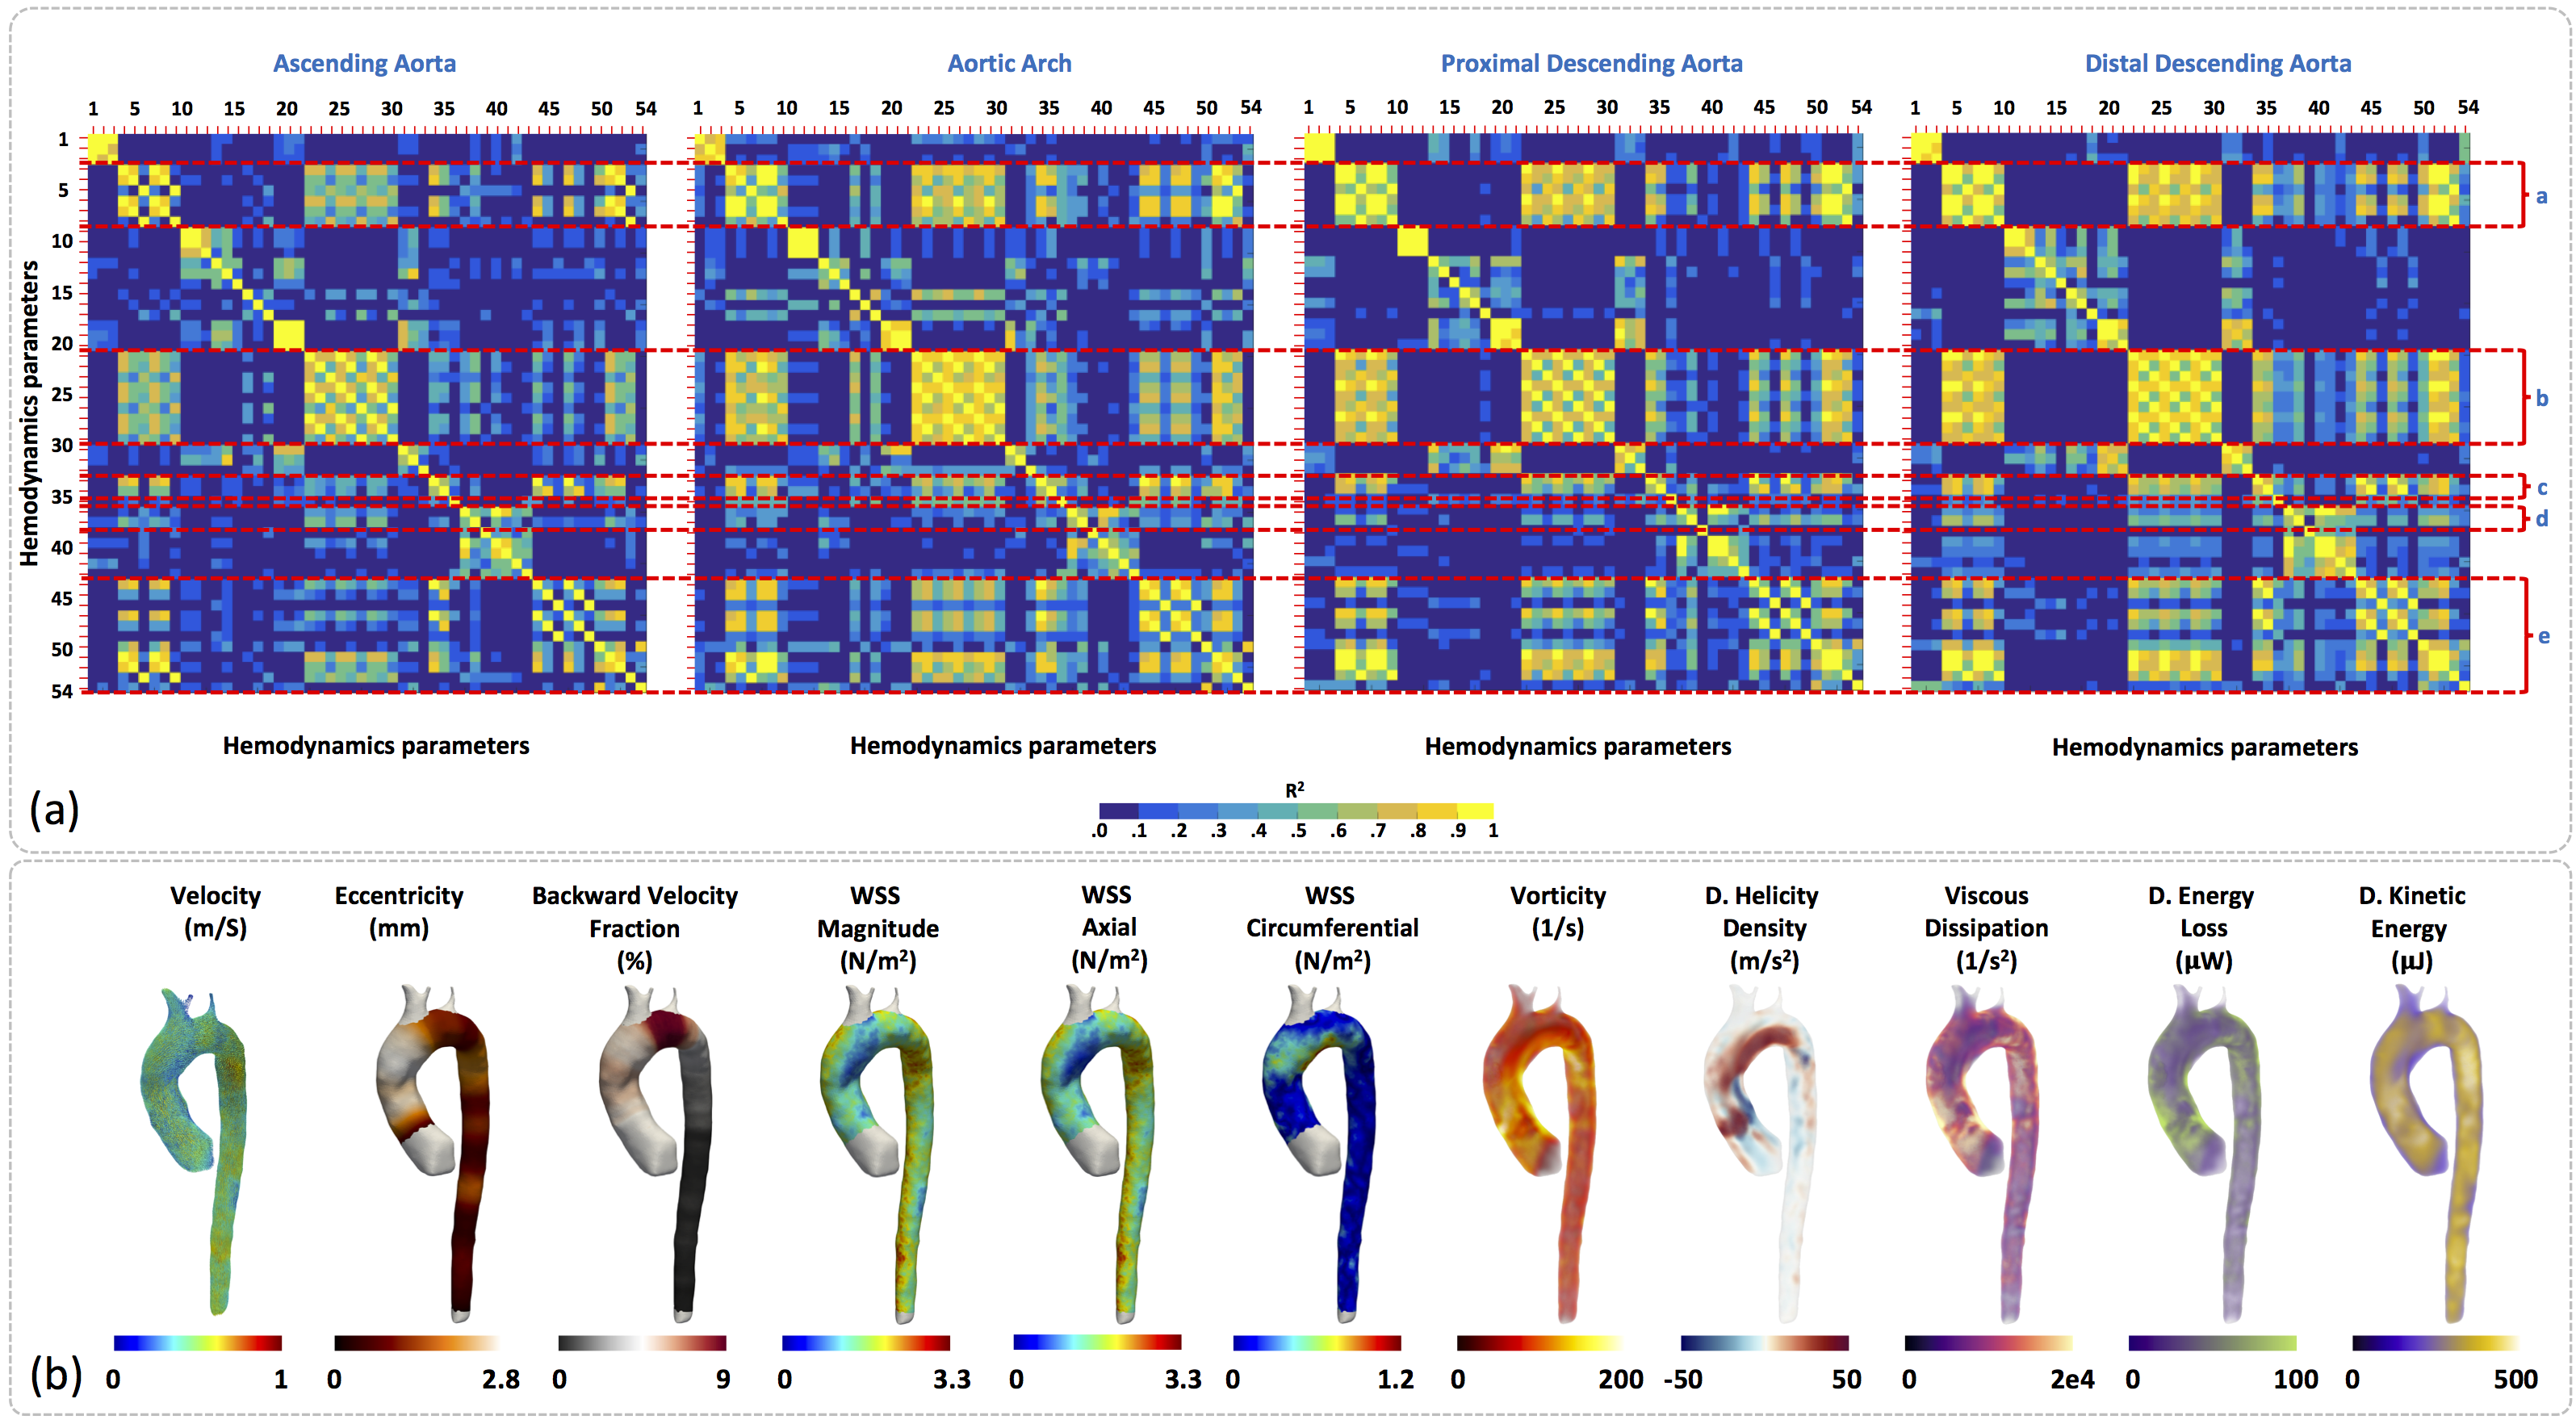
In Figure3a we observe the HPs which show statistical significant differences (p<0.05) between healthy volunteers and FH-patients (yellow box). We observed that the HPs in the regions of the AAo and AArch (regions 1 to 8) showed more significant differences between volunteers and FH patients were; velocity magnitude and forward (HP 4-9), WSS “magnitude, axial, circumferential” (HP 22-30), and kinetic energy (HP 50-54). On the other hand, in the pDAo and dDAo (region 9 to 16), the HPs that show more significant differences are; eccentricity (HP 1-3), maximum values of velocity magnitude and forward (HP 5 and 8), backward velocity fraction (HP 19-21), maximum values of WSS “magnitude, axial, circumferential”, OSI and Vorticity magnitude (HP 31-36), and parameter related with the helicity and kinetic energy (HP 43-54). In Figure4a and Figure5a we present the correlation matrix (R2 values), obtained by the linear regression between all HPs of volunteers and FH patients respectively, for the AAo, AArch, pDAo and dDAo. Figure4b and 5b shows the 3D maps of 10 relevant HP analyzed in this study, for one representative volunteer and one FH patient respectively.Discussion and conclusion
We present a method that allowed us to obtain several 3D maps of different HP derived from 4D-flow data set of FH patients. Most of the HPs show significant differences in both the anterior part of the aorta (AAo + AArch) and in the posterior part (pDAo + dDAo) alternately. The maximum values of WSS “magnitude, axial, circumferential” and Kinetic Energy (HP 23, 26, 29 and 54) depict more significant differences along the entire aorta. WSS, vorticity, helicity density, viscous dissipation, energy loss and kinetic energy were highly correlated in this cohort of volunteers and patients (R2 > 0.7, see Figure 4a and 5a). Longitudinal studies may consider all those parameters to stratify the risk factors of FH patients. In conclusion, the methodology present here represents an advanced hemodynamic description that may help to improve FH patient’s management.Acknowledgements
Thank to grant, CONICYT - PIA - Anillo ACT1416, CONICYT FONDEF/I Concurso IDeA en dos etapas ID15|10284, and FONDECYT #1141036. Sotelo J. acknowledges to FONDECYT Postdoctorado 2017 #3170737.References
1. Benn M, Watts GF, Tybjærg-Hansen A, Nordestgaard BG. Mutations causative of familial hypercholesterolaemia: screening of 98 098 individuals from the Copenhagen General Population Study estimated a prevalence of 1 in 217. EurHeartJ.2016 May 1;37(17):1384–94.
2. Krogh HW, Mundal L, Holven KB, Retterstøl K. Patients with familial hypercholesterolaemia are characterized by presence of cardiovascular disease at the time of death. EurHeartJ.2016 May 1;37(17):1398–405.
3. Alva F, Samanego V, Gonzalez V, Mogler R, Aney E. Structural and dynamic changes in the elastic arteries due to arterial hypertension and hypercholesterolemia. Clin Cardiol. 1993;16: 614–8.
4. Dobsak P, Soska V, Sochor O, Jarkovsky J, Novakova M, Homolka M, Soucek M, Palanova P, Lopez-Jimenez F, Shirai K. Increased cardio-ankle vascular index in hyperlipidemic patients without diabetes or hypertension. J Atheroscler Thromb. 2015;22 (3):272–83.
5. Kanaki AI, Sarafidis PA, Georgianos PI, Kanavos K, Tziolas IM, Zebekakis PE, Lasaridis AN. Effects of low-dose atorvastatin on arterial stiffness and central aortic pressure augmentation in patients with hypertension and hypercholesterolemia. Am J Hypertens. 2013;26(5):608–16.
6. Saba PS, Roman MJ, Longhini C, Scorzoni D, Pini R, Devereux RB, Ganau A. Carotid intimal-medial thickness and stiffness are not affected by hypercholesterolemia in uncomplicated essential hypertension. Arterioscler Thromb Vasc Biol. 1999;19(11): 2788–94.
7. Wentland AL1, Wieben O, Shanmuganayagam D, Krueger CG, Meudt JJ, Consigny D, Rivera L, McBride PE, Reed JD, Grist TM. Measurements of wall shear stress and aortic pulse wave velocity in swine with familial hypercholesterolemia. J Magn Reson Imaging. 2015 May;41(5):1475-85.
8. Pedersen EM, Oyre S, Agerbaek M, et al. Distribution of early atherosclerotic lesions in the human abdominal aorta correlates with wall shear stresses measured in vivo. Eur J Vasc Endovasc Surg. 1999; 18(4):328–333. [PubMed: 10550268]
9. Cheng C, Tempel D, van Haperen R, et al. Atherosclerotic lesion size and vulnerability are determined by patterns of fluid shear stress. Circulation. 2006; 113(23):2744–2753. [PubMed: 16754802]
10. Sotelo J, Urbina J, Valverde I, et al. 3D Quantification of Wall Shear Stress and Oscillatory Shear Index Using a Finite-Element Method in 3D CINE PC-MRI Data of the Thoracic Aorta. IEEE Trans Med Imaging. 2016;35(6):1475-87.
11. Sotelo J, Dux-Santoy L, Guala A, et al. 3D axial and circumferential wall shear stress from 4D flow MRI data using a finite element method and a laplacian approach. Magn Reson Med 2017;0:0-0
12. Markl M, Harloff A, Bley TA, et al. Time resolved 3D MR velocity mapping at 3T: Improved navigator-gated assessment of vascular anatomy and blood flow. J Magn Reson Imag 2007;25:824–831.
Figures