0002
The Effect of Model Compliance and Pulsatile Flow for In-Vitro Simulation of the Aorta1Mechanical Engineering, University of Wisconsin, Madison, WI, United States, 2Radiology, University of Wisconsin, Madison, WI, United States, 3School of Medicine and Public Health, University of Wisconsin, Madison, WI, United States, 4Biomedical Engineering, University of Wisconsin, Madison, WI, United States
Synopsis
In-vitro cardiovascular simulation permits quantification of hemodynamics that cannot be assessed in-vivo. However, simulation accuracy depends on anatomical and physiological realism of in-vitro models and flow. To determine the effect of model compliance and pulsatile flow, a rigid model of an aorta was compared with a geometrically identical compliant model. Models were perfused with pulsatile flow using a positive displacement pump. Flow dynamic parameters for simulations, obtained using 4D flow MRI, showed that model compliance plays a significant role in hemodynamics during pulsatile flow. Future development of realistic in-vitro simulation, paired with in-vivo validation, will aid in surgical planning.
Introduction
Cardiovascular conditions such as single ventricle heart defects (SVHD) and aortic valve stenosis (AS) among others require surgical intervention that alter patient hemodynamics. Quantification of these alterations are challenging and at times impossible to obtain in-vivo. In-vitro simulation using 3D printed, patient specific, geometries provides a method of measuring hemodynamics for alternative surgical geometries and procedures, which can then be used to aid in surgical planning.[1] However, many studies involving in-vitro experiments are conducted using rigid models and non-pulsatile flow.[2–4] Although anatomically realistic, these models may be unable to reproduce the physiological and mechanical realism required for making surgical decisions. In this study, identical rigid and distensible models of an aorta were compared. Each model was perfused with highly and minimally pulsatile flow.Methods
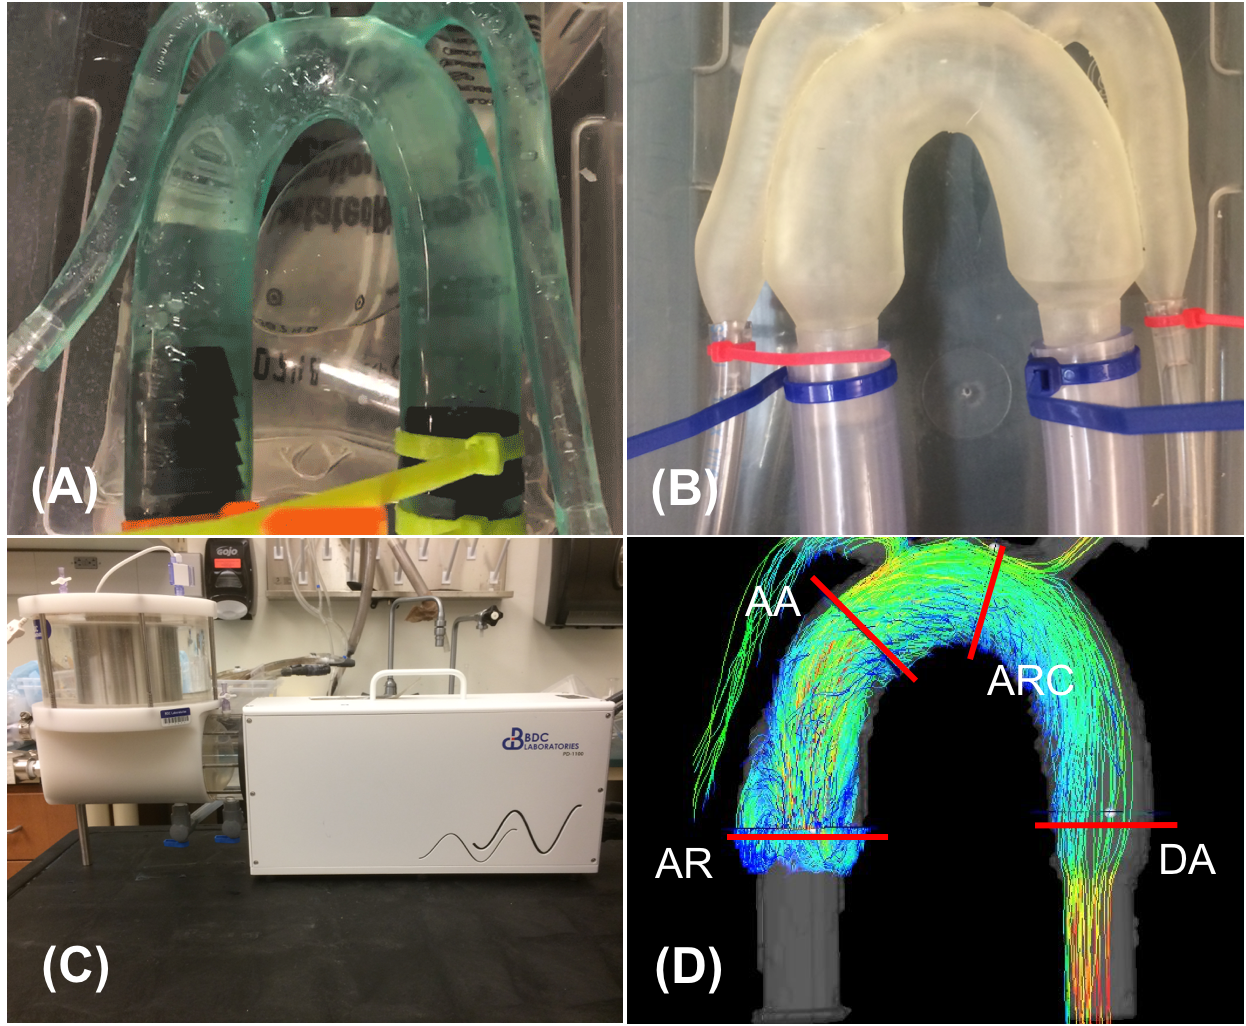
The rigid and distensible models (Figure 1) were perfused with pulsatile flow using a positive displacement pulsatile pump in line with a hemodynamic conditioning head (BDC PD-1100, BDC Laboratories, Wheat Ridge, CO). The pump parameters and flow loop remained identical for rigid and distensible simulations. Pulsatile flow was quantified using pressure amplitude upstream from the model location (Highly pulsatile: 160 mmHg, minimally pulsatile: 22 mmHg). Each model was scanned on a clinical 3T MRI scanner (Discovery MR 750, GE Healthcare, Waukesha, WI) with a 32-channel body coil (NeoCoil, Pewaukee, WI). 2D phase contrast images in the ascending aorta (AA) were used to calculate the relative area change (RAC = (Amax – Amin)/Amin) as a metric of wall distensibility. 4D flow MRI was performed using a cardiac-gated, time-resolved, 3D radially undersampled phase contrast acquisition (5-point PC-VIPR) with increased velocity sensitivity. Acquisition and reconstruction parameters are previously described.[2] Data were reconstructed to 14 time frames per cardiac cycle. Phase offsets were corrected automatically during reconstruction using 2nd order polynomial fitting of background tissue segmented based on thresholding of an angiogram. Velocity-weighted angiograms were calculated from the final velocity and magnitude data for all 14 time frames. EnSight (CEI, Apex, NC) was used for flow visualization and quantification by placement of cut-planes in the aortic root, ascending aorta, aortic arch, and descending aorta, where flow measurements were made. In addition, the software automatically placed 20 cut planes along the aorta. Flow waveforms at those 20 planes were loaded into Matlab (Mathworks, Natick, MA), upsampled to 400 points and pulse wave velocity (PWV) was calculated based on a time-to-peak (TTP) algorithm.[6]Results
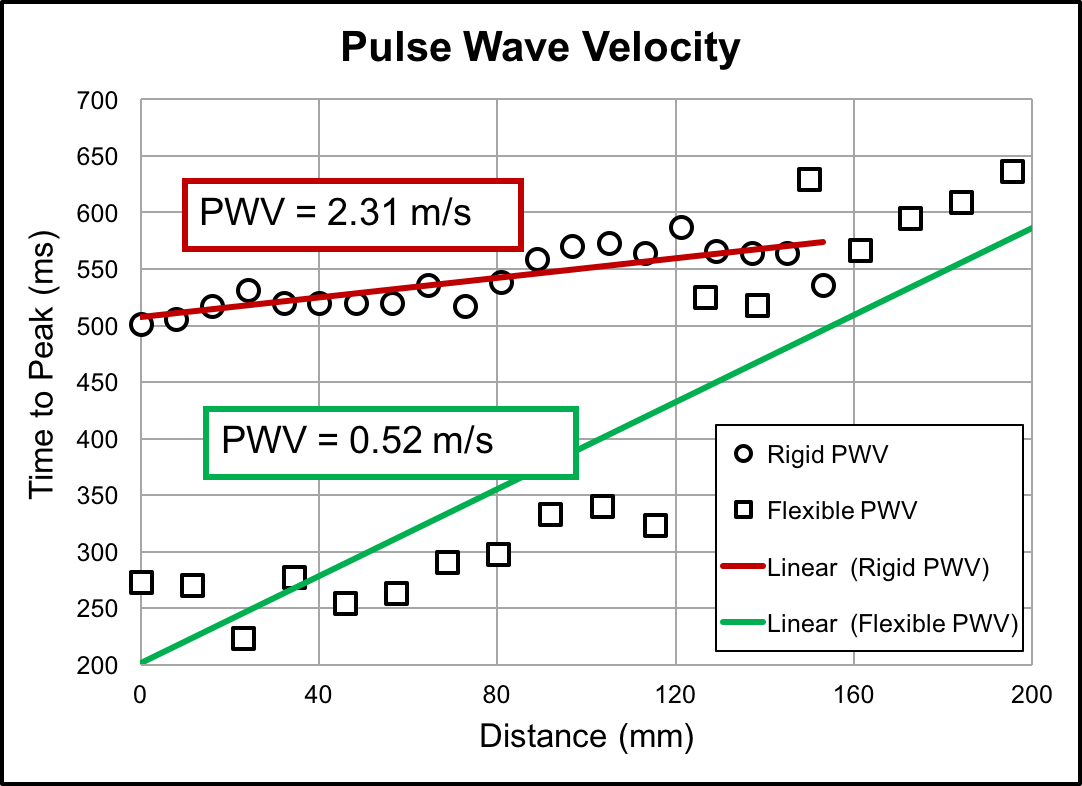
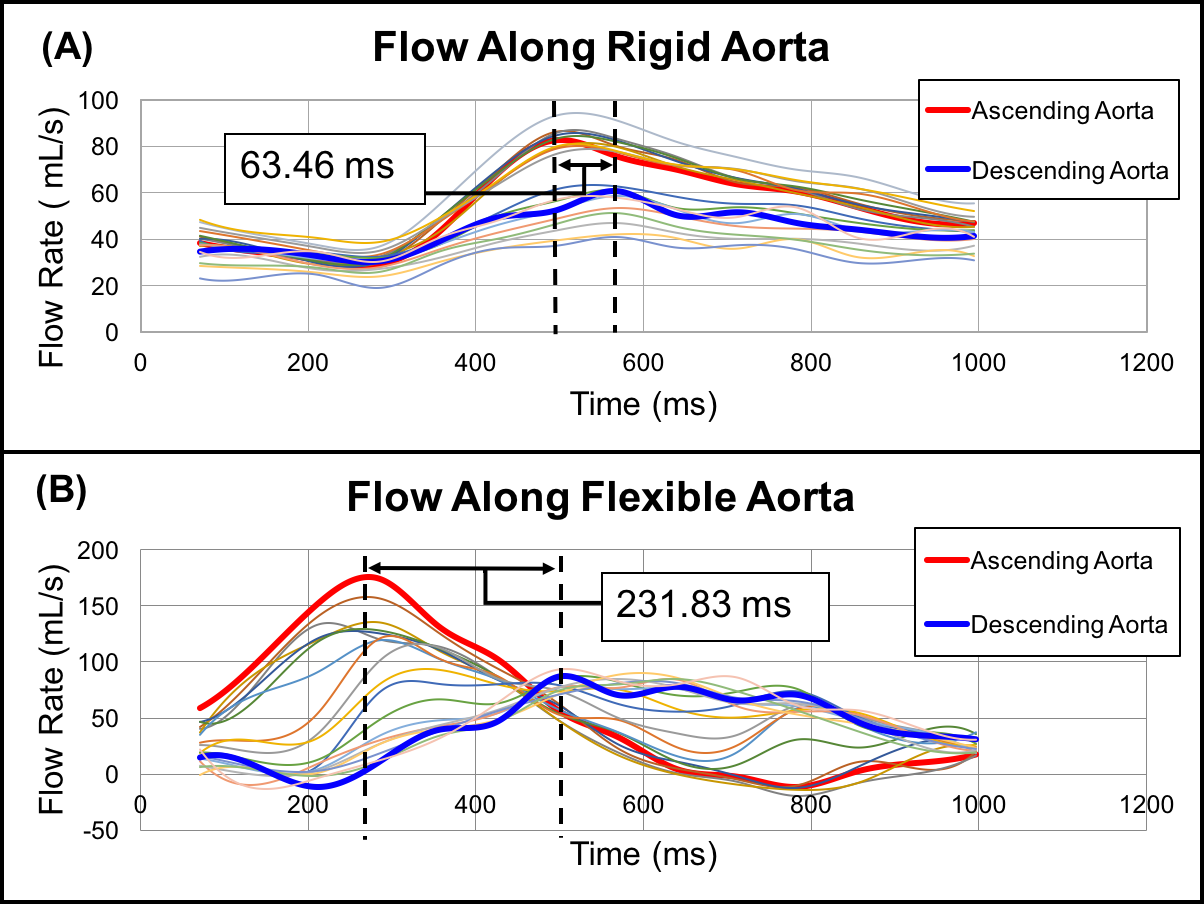
Substantial differences in hemodynamics were found between rigid and distensible in-vitro models when perfused with highly pulsatile flow. For minimally pulsatile flow, there were smaller differences between rigid and distensible models. The RAC in the AA of the distensible model was 130% for highly pulsatile flow and 7% for minimally pulsatile flow. Although net flow was equivalent between models, flow waveform shape varied throughout the cardiac cycle (figure 4). For highly pulsatile flow, the maximum percent difference between flow waveforms at the AA was 108% between models. For minimally pulsatile flow, the maximum percent difference between flow waveforms at the AA was 25%. furthermore, sizable diastolic velocity differences were found along the ascending aorta for highly pulsatile flow. During highly pulsatile flow, rigid model PWV was 2.31 m/s and distensible model PWV was 0.52 m/s (figure 2).Discussion
In-vitro distensible and rigid models were compared during highly and minimally pulsatile flow perfusion. For highly pulsatile flow, differences in PWV, flow, and diastolic velocity between rigid and distensible models suggest that compliance plays a significant role in generating physiologic flow waveforms. Energy is stored as elastic energy by the distensible model and is spent in the rigid model due to viscous dissipation. This shows the effect of model compliance on energy. Large RAC in the AA during highly pulsatile flow shows that model compliance plays a significant role in model geometry. During minimally pulsatile flow, small differences between rigid and distensible model flows (figure 5) show that compliance is less significant in generating physiologic conditions for minimally pulsatile or continuous flow. Additionally, smaller RAC in the AA shows that model compliance has a smaller effect on geometry for these conditions. Future work includes generating patient-specific aortic flow and pressure conditions in-vitro. Data gathered from rigid and distensible models using these conditions will be compared with in-vivo patient data to validate in-vitro testing of unique flow conditions.Conclusion
The effects of varying compliance and pulsatile flow were analyzed for two aorta models. Development of anatomically and physiologically realistic in-vitro models and flow, for comparison with in-vivo patient data, will aid in the surgical planning tools for patients with conditions such as SVHD or AS.Acknowledgements
No acknowledgement found.References
1. Maragiannis D, Jackson MS, Igo SR, et al. Replicating Patient-Specific Severe Aortic Valve Stenosis with Functional 3D Modeling. Circ Cardiovasc Imaging. 2015;8(10):1-8.
2. Roldán-Alzate A, García-Rodríguez S, Anagnostopoulos P V., Srinivasan S, Wieben O, François CJ. Hemodynamic study of TCPC using in vivo and in vitro 4D Flow MRI and numerical simulation. J Biomech. 2015;48(7):1325-1330.
3. De Zélicourt DA, Pekkan K, Wills L, et al. In vitro flow analysis of a patient-specific intraatrial total cavopulmonary connection. Ann Thorac Surg. 2005;79(6):2094-2102.
4. Groves EM, Falahatpisheh A, Su JL, Kheradvar A. The Effects of Positioning of Transcatheter Aortic Valves on Fluid Dynamics of the Aortic Root. ASAIO J. 2014;60(5):545-552.
5. Johnson KM, Lum DP, Turski PA, Block WF, Mistretta CA, Wieben O. Improved 3D phase contrast MRI with off-resonance corrected dual echo VIPR. Magn Reson Med. 2008;60(6):1329-1336.
6. Mri F, Markl M, Wallis W, et al. Estimation of Global Aortic Pulse Wave Velocity by. 2010;1582:1575-1582.
Figures