Penumbra Imaging
1Massachusetts General Hospital
Synopsis
In acute stroke imaging, the “penumbra” usually refers to brain tissue that is considered to be at risk for infarction. Identification of the penumbra is consistently a focus of active imaging research, particularly in the development of strategies for selecting patients for intravenous thrombolysis and mechanical thrombectomy. Penumbral imaging approaches usually employ perfusion imaging, which provides a variety of complementary measurements of cerebral hemodynamics at the microvascular level. This talk will explore the relationship of penumbral imaging to fundamental principles of cerebrovascular physiology, addressing both currently implemented penumbral imaging techniques, and potential novel applications of perfusion imaging in stroke care.
Target Audience
Imaging researchers, neurologists, radiologists, nurses, allied health professionals.Learning Objectives
1. Understand the concept of the ischemic penumbra, as it was initially defined by researchers in the 1970s, and as it is used in stroke imaging today.
2. Understand basic ischemic pathophysiology, as it pertains to the various microvascular hemodynamic measurements that can be obtained using perfusion imaging, and their relationships to neuronal function and viability.
3. Relate microvascular hemodynamic measurements to the concept of the penumbra.
4. Apply the basic principles of ischemic pathophysiology in considering novel applications for perfusion imaging in stroke care.
The Penumbra: History and Current Definition
The term “penumbra” originated in the “ischemic penumbra,” which was among the most important concepts to emerge from experimental studies of stroke pathophysiology in the 1970s. As originally defined by Lindsay Symon, the researcher who coined the term, “ischemic penumbra” referred to a zone of brain tissue in which a mild reduction in blood flow (i.e. mild ischemia) caused failure of neuronal electrical activity that was reversible, in that the associated neurologic deficit could be eliminated at any time by restoration of normal perfusion. Symon called this zone the ischemic penumbra because it often surrounded a central region of irreversibly damaged tissue where electrical function could not be restored (sometimes called the “core”). This relationship reminded Symon of the bright ring that surrounds the center of a candle flame, which is also called the penumbra.[1]
In the years that have elapsed since its inception, Symon’s evocative metaphor has been repurposed to express a different concept, one that is also rooted in the basic physiology experiments of Symons’ era, but that is more directly related to advances in patient care that have drawn upon them. Researchers have found that ischemia severe enough to cause neuronal necrosis (i.e. more severe than that in Symon’s “ischemic penumbra”) does so over a period of time whose duration varies with the level of blood flow.[2] A complete cessation of blood flow takes only a few minutes to cause irreversible injury, however, if some flow remains present, tissue may remain potentially viable for several hours, before the accumulated ischemic injury eventually becomes irreversible. This time-dependent nature of ischemic injury, which is summarized in Figure 1, is the fundamental physiologic basis for the most important treatment that is currently offered to acute stroke patients: therapeutic recanalization of occluded cerebral arteries, with the goal of restoring tissue perfusion. Recanalization is most often attempted by intravenous injection of the thrombolytic drug tissue plasminogen activator (tPA). At select centers, interventional neuroradiologists can also use intraarterial catheters to deploy mechanical thrombectomy devices directly within occluded vessels. In either case, recanalization of occluded arteries is considered an emergency intervention, which must be performed as quickly as possible, in order to maximize the quantity of ischemic tissue that can be salvaged before it accumulates permanent ischemic damage.
Intravenous thrombolysis and mechanical thrombectomy are potentially lifesaving interventions, but both entail significant risks. Therefore, researchers have sought to develop imaging techniques that can identify which patients are most likely or unlikely to benefit from these treatments. For several decades, those efforts have focused largely upon using MR or CT perfusion imaging to estimate the extent of brain tissue that will die if recanalization is not attempted, but would be saved by timely reperfusion. Most researchers, when they refer to “the penumbra,” now mean to describe this threatened-but-salvageable brain tissue.
It is ironic that the penumbra now refers to tissue whose viability is threatened by ischemia, in that the term originally described tissue that was not threatened. Even more ironic, perhaps, are the now-ubiquitous practice of defining the penumbra using hemodynamic abnormalities that do not necessarily pose any threat to tissue viability, and the tendency of current research on the penumbra to drift farther from the very physiologic principles that originally gave rise to the concept. In order to explore these hypotheses, and to consider how basic ischemic pathophysiology might lead to new opportunities for using perfusion imaging in the future, it will be worthwhile to consider the various hemodynamic measurements that may be obtained using perfusion imaging, and their potential implications for acute stroke care.
Perfusion Imaging
The two techniques that are generally used to estimate the size of the penumbra, CT and MR perfusion imaging, yield similar information regarding regional microvascular cerebral hemodynamics. MR perfusion imaging is most often performed using the dynamic susceptibility contrast (DSC) technique, in which echo-planar T2*-weighted images of the brain are acquired repeatedly before, during, and after intravenous injection of a bolus of gadolinium-based contrast material.[3] As the gadolinium passes into and out of each brain voxel, the corresponding image pixel exhibits a transient susceptibility-induced drop in signal intensity, which can be converted to a function that reflects contrast concentration over time. This function is then processed to generate several different scalar measurements of local hemodynamic conditions with the voxel.[4, 5] The four most commonly computed measurements are cerebral blood volume, cerebral blood flow, mean transit time, and the time at which the deconvolved residue function reaches its maximum value, which is usually abbreviated as “Tmax.” These measurements will be described in detail below. For each of these measurements that is computed, when values have been computed for every voxel in the imaged portion of the brain, they are assembled into “maps” of that measurement (Figure 2). These maps are then interpreted in the clinical or research setting.
Cerebral blood volume (CBV) expresses the fraction of the voxel’s volume that is occupied by blood within blood vessels. Changes CBV occur when there is a reduction in cerebral perfusion pressure (CPP), such as that which occurs downstream to an artery that is pathologically narrowed or occluded. In response to a CPP reduction, cerebral vessels dilate, causing a reduction in vascular resistance, and maintenance of constant CBF over a fairly wide range of CPPs. This vasodilation is sometimes detectable by perfusion imaging as a small increase in CBV. Very severe decreases in CPP may cause microvascular collapse and/or microthrombosis, either of which may cause CBV to fall. However, it is unclear how often this actually occurs. In many instances, apparent CBV reductions may reflect incomplete sampling of the contrast bolus due to short scan durations, rather than true reductions in CBV.[6]
Cerebral blood flow (CBF) reflects the rate of delivery of blood into the voxel. CBF begins to fall when a drop in CPP is severe enough to overwhelm the brain’s capacity for autoregulatory vasodilation. As discussed above, mild reductions in CBF cause reversible cessation of neuronal electrical activity, whereas more severe ischemia causes cellular damage that eventually becomes irreversible, after an amount of time that is inversely related to the severity of the CBF decrement. It is also common to observe CBF values that are above-normal, in recently ischemic tissue that has experienced spontaneous or therapeutic reperfusion. This hyperperfusion phenomenon occurs because cerebral vessels sometimes remain unnecessarily dilated for some time following restoration of normal CPP.
Mean transit time (MTT) is the average amount of time that blood spends within the brain voxel. MTT is usually calculated, via the central volume theorem, as the quotient of CBV divided by CBF. As discussed above, a drop in CPP causes compensatory vasodilation, i.e. an increase in CBV, which may be successful in maintaining normal CBF, or may be unsuccessful, in which case CBF falls. MTT increases in either case, because MTT is equal to the quotient of CBV divided by CBF. MTT prolongation helps brain tissue to survive reductions in blood flow, because the diffusion of oxygen across capillary walls is limited by the time that blood spends within capillaries. When transit time is prolonged, the fraction of blood oxygen content that can be extracted by brain cells can increase markedly.
In interpreting MTT maps, it is worthwhile to consider that there are at least two situations in which CBV and CBF abnormally change in the same direction: post-ischemic hyperperfusion, in which both CBV and CBF are elevated, and microvascular collapse, in which both CBV and CBF are very low. In these two situations, MTT, which is the quotient of CBV divided by CBF, may appear low, high, or normal, depending on which of CBV or CBF exhibits the greater change.
Finally, the time at which the deconvolved residue function reaches its maximum, usually abbreviated as Tmax, is probably the hemodynamic parameter that is most often used to identify the “penumbra” in current research. Tmax is derived from the deconvolution process that is used to calculate CBF, and it is, in theory, it is a measure of arrival time. Specifically, Tmax reflects the time that elapses between the arrival of blood in some normal-appearing index artery, and the brain voxel in which Tmax is measured. Under normal conditions, this arrival delay is close to zero throughout the brain. However, when blood must circumvent occluded arteries to reach brain tissue via circuitous collateral routes, arrival time may be delayed by as much as ten seconds, or more. Arrival delay has no known direct physiologic significance, however, longer arrival delays tend to be associated with more severe disruptions in other, more physiologically significant measurements.
When maps of the four perfusion measurements described above are interpreted together, different regions of the brain may be assigned to one of the four categories of hemodynamic abnormalities that are summarized in Figure 3.
Using Perfusion Imaging to Identify the Penumbra
In current practice, the quantity of putatively at-risk penumbral tissue is almost always calculated by measuring the volume of tissue that has abnormally elevated Tmax or MTT, even though neither of these conditions entails any direct threat to cellular viability. Indeed, as discussed above, MTT elevations are actually protective, in that they allow for increased extraction of oxygen under ischemic conditions. Tmax or MTT elevations are used define the penumbra not because of their direct effects upon cellular viability, but for three other reasons. First, these abnormalities are conspicuous and easily delineated in perfusion maps. Second, they are more easily quantifiable in absolute units, compared to other hemodynamic measurements. Third, they are correlated with the CBF decreases that actually threaten tissue viability, in that more severe abnormalities of one hemodynamic measurement tend to be associated with more severe perturbations of any other. However, significant correlations between two measurements do not imply their interchangeability,[7] and elevations of Tmax and MTT do not necessarily imply the existence of ischemia. This may explain the increasingly prevalent omission of the word “ischemic,” when discussing what was once called “the ischemic penumbra.” Some patients with chronic cerebrovascular disease manifest large Tmax and MTT abnormalities for years, without experiencing cerebral ischemia or infarction.
The numerous studies that have used Tmax and MTT elevations to define the penumbra have employed various different methods for doing so. Some studies define the penumbra as any tissue that appears subjectively abnormal in Tmax or MTT maps.[8-13] Others have employed Tmax thresholds of 2 seconds,[14-17] 4 seconds, [18, 19] 5.5 seconds, [20, 21] or 6 seconds.[19, 22] Still other studies have used quantitative MTT thresholds of 6 seconds, [20] 7 seconds,[23] or 145% of the normal value.[24] Researchers’ difficulty in reaching a consensus on a single Tmax or MTT threshold that can be used to identify at-risk tissue may be explained partly by the fact that these quantities are only loosely correlated with CBF, which is more directly related to cell viability. However, current understanding of ischemic pathophysiology predicts that achievement of such a consensus in identifying the penumbra would be impossible, regardless of which hemodynamic measurement is used.
Attempts to identify tissue that will proceed to infarction unless arterial recanalization is achieved, based solely upon an imaging-based snapshot of regional hemodynamic conditions at the moment of imaging, discount the effects of events that occurred prior to imaging. In the early stages of ischemic stroke, it is common for regional hemodynamic conditions to fluctuate greatly, as cerebral emboli migrate to new positions, and homeostatic mechanisms cause large variations in systemic blood pressure. The accumulated effects of these factors on cellular viability cannot be captured by perfusion imaging performed after they have occurred.
Even more significantly, attempts to identify a single perfusion imaging-based method for identifying tissue that will progress to infarction if recanalization is not achieved negates the effects of any other interventions that might occur after the time of imaging. For example, therapeutic induction of hypertension might be considered, in an attempt to elevate CPP and preserve CBF, or supplemental oxygen therapy might be initiated, in order to support neuronal metabolism while ischemia persists. Disproportionate focus on identifying the penumbra as the only role for perfusion imaging potentially risks not only futility, but also diversion of attention from the search for other potential roles of perfusion imaging, in guiding non-recanalization-based therapies.
New Directions in Perfusion Imaging Research
Reconsideration of the information that perfusion imaging provides, in light of well-established principles of ischemic pathophysiology, suggests a number of potential roles that perfusion imaging could play in the care of ischemic stroke patients, other than simply recommending for or against recanalization therapy, via the concept of the penumbra. For example, the presence of any regional hemodynamic abnormality may serve as corroborating evidence of a vascular etiology, when patients report transient symptoms that may or may not have been caused by a transient ischemic attack.[25-27] Perhaps intravenous thrombolytic medication, whose purpose is to reverse CPP reductions, should be attempted only when perfusion imaging confirms that such a reduction actually exists. Or, perfusion imaging could be used to distinguish between compensated and uncompensated reductions in CPP, thereby helping to establish an optimal goal for systemic blood pressure, either as a temporizing measure until arterial recanalization is attempted, or in lieu of therapeutic recanalization.
Clinical research has not yet validated the use of perfusion imaging in selecting acute stroke patients for intravenous thrombolysis, or in guiding their blood pressure management. However, research on these potential roles for perfusion imaging, and perhaps many others that do not involve the concept of the penumbra, could one day help to improve the lives of the many patients who are affected by cerebral ischemic disease.
Acknowledgements
No acknowledgement found.References
1. Symon L. The Ischemic Penumbra -- The Beginning. In: Donnan GA, Baron JC, Davis SM, Sharp FR, editors. The Ischemic Penumbra: Pathophysiology, Imaging and Therapy. New York: Informa Healthcare; 2007. p. 1-6.
2. Jones TH, Morawetz RB, Crowell RM, Marcoux FW, FitzGibbon SJ, DeGirolami U, et al. Thresholds of focal cerebral ischemia in awake monkeys. J Neurosurg. 1981;54(6):773-82.
3. Rosen BR, Belliveau JW, Aronen HJ, Kennedy D, Buchbinder BR, Fischman A, et al. Susceptibility contrast imaging of cerebral blood volume: Human experience. Magn Reson Med. 1991;22(2):293-9; discussion 300-3. PubMed PMID: 1812360.
4. Østergaard L, Weisskoff RM, Chesler DA, Gyldensted C, Rosen BR. High resolution measurement of cerebral blood flow using intravascular tracer bolus passages. Part I: Mathematical approach and statistical analysis. Magn Reson Med. 1996;36(5):715-25.
5. Wu O, Østergaard L, Weisskoff RM, Benner T, Rosen BR, Sorensen AG. Tracer arrival timing-insensitive technique for estimating flow in MR perfusion-weighted imaging using singular value decomposition with a block-circulant deconvolution matrix. Magn Reson Med. 2003;50(1):164-74.
6. Copen WA, Deipolyi AR, Schaefer PW, Schwamm LH, Gonzalez RG, Wu O. Exposing hidden truncation-related errors in acute stroke perfusion imaging. AJNR Am J Neuroradiol. 2015;36(4):638-45. doi: 10.3174/ajnr.A4186. PubMed PMID: 25500309.
7. Bland JM, Altman DG. Statistical methods for assessing agreement between two methods of clinical measurement. Lancet. 1986;1(8476):307-10. PubMed PMID: 2868172.
8. Coutts SB, Simon JE, Tomanek AI, Barber PA, Chan J, Hudon ME, et al. Reliability of assessing percentage of diffusion-perfusion mismatch. Stroke. 2003;34(7):1681-3.
9. Ay H, Koroshetz WJ, Vangel M, Benner T, Melinosky C, Zhu M, et al. Conversion of ischemic brain tissue into infarction increases with age. Stroke. 2005;36(12):2632-6. PubMed PMID: 16269639.
10. Hacke W, Albers G, Al-Rawi Y, Bogousslavsky J, Davalos A, Eliasziw M, et al. The Desmoteplase in Acute Ischemic Stroke Trial (DIAS): a Phase II MRI-based 9-hour window acute stroke thrombolysis trial with intravenous desmoteplase. Stroke. 2005;36(1):66-73.
11. Furlan AJ, Eyding D, Albers GW, Al-Rawi Y, Lees KR, Rowley HA, et al. Dose Escalation of Desmoteplase for Acute Ischemic Stroke (DEDAS): evidence of safety and efficacy 3 to 9 hours after stroke onset. Stroke. 2006;37(5):1227-31.
12. Copen WA, Rezai Gharai L, Barak ER, Schwamm LH, Wu O, Kamalian S, et al. Existence of the diffusion-perfusion mismatch within 24 hours after onset of acute stroke: dependence on proximal arterial occlusion. Radiology. 2009;250(3):878-86.
13. Hacke W, Furlan AJ, Al-Rawi Y, Davalos A, Fiebach JB, Gruber F, et al. Intravenous desmoteplase in patients with acute ischaemic stroke selected by MRI perfusion-diffusion weighted imaging or perfusion CT (DIAS-2): a prospective, randomised, double-blind, placebo-controlled study. Lancet Neurol. 2009;8(2):141-50.
14. Albers GW, Thijs VN, Wechsler L, Kemp S, Schlaug G, Skalabrin E, et al. Magnetic resonance imaging profiles predict clinical response to early reperfusion: the diffusion and perfusion imaging evaluation for understanding stroke evolution (DEFUSE) study. Ann Neurol. 2006;60(5):508-17. PubMed PMID: 17066483.
15. Kakuda W, Lansberg MG, Thijs VN, Kemp SM, Bammer R, Wechsler LR, et al. Optimal definition for PWI/DWI mismatch in acute ischemic stroke patients. J Cereb Blood Flow Metab. 2008;28:887-91.
16. Davis SM, Donnan GA, Parsons MW, Levi C, Butcher KS, Peeters A, et al. Effects of alteplase beyond 3 h after stroke in the Echoplanar Imaging Thrombolytic Evaluation Trial (EPITHET): A placebo-controlled randomised trial. Lancet Neurol. 2008;7:209-309.
17. Nagakane Y, Christensen S, Brekenfeld C, Ma H, Churilov L, Parsons MW, et al. EPITHET: Positive Result After Reanalysis Using Baseline Diffusion-Weighted Imaging/Perfusion-Weighted Imaging Co-Registration. Stroke. 2011;42(1):59-64. Epub 2010/12/04. doi: STROKEAHA.110.580464 [pii] 10.1161/STROKEAHA.110.580464. PubMed PMID: 21127303.
18. Olivot JM, Mlynash M, Thijs VN, Kemp S, Lansberg MG, Wechsler L, et al. Optimal Tmax threshold for predicting penumbral tissue in acute stroke. Stroke. 2009;40(2):469-75. Epub 2008/12/26. doi: STROKEAHA.108.526954 [pii] 10.1161/STROKEAHA.108.526954. PubMed PMID: 19109547; PubMed Central PMCID: PMC2670783.
19. Bivard A, Levi C, Spratt N, Parsons M. Perfusion CT in acute stroke: a comprehensive analysis of infarct and penumbra. Radiology. 2013;267(2):543-50. doi: 10.1148/radiol.12120971. PubMed PMID: 23264345.
20. Takasawa M, Jones PS, Guadagno JV, Christensen S, Fryer TD, Harding S, et al. How reliable is perfusion MR in acute stroke? Validation and determination of the penumbra threshold against quantitative PET. Stroke. 2008;39(3):870-7.
21. Zaro-Weber O, Moeller-Hartmann W, Heiss WD, Sobesky J. Maps of time to maximum and time to peak for mismatch definition in clinical stroke studies validated with positron emission tomography. Stroke. 2010;41(12):2817-21. doi: 10.1161/STROKEAHA.110.594432. PubMed PMID: 21030699.
22. Lansberg MG, Straka M, Kemp S, Mlynash M, Wechsler LR, Jovin TG, et al. MRI profile and response to endovascular reperfusion after stroke (DEFUSE 2): a prospective cohort study. Lancet Neurol. 2012;11(10):860-7. doi: 10.1016/S1474-4422(12)70203-X. PubMed PMID: 22954705.
23. Furtado AD, Lau BC, Vittinghoff E, Dillon WP, Smith WS, Rigby T, et al. Optimal brain perfusion CT coverage in patients with acute middle cerebral artery stroke. AJNR Am J Neuroradiol. 2010;31(4):691-5. Epub 2009/11/28. doi: ajnr.A1880 [pii] 10.3174/ajnr.A1880. PubMed PMID: 19942712.
24. Wintermark M, Flanders AE, Velthuis B, Meuli R, van Leeuwen M, Goldsher D, et al. Perfusion-CT assessment of infarct core and penumbra: receiver operating characteristic curve analysis in 130 patients suspected of acute hemispheric stroke. Stroke. 2006;37(4):979-85. doi: 10.1161/01.STR.0000209238.61459.39. PubMed PMID: 16514093.
25. Restrepo L, Jacobs MA, Barker PB, Wityk RJ. Assessment of transient ischemic attack with diffusion- and perfusion-weighted imaging. AJNR: American Journal of Neuroradiology. 2004;25(10):1645-52. PubMed PMID: 15569725.
26. Krol AL, Coutts SB, Simon JE, Hill MD, Sohn CH, Demchuk AM, et al. Perfusion MRI abnormalities in speech or motor transient ischemic attack patients. Stroke. 2005;36(11):2487-9.
27. Mlynash M, Olivot JM, Tong DC, Lansberg MG, Eyngorn I, Kemp S, et al. Yield of combined perfusion and diffusion MR imaging in hemispheric TIA. Neurology. 2009;72(13):1127-33.
Figures
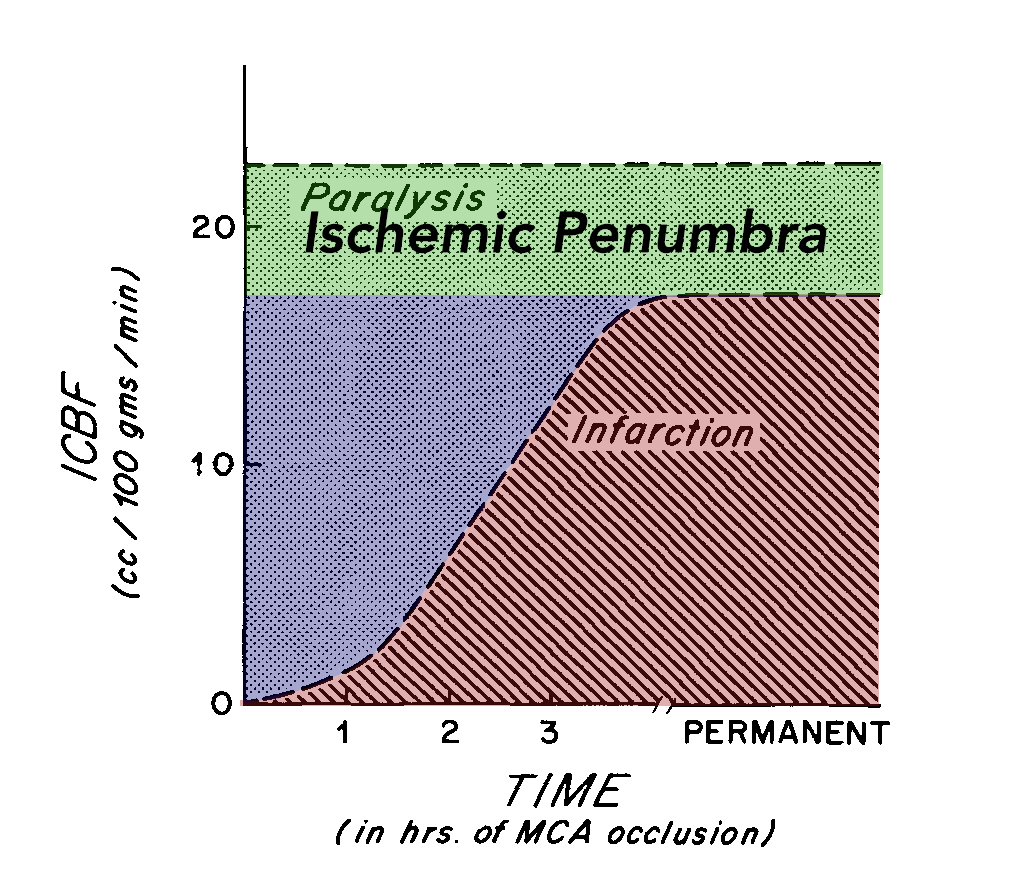
Figure 1: Thresholds of Cerebral Ischemia.
In experimental studies, the effects of varying levels of cerebral blood flow (CBF, y-axis) upon brain tissue depend on the duration of ischemia (x-axis). In this study, CBF levels below the horizontal dashed line caused paralysis. Tissue with CBF levels in the green zone constitutes Lindsay Symon’s “ischemic penumbra,” in which electrical failure remains indefinitely reversible. Lower CBF levels cause ischemic damage that is initially reversible (blue), but eventually becomes irreversible (red). Adapted from reference [2].

Figure 2: Cerebral Perfusion Maps.
In dynamic susceptibility contrast (DSC) imaging, each pixel’s concentration-versus-time curve is processed to yield one of several scalar hemodynamic measurements, and measurements from all pixels are combined to generate perfusion maps. See the text for explanations of abbreviations. This patient exhibits a large region in which reduced CPP has caused compensatory vasodilation, with an increase in CBV (arrows). CBF is maintained in most of this region (CBF, long arrows), but a small quantity of tissue is hypoperfused (CBF, short arrow).
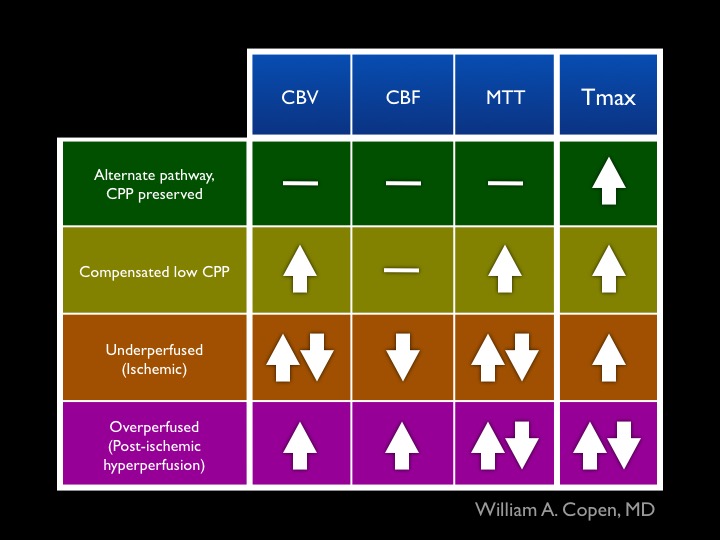
Figure 3: Abnormal Hemodynamic States.
Findings in the four types of perfusion maps described in the syllabus can be used to assign abnormally perfused brain tissue into one of the four categories in this figure. Up-arrows indicate abnormally elevated measurements, and down-arrows indicate abnormally decreased measurements. A horizontal line indicates normal values for the indicated measurement. Paired up- and down-arrows indicate that the measurement may be abnormally high, abnormally low, or normal.