Quantitative Multiparametric Imaging in Oncology
1Radiology / Centre for Image Sciences, University Medical Center Utrecht, Utrecht, Netherlands
Synopsis
This course will introduce the different imaging modalities that are used in (clinical) oncology research. This lecture gives a brief overview of these imaging techniques and the quantitative information that can be derived from it. Combining information from different modalities can aid in answering typical questions related to oncology.
Learning goals
At the end of this lecture you will know:
· What different MR modalities are being used in oncology research (and clinic).
· What their quantitative endpoint is.
· What other imaging modalities such as PET and optical imaging have to offer for oncology (research) and what their quantitative endpoint is.
· How information of different modalities can be combined in research and clinical questions.
Introduction
Cancer tissue is different from normal tissue in many aspects. With imaging many physiological processes can be revealed, which are of interest in cancer diagnosis, treatment monitoring and research. In this lecture, the different aspects of cancer and how to image them are introduced.
1. Morphology
2. Vascularity & Perfusion
3. Oxygenation
4. Acidity & Chemical exchange
5. Metabolic pathways
6. Molecular pathways
Morphology
1. Morphology Computed tomography (CT) and magnetic resonance imaging (MRI) are commonly used to image cancer. For diagnostic purposes, CT has been the clinical workhorse for many decades, however, for many types of cancer, a shift is seen towards diagnosis based on MRI. For example, in prostate cancer, MRI is increasingly being seen as a valuable tool in assessment of this disease [1]. With conventional T1-weighted and T2-weighted imaging, MRI provides excellent contrast and resolution for anatomical imaging of soft tissue, which can reveal the distorted anatomy and morphology of cancer with respect to the normal tissue [2-4]. Also quantitative T1 and T2 mapping has been used to monitor tumor treatment response and predict survival in brain tumors [5] and breast cancer [6]. T2*-weighted sequences are used to depict paramagnetic deoxyhemoglobin, methemoglobin, or hemosiderin in lesions and tissues [7]. Pathologic conditions that can be depicted with these sequences include cerebral hemorrhage, arteriovenous malformation, cavernoma, hemorrhage in tumors, old intraventricular hemorrhage, thrombosed aneurysm, and some calcifications [8].Vascularity and Perfusion
In cancer, the process of neovascularization is activated [9] to supply the cancer tissue with sufficient nutrients and to get rid of waist products. The blood vessels produced by tumors are marked by e.g. capillary sprouting, convoluted and excessive vessel branching, distorted and enlarged vessels and vessel leakiness [9]. The vessel architecture and perfusion of tumors can be studies by CT and MRI. CT perfusion (CTP) allows for the assessment of cerebral blood volume (CBV) and permeability with a single acquisition. The greatest advantage of CT perfusion is the linear relationship between iodine concentration and attenuation on CT. This easy conversion allows for a direct measurement of vascular parameters [10]. With MRI, various techniques exist to measure blood flow and perfusion; dynamic contrast enhanced MRI (DCE-MRI), dynamic susceptibility contrast MRI (DSC-MRI) and arterial spin labeling (ASL) techniques. In DCE-MRI a (gadolinium based) contrast agent is injected into the blood stream. An increase in contrast agent, results in an increase in T1 relaxation rate, from which time-concentration curves can be generated when using T1 weighted MRI with high temporal resolution. These time curves can be analyzed in a qualitative and more quantitative manner. For example in breast cancer, the shape of the wash-in and wash-out curve of the contrast is used in the BIRADS criteria (Breast Imaging-Reporting and Data System) to stage the tumor [11]. More advanced analysis methods aim to estimate kinetic parameters from DCE-MRI data that describe the exchange of the contrast agent in the blood plasma with the extravascular extracellular space (EES). These kinetic models are based on Michaelis Menten kinetics and usually a two-pool model is used with parameters Ktrans, Kep and Ve describing the volume transfer constant between blood plasma and EES, rate constant between EES and blood plasma and volume of EES per unit of tissue volume, respectively [12]. In DSC–MRI, the same Gd-containing contrast agent as in DCE-MRI can be used, but instead of T1 weighted imaging, fast T2* weighted imaging is performed. The prerequisite for DSC-MRI is that it is a fast sequence since the contrast agent shortens T2* and causes a drop in signal intensity [10]. By either choosing a spin echo or gradient echo type of sequence, the contrast is related to the capillary bed or a larger range of vessel sizes respectively. The area under the curve of the contrast series can be used to calculate the relative CBV (rCBV), which is the most commonly used quantitative measure derived from DSC-MRI in the brain. If you cannot use a contrast agent, ASL techniques can be used to measure blood flow. In ASL, the water in the arterial blood is used as an endogenous, freely diffusible contrast medium [13]. The protons in the blood-water of the feeding arteries is inverted or saturated, the so-called labeling of blood. After a certain delay, ideally chosen to start image acquisition at the time that the labeled blood-water exchanges with tissue-water, the acquisition of MR images start. Studies on ASL in brain tumor imaging indicate a high correlation between areas of increased cerebral blood flow (CBF) as measured with ASL and increased CBV as measured with DSC-MRI [13].Oxygenation
Tumor hypoxia is recognized as a limiting factor for the efficacy of radiotherapy, because it enhances tumor radioresistance [14]. Therefore, a lot of research has focused on assessing tumor hypoxia to predict outcome of cancer patients undergoing radiation therapy. The ideal method for imaging hypoxia should be; repeatable over a short period of time in order to monitor both chronic and acute hypoxia before and during the course of radiotherapy; quantitative from 0 to at least 40 mmHg, and predictive of the radiotherapy outcome such that the method can provide a parametric value which is easily convertible into a dose of irradiation. However, up to now, no technique has met all these criteria [15]. Combining information from different modalities could aid to the “ideal hypoxia imaging method”. Several PET tracers for imaging of hypoxia are available. For example 18F-Fluoromisonidazole (18F-MISO), 18F-fluoroerythronitroimidazole (18F-FETNIM) and Copper (II) diacetyl-bis (N4-methylthiosemicarbazone) (61Cu-ATSM). These traces have different chemical properties and therefore differently cleared from the blood. An overview of successful applications of these tracers in predicting radiotherapy outcome can be found in reference [16]. Blood oxygen level-dependent (BOLD) MRI, or fMRI, uses endogenous contrast and is sensitive to the ratio of oxyhemoglobin and deoxyhemoglobin. Deoxyhemoglobin is a paramagnetic agent that shortens T2* of the tissue. However, keep in mind that the oxygenation concentration is not the only parameter that affects R2*: changes in tumor blood flow, blood volume, blood pH, or metabolic status can also influence the R2* measurements [17]. BOLD-MRI is therefore used to monitor tumor oxygenation changes rather than to map tumor hypoxia quantitatively [16]. 19F-MRI is a non-invasive method able to map tumor hypoxia quantitatively, after the injection of a perfluorocarbon emulsion. However, the sensitivity of 19F-MRI is very low, and therefore rather highly concentrated perfluorocarbon contrast agents are necessary, which prohibits application in humans. Quantitative assessments of tumor partial pressure of oxygen can be obtained with electron paramagnetic resonance (EPR). This technique is sensitive to paramagnetic species (molecules presenting unpaired electrons), which are usually injected into the tumor. Changes in oxygen pressure lower than 0.2 mmHg can be detected with this method [18]. The T2 (line width change of the EPR spectrum) is changed by the interactions between the two unpaired electrons of oxygen and the paramagnetic probe, which is injected. As in vivo EPR is performed with low frequency spectrometers (~ 1 GHz), the penetration depth is only a few millimeters, therefore the measurements are restricted to the surface of the tissue [19].Chemical exchange and pH
Chemical exchange saturation transfer (CEST) imaging offers enhanced indirect detection of exchangeable protons species, which can be endogenous such as hydroxyl, amide, and amine protons in peptides or exogenously introduced such as liposomes [3, 20, 21]. In CEST-MRI the contrast is generated by the loss of signal from the bulk water (~110mol/L) at 4.75 ppm due to the exchange with proton species (~mmol/L) that resonate at a different frequency during a frequency selective RF pulse. The exchange rate of a specific species depends on its concentration, pH, temperature and relaxation rate. Therefore, the sensitivity of CEST-MRI and its contrast also strongly depends on imaging sequence design, RF field strength and the main magnetic field strength, which has been described in the following comprehensive reviews [20, 21]. In brain tumors the so-called amide proton transfer (APT) has shown potential for more precise delineation of malignant tumor [22]. It has also been used to distinguish radiation necrosis from tumor progression in patient with brain metastases [23]. The APT contrast is now also explored as potential marker for tumor presence in other organs, such as breast [24]. CEST- MRI is an indirect measure for pH, as pH influences the exchange rate. A direct NMR-method to detect pH is 31P magnetic resonance spectroscopy (MRS). A few decades ago, a lot of research on tumor hypoxia and pH was performed with 31P MRS [25]. The (intracellular) pH can be measured from the frequency shift between inorganic phosphate and phosphocreatine [26]. With the introduction of high field MRI systems, 31P MRS has regained interest again, not only to measure pH in the tumor tissue but also to evaluate tumor metabolism [27](see below).Tumor Metabolism
Magnetic resonance spectroscopy (MRS) is a noninvasive technique capable of assessing free small molecules (metabolites) in human tissue. It uses the magnetic properties of nuclei surrounded by electron clouds in molecules that produce a specific resonance frequency when placed in a strong magnetic field. For example, with MRS, tissue levels of glucose, glutamate, and creatine can be established, which provides information about the energy metabolism of the tissue. Therefore, in contrast with PET, MRS reveals multiple endogenous markers of metabolism within one measurement at similar spatial resolutions. These metabolite levels need to have a millimolar tissue concentration to be detectable with MRS. However, PET is a more sensitive technique and capable of imaging metabolites down to nanomolar concentrations. Nonetheless, MRS can be used to study a broad range of metabolites in a dynamic and longitudinal way and does not require any exogenous tracer [28]. A comprehensive review regarding metabolites relevant in cancer assessable with MRS (either 1H, 31P, or 13C) and examples from clinical use can be found here [29], a review specifically describing MRS in the detection of phospholipid metabolism can be found here [30, 31]. MRS has mostly been applied in brain tumors, prostate cancer and breast cancer. In brain tumors, the data seen so far has implied that MRS can provide unique information that when combined with high-quality anatomical MR images has implications for defining tumor type and grade, directing biopsy or surgical resection, planning focal radiation or biological therapies, and understanding the mechanisms of success and failure of new treatments [32]. In prostate 1H MRS is used to localize prostate cancer and to assess the tumor grade [33]. Poor drug delivery is a major problem in cancer chemotherapy. When a drug contains 19F, such as the fluorinated drugs [5-19F]-fluorouracil (5-FU), the uptake and conversion of the drug can be monitored by 19F-MRS [34]. 19F MRS has the advantage of no background signal, however the concentration of the drug in the tissue (and therefore the SNR) depends on the dose given to the patient [35]. Positron emission tomography (PET) is a metabolic imaging modality using radiolabeled tracers such as fluorodeoxyglucose (FDG). PET is a highly sensitive technique; with a very low dose of tracer metabolic conversions that are characteristic for the tumor can be detected. The past decades, new non-FDG tracers have been developed and explored for more specific use of PET in clinic, examples can be found in these reviews [36, 37].Molecular Imaging
The definition of molecular imaging depends on whom you talk to, but here I use the term for imaging of labeled tracers, receptors and gene expression. As said above, with PET a variety of radiolabeled tracers are available. There are several mechanisms by which a molecular imaging probe accumulated in cancer cells, such as the large requirement of glucose when cancer cells start multiplying which is exploited in FDG-PET [38]. Cellular uptake of the radiopharmaceuticals can also be achieved via biochemical pathways such as amino acid, protein or DNA synthesis. Also an over expressed antigen present on the cell surface can be targeted by using a specific monoclonal antibody, as in the case of radioimmunoimaging [38]. The target molecule can be an antigen, a peptide receptor or enzyme; and often they are macromolecules. Peptide receptor radionuclide imaging or therapy is one of the common modalities practiced in nuclear medicine, most notably for the diagnosis and treatment of neuroendocrine tumors [39, 40]. The different steps involved in the design of targeted radionuclides and examples of commonly used radionuclides are given in review [38]. With optical techniques such as bioluminescence, fluorescence and near-infrared it is possible to image gene expression, promoter activity, and transcriptional activity via reporter genes. Reporter genes that are typically used include luciferase genes for bioluminescence imaging and fluorescent-protein genes for fluorescence imaging. These reporter genes are placed under the control of a promoter of interest so that promoter activity in vivo can be evaluated [37]. Examples of molecular or cellular targets for optical imaging are p53, EGFR, HER2/neu, VEGF, HIF-1, Cathepsin D/B and metalloprotease-2, see review [37]. Triple-fusion-reporter genes that allow for in vivo multi-modality imaging with bioluminescence, fluorescence and PET have recently been developed [41]. Also CEST-MRI combined with contrast agents can be considered as molecular imaging. Infusion of glucose followed by CEST-MRI might offer an alternative to FDG-PET [3]. ParaCEST agents are metal ion complexes with a slow proton exchange, which can be detected far away from the bulk water. These agents can target specific biological processes, however, as these agents are administered via the blood, image interpretation is complicated by tissue perfusion and clearance of the paraCEST agent out of the body [3]. To circumvent this problem, biodegradable, lysine rich–protein (LRP) reporter of a potential family of genetically engineered reporters can be build [42], that can express artificial proteins which can exchange with water and be measured indirectly using CEST-MRI. This way an endogenous CEST contrast is generated which can be measured non-invasively.List of Quantitative Endpoints
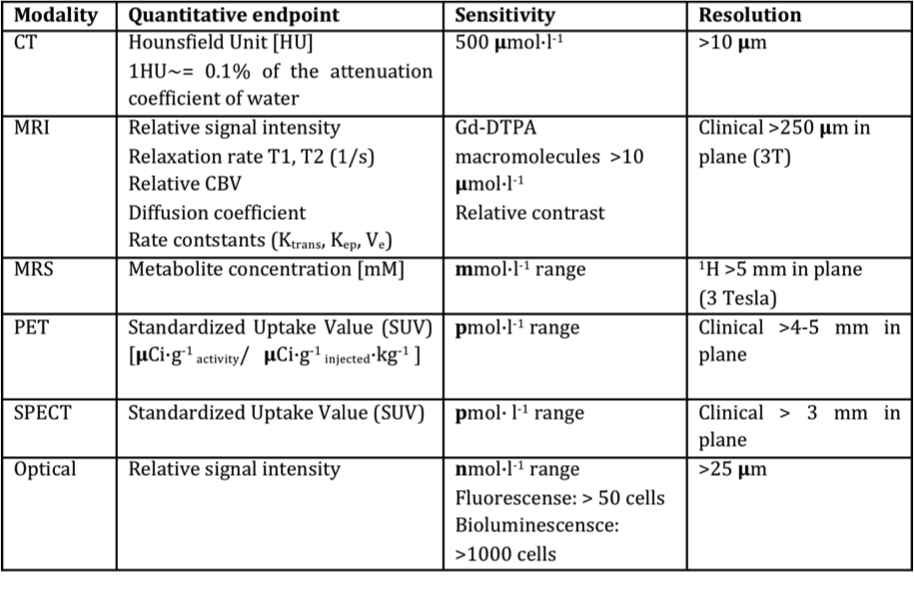
Table 1: Quantitative endpoints and sensitivity of imaging modalities (adapted from [37])Acknowledgements
No acknowledgement found.References
1. Shukla-Dave, A. and H. Hricak, Role of MRI in prostate cancer detection. NMR Biomed, 2014. 27(1): p. 16-24.
2. Kimura, M. and L.C. da Cruz, Jr., Multiparametric MR Imaging in the Assessment of Brain Tumors. Magnetic resonance imaging clinics of North America, 2016. 24(1): p. 87-122.
3. Salzillo, T.C., et al., Interrogating Metabolism in Brain Cancer. Magnetic resonance imaging clinics of North America, 2016. 24(4): p. 687-703.
4. Ueno, Y., et al., Multiparametric magnetic resonance imaging: Current role in prostate cancer management. Int J Urol, 2016. 23(7): p. 550-7.
5. Hattingen, E., et al., Quantitative T2 mapping of recurrent glioblastoma under bevacizumab improves monitoring for non-enhancing tumor progression and predicts overall survival. Neuro Oncol, 2013. 15(10): p. 1395-404.
6. Liu, L., et al., Changes of T2 Relaxation Time From Neoadjuvant Chemotherapy in Breast Cancer Lesions. Iran J Radiol, 2016. 13(3): p. e24014.
7. Chavhan, G.B., et al., Principles, techniques, and applications of T2*-based MR imaging and its special applications. Radiographics, 2009. 29(5): p. 1433-49.
8. Tsushima, Y. and K. Endo, Hypointensities in the brain on T2*-weighted gradient-echo magnetic resonance imaging. Curr Probl Diagn Radiol, 2006. 35(4): p. 140-50.
9. Hanahan, D. and R.A. Weinberg, Hallmarks of cancer: the next generation. Cell, 2011. 144(5): p. 646-74.
10. Griffith, B. and R. Jain, Perfusion Imaging in Neuro-Oncology: Basic Techniques and Clinical Applications. Magnetic resonance imaging clinics of North America, 2016. 24(4): p. 765-779.
11. Schnall, M.D. and D.M. Ikeda, Lesion Diagnosis Working Group report. J Magn Reson Imaging, 1999. 10(6): p. 982-90.
12. Tofts, P.S., et al., Estimating kinetic parameters from dynamic contrast-enhanced T(1)-weighted MRI of a diffusable tracer: standardized quantities and symbols. J Magn Reson Imaging, 1999. 10(3): p. 223-32.
13. Grade, M., et al., A neuroradiologist's guide to arterial spin labeling MRI in clinical practice. Neuroradiology, 2015. 57(12): p. 1181-202.
14. Gray, L.H., et al., The concentration of oxygen dissolved in tissues at the time of irradiation as a factor in radiotherapy. Br J Radiol, 1953. 26(312): p. 638-48.
15. Colliez, F., B. Gallez, and B.F. Jordan, Assessing Tumor Oxygenation for Predicting Outcome in Radiation Oncology: A Review of Studies Correlating Tumor Hypoxic Status and Outcome in the Preclinical and Clinical Settings. Front Oncol, 2017. 7: p. 10.
16. Fleming, I.N., et al., Imaging tumour hypoxia with positron emission tomography. Br J Cancer, 2015. 112(2): p. 238-50.
17. Jordan, B.F., et al., Complex relationship between changes in oxygenation status and changes in R*2: the case of insulin and NS-398, two inhibitors of oxygen consumption. Magn Reson Med, 2006. 56(3): p. 637-43.
18. Tatum, J.L., et al., Hypoxia: importance in tumor biology, noninvasive measurement by imaging, and value of its measurement in the management of cancer therapy. Int J Radiat Biol, 2006. 82(10): p. 699-757.
19. Gallez, B., C. Baudelet, and B.F. Jordan, Assessment of tumor oxygenation by electron paramagnetic resonance: principles and applications. NMR Biomed, 2004. 17(5): p. 240-62.
20. Zaiss, M. and P. Bachert, Chemical exchange saturation transfer (CEST) and MR Z-spectroscopy in vivo: a review of theoretical approaches and methods. Phys Med Biol, 2013. 58(22): p. R221-69.
21. van Zijl, P.C. and N.N. Yadav, Chemical exchange saturation transfer (CEST): what is in a name and what isn't? Magn Reson Med, 2011. 65(4): p. 927-48.
22. Zhou, J., et al., Practical data acquisition method for human brain tumor amide proton transfer (APT) imaging. Magn Reson Med, 2008. 60(4): p. 842-9.
23. Mehrabian, H., et al., Differentiation between Radiation Necrosis and Tumor Progression Using Chemical Exchange Saturation Transfer. Clin Cancer Res, 2017.
24. Dula, A.N., et al., Optimization of 7-T chemical exchange saturation transfer parameters for validation of glycosaminoglycan and amide proton transfer of fibroglandular breast tissue. Radiology, 2015. 275(1): p. 255-61.
25. de Certaines, J.D., et al., In vivo 31P MRS of experimental tumours. NMR Biomed, 1993. 6(6): p. 345-65.
26. de Graaf, R., in vivo NMR Spectroscopy; Principles and Techniques. Second edtion2008: John Wiley & Sons Ltd. 570.
27. Khlebnikov, V., et al., 31P MRSI studies in patients with cancer., in Annual Reports on NMR Spectroscopy, G.A. Webb, Editor 2016, Academic Press: Oxford. p. 319-368.
28. Wijnen, J.P. and D.W.J. Klomp, Advances in Magnetic Resonance Spectroscopy, in PET Clin2013.
29. Glunde, K., et al., Magnetic resonance spectroscopy in metabolic and molecular imaging and diagnosis of cancer. Chem Rev, 2010. 110(5): p. 3043-59.
30. Podo, F., Tumour phospholipid metabolism. NMR Biomed, 1999. 12(7): p. 413-39.
31. Khlebnikov, V., et al., 31P MRSI studies in patients with cancer, in Annual Repors on NMR Spectroscopy, W.G. A., Editor 2016, Academic Press: Oxford. p. 319-368.
32. Nelson, S.J., Multivoxel magnetic resonance spectroscopy of brain tumors. Mol Cancer Ther, 2003. 2(5): p. 497-507.
33. Kobus, T., et al., Mapping of prostate cancer by 1H MRSI. NMR Biomed, 2014. 27(1): p. 39-52.
34. van Laarhoven, H.W., et al., Prediction of chemotherapeutic response of colorectal liver metastases with dynamic gadolinium-DTPA-enhanced MRI and localized 19F MRS pharmacokinetic studies of 5-fluorouracil. NMR Biomed, 2007. 20(2): p. 128-40.
35. van Gorp, J.S., et al., (19)F MRSI of capecitabine in the liver at 7 T using broadband transmit-receive antennas and dual-band RF pulses. NMR Biomed, 2015. 28(11): p. 1433-42.
36. Nensa, F., et al., Clinical applications of PET/MRI: current status and future perspectives. Diagn Interv Radiol, 2014. 20(5): p. 438-47.
37. Glunde, K., A.P. Pathak, and Z.M. Bhujwalla, Molecular-functional imaging of cancer: to image and imagine. Trends Mol Med, 2007. 13(7): p. 287-97.
38. Pillai, M.R., et al., Radiolabeled enzyme inhibitors and binding agents targeting PSMA: Effective theranostic tools for imaging and therapy of prostate cancer. Nucl Med Biol, 2016. 43(11): p. 692-720.
39. Breeman, W.A., et al., Overview of Development and Formulation of (1)(7)(7)Lu-DOTA-TATE for PRRT. Curr Radiopharm, 2016. 9(1): p. 8-18.
40. Carollo, A., S. Papi, and M. Chinol, Lutetium-177 Labeled Peptides: The European Institute of Oncology Experience. Curr Radiopharm, 2016. 9(1): p. 19-32.
41. Ray, P., et al., Imaging tri-fusion multimodality reporter gene expression in living subjects. Cancer Res, 2004. 64(4): p. 1323-30.
42. Gilad, A.A., et al., Artificial reporter gene providing MRI contrast based on proton exchange. Nat Biotechnol, 2007. 25(2): p. 217-9.
Figures