Analysis: Tissue & Signal Models
1Centre d'Imagerie Biomédicale, Ecole Polytechnique Fédérale de Lausanne, Switzerland
Synopsis
The diffusion signal provides unique, but indirect information about tissue microstructure. In this course, we will examine two main avenues for diffusion analysis: signal representations and tissue models. The former render the signal behavior without any assumptions about the tissue structure and thus produce sensitive but unspecific metrics (e.g. fractional anisotropy from DTI). For models, a theoretical expression of the diffusion signal in a given geometry (assumed to describe the tissue well) is fit to the data and characteristic parameters of the geometry are extracted. This approach should yield more specific metrics but is also more challenging to implement correctly.
Target audience
Physicists
and clinicians who use, or would like to use, metrics derived from diffusion
acquisitions.Objectives
This lecture aims at:
- Clarifying the distinction between signal representations and biophysical tissue models
- Providing guidelines for the proper estimation of the diffusion tensor, kurtosis tensor and derived metrics; and spelling out the pros and cons of such metrics
- Providing a brief overview of currently popular brain tissue models and explaining their underlying assumptions, utility and limitations
- Reviewing the most recent developments in tissue modeling and validation effort.
Signal representations vs tissue models
The diffusion signal provides unique, but indirect information about tissue microstructure. In this course, we will examine two main avenues for diffusion analysis: signal representations and tissue models.
Signal representations are convenient ways of describing the signal as a function of diffusion weighting, without making any assumption about the underlying medium in which diffusion is taking place, i.e. the tissue.
The most widespread signal representation is the cumulant expansion (Basser et al., 1994; Jensen et al., 2005), which relies on an expansion of the logarithm of the signal in polynomials up to a given order in b – i.e. a Taylor series. Diffusion tensor imaging (DTI) is thus an expansion up to the first order in b, and diffusion kurtosis imaging (DKI) up to the second order in b.
Other basis functions, such as Hermite functions (Ozarslan et al., 2013), can be used to expand the diffusion signal.
Another approach consists in considering that the signal stems from a continuum of diffusion coefficients associated with a probability density function ρ (Bennett et al., 2003; Yablonskiy et al., 2003): $$\frac{S}{S_{0}}=\int_{0}^{\infty}\rho\left(D\right)e^{-bD}dD$$
The distribution of diffusion coefficients can be characterized by an inverse Laplace transform, or using a stretched exponential: $$$\frac{S}{S_{0}}=\exp\left\{-\left(b\cdot DDC\right)^{\alpha}\right\}$$$, where α is the stretching parameter and DDC the distributed diffusion coefficient.
These signal representations can be used for any type of tissue. The metrics obtained, such as fractional anisotropy (from DTI) or mean kurtosis (from DKI) are sensitive markers of tissue change with development, aging and/or pathology. However, they are not specific and thus do not allow a depiction of the underlying microstructure.
In order to gain specificity, i.e. obtain estimates of cell density, axon orientation dispersion, etc., a modeling step needs to be introduced. In modeling, a theoretical expression of the diffusion signal in a given geometry (assumed to describe the tissue well) is fit to the data and characteristic parameters of that geometry are extracted.
Most modeling efforts have so far been deployed for the brain white and/or gray matter (Alexander et al., 2010; Assaf et al., 2004; Fieremans et al., 2011; Jespersen et al., 2007; Novikov et al., 2016; Panagiotaki et al., 2012; Zhang et al., 2012), but one can also cite diffusion models in the muscle (Fieremans et al., 2017), prostate (Panagiotaki et al., 2015), or gliomas (Reynaud et al., 2016).
The main issues with modeling – which remain to be resolved – are the appropriateness of the selected model to describe the tissue and the biological validity of their underlying assumptions, as well as the instability of the fitting procedure involved in parameter estimation.
The cumulant expansion: DTI & DKI
The cumulant expansion can be written as: $$\ln\frac{S}{S_{0}}=-bD+\frac{1}{6}\left(bD\right)^{2}K+\cdot\cdot\cdot$$ where D is the diffusion coefficient and K the kurtosis. Or, in tensor form: $$\ln\frac{S}{S_{0}}=-b\sum_{i,j=1}^3g_{i}g_{j}D_{ij}+\frac{1}{6}\left(b\overline{D}\right)^{2}\sum_{i,j,k,l=1}^3g_{i}g_{j}g_{k}g_{l}W_{ijkl}+\cdot\cdot\cdot$$ where D is the rank-2 diffusion tensor, W the rank-4 kurtosis tensor, and g is the direction of the applied diffusion weighting.
At low diffusion weighting (bD << 1/K), the expansion can be truncated at the lowest order term ($$$\ln\left(S/S_{0}\right)=-bD$$$). In order to estimate the 6 independent components of the diffusion tensor (Basser et al., 1994), the minimal required data is one b = 0 (unweighted) image and 6 non collinear directions on one shell. The choice of the shell b-value is a trade-off between accuracy (by which it should be as low as possible, since one should be in the low diffusion weighting regime) and precision (by which is should be as high as admittedly possible to limit the impact of noise) (Jones, 2010). This trade-off value is typically around b = 1 ms/μm2 for the brain, in vivo.
It is important to stress that DTI does not assume the diffusion in the underlying tissue to be Gaussian (K = 0); it is simply a regime where the second order term is negligible, i.e. bD needs to be small enough relative to 1/K.
Metrics derived from the diffusion tensor, such as mean diffusivity and fractional anisotropy are used extensively for brain and body tissue characterization in a wide variety of conditions (Mori, 2007; Van Hecke et al., 2016).
Estimating the kurtosis of the diffusion probability distribution function – or by how much it deviates from a Gaussian distribution – can provide information about tissue complexity that is complementary to DTI metrics (Jensen et al., 2005). The estimation of the 15 independent components of the kurtosis tensor in addition to the 6 of the diffusion tensor thus requires a minimal acquisition of one b = 0 (unweighted) image and 21 measurements distributed over 2 shells. The maximum b-value that balances accuracy and precision of the kurtosis estimation is typically around b = 2 ms/μm2 for the brain, in vivo. It is also noteworthy that fitting the kurtosis tensor greatly improves the accuracy of the diffusion tensor estimation (Veraart et al., 2011).
DKI metrics, such as mean kurtosis, are increasingly used as complementary biomarkers to DTI metrics in a large panel of applications (Jensen and Helpern, 2010; Rosenkrantz et al., 2015).
In principle, the expansion can be pushed to even higher orders in b, as long as the b-range is within the radius of convergence of the series (Kiselev and Il'yasov, 2007).
Moreover, there are brain tissue models whose parameters are directly derived from 2nd, 4th and 6th order cumulants/moments (Fieremans et al., 2011; Novikov et al., 2015; Novikov et al., 2016), as we will see in the next section.
Brain tissue models
As explained previously, modeling of the diffusion signal relies on distinct assumptions about tissue structure and is by design specific to a particular tissue type, in contrast to the signal representations. In this section, we will focus on brain tissue models, which have become increasingly popular due to the promise of microstructural specificity. The examples taken below are by no means a comprehensive list of existing models, but give an overview of what is often used in the literature.
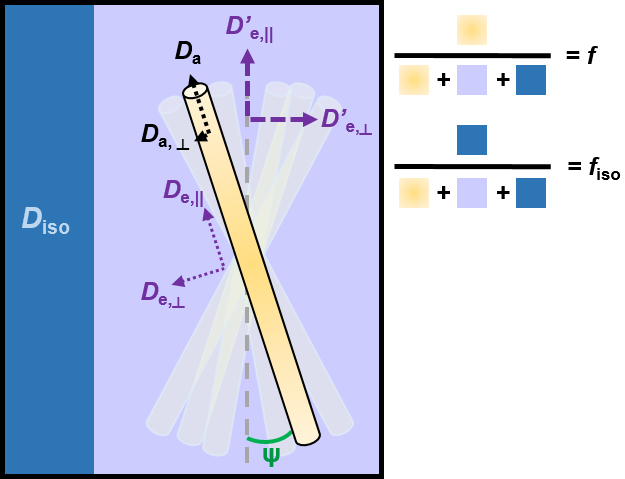
While each model has their own specific assumptions, they have many common features (Figure 1). The tissue is separated into two or three non-exchanging compartments, each weighted by their volume fraction.
- The intra-axonal compartment is modeled as a collection of long narrow cylinders, with a given orientation distribution function (ODF). Da is the parallel diffusivity inside the axons, and if applicable, Da,⊥ is the radial diffusivity inside the axons (in the long time limit regime, Da,⊥= 0 and axons are modeled as sticks)
- The extra-axonal compartment is usually modeled as a Gaussian anisotropic compartment characterized by axial and radial diffusivities De,|| and De,⊥.
- When accounted for, the cerebrospinal fluid (CSF) compartment is modeled as Gaussian isotropic, characterized by a diffusivity Diso = 3 μm2/ms at body temperature.
The total number of parameters that need to be estimated quickly increases with model complexity. The fitting procedure – usually non-linear – thus becomes highly sensitive to the initialization values and the noise (Jelescu et al., 2016a). In order to alleviate this problem, most models impose additional constraints to stabilize the fit.
Thus, CHARMED (Assaf et al., 2004) imposes Da,⊥= 1 μm2/ms and the fiber diameter distribution. The time-dependence of the extra-axonal space is also neglected, while it has recently been shown that it dominates, in fact, the time-dependence of the diffusion signal (Burcaw et al., 2015).
NODDI (Zhang et al., 2012) is a long time limit model where axons are modeled as sticks with an ODF characterized by a Watson or Bingham distribution (Tariq et al., 2016). This model effectively fixes all diffusivities (Da = De,|| = 1.7 μm2/ms and $$$D_{e,\perp}=D_{e,\parallel}\left(1-f\right)$$$) and fits the compartment volume fractions and orientation distribution. This has two implications: a) the estimated parameters are biased by the imposed diffusivity values, which may be off from the ground truth; b) any change with development or pathology will be reflected as a change in geometry, while diffusivities can in fact also be altered.
WMTI (Fieremans et al., 2011) is also a long time limit model, which assumes the axons are almost perfectly aligned (effectively that the kurtosis of the collection of sticks is negligible) and neglects the CSF compartment. The model parameters ($$$f, D_{a}, D_{e,\parallel}, D_{e,\perp}$$$) are obtained from a direct calculation based on diffusion and kurtosis tensors, which means the model effectively uses linear fitting (tensor estimation). This model has a limited range of applicability since it assumes single, highly coherent white matter bundles. Recently, a model dubbed LEMONADE (Novikov et al., 2015; Novikov et al., 2016) relates signal moments up to the 6th order (instead of cumulants up to the 4th order) to a much more general two-compartment model.
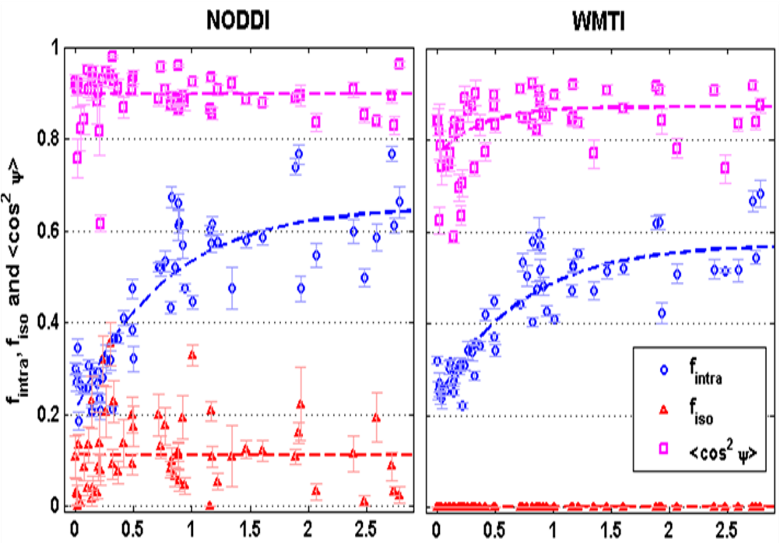
The application of both NODDI and WMTI to human brain development data has highlighted that the choice of a model, via their simplifying assumptions, necessarily impacts the quantitative estimate of the biophysical parameters that are sought (Figure 2) (Jelescu et al., 2015) – thus modeling is currently somewhat short of its promise of specificity.
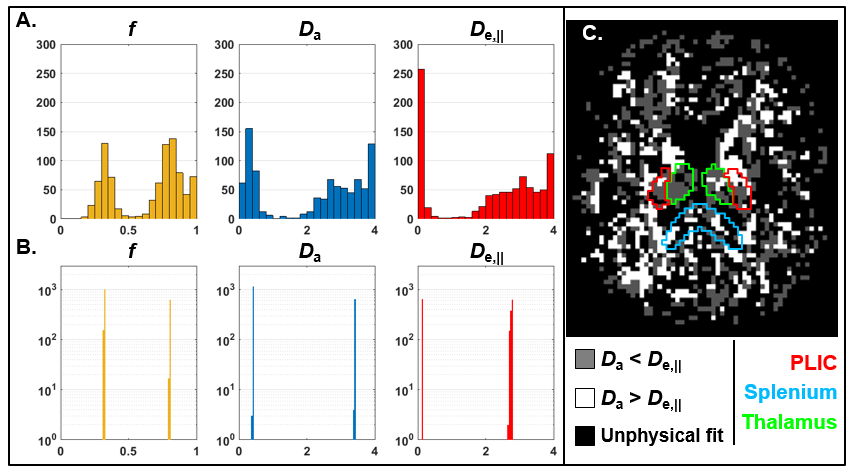
Furthermore, recent work has also shown that a two-compartment model of diffusion bears two mathematical solutions, both of which are biologically plausible (Figure 3) (Jelescu et al., 2016a; Novikov et al., 2016). Briefly, establishing which solution is valid boils down to establishing whether $$$D_{a}<D_{e,\parallel}$$$ or $$$D_{a}>D_{e,\parallel}$$$. We will expand on this in the next section.
Validation of microstructural features
Since the diffusion signal is an indirect way of estimating microstructural features such as axonal density, etc., it is paramount that these estimates, and thus the models used to obtain them, be validated, ideally by a fully orthogonal measurement.
Axonal volume fractions
Axonal volume fractions, or cell densities, estimated using diffusion models generally show good correlations with estimates stemming from electron microscopy and/or immunohistochemistry (Jelescu et al., 2016b; Jespersen et al., 2010; Stikov et al., 2015; Wang et al., 2011). The limitation of this comparison is that electron or light microscopy do not necessarily represent a ground truth, as slides can also be distorted and fractions altered by fixation. Moreover, the volume of tissue analyzed under electron or light microscopy is generally far inferior to the MRI voxel, thus the tissue block should ideally be sampled at a sufficient number of well-distributed locations.
Orientation distribution
Emerging high throughput 3D microscopy techniques have enabled a positive comparison between microscopy-derived and diffusion MRI-derived fiber orientations (Khan et al., 2015; Schilling et al., 2016). However, the estimation of the “spread” of axon orientations about the main fiber orientations is more challenging. Current estimates using microscopy place it at about 15 – 18° in human (Budde and Annese, 2013; Ronen et al., 2014) and up to 34° in rat (Leergaard et al., 2010) corpus callosum. This gives a reference to compare diffusion MRI estimations to, but ideally such a microscopy validation should accompany each diffusion MRI model, and possibly in multiple white matter areas, including voxels containing multiple fibers. Further research in this direction is highly encouraged.
Diffusivities
Compartment diffusivities estimated using diffusion MRI modeling are perhaps the most challenging to cross-validate. Indeed, there are no other means of measuring the self-diffusion coefficient of water than NMR itself. A few methods for determining, at least, whether Da < De,|| or the opposite can be mentioned. First, isotropic diffusion weighting suggests the isotropic kurtosis is very low almost everywhere in the brain (except the thalamus) (Dhital et al., 2015; Szczepankiewicz et al., 2015), and thus that the traces of the compartment tensors should be similar – this would be compatible with the Da > De,|| solution. Double diffusion encoding in the spinal cord showed however that the axial diffusivity does not change with or without prior suppression of the extra-axonal signal and thus Da ≈ De,|| (Skinner et al., 2016). Extracellular signal suppression using a gadolinium-based contrast agent in the rat corpus callosum revealed a slight but non-significant increase in axial diffusivity (Jelescu et al., 2017), which would suggest Da > De,|| but remains to be confirmed.
Acknowledgements
No acknowledgement found.References
Alexander, D.C., Hubbard, P.L., Hall, M.G., Moore, E.A., Ptito, M., Parker, G.J.M., Dyrby, T.B., 2010. Orientationally invariant indices of axon diameter and density from diffusion MRI. Neuroimage 52, 1374-1389.
Assaf, Y., Freidlin, R.Z., Rohde, G.K., Basser, P.J., 2004. New modeling and experimental framework to characterize hindered and restricted water diffusion in brain white matter. Magn Reson Med 52, 965-978.
Basser, P.J., Mattiello, J., LeBihan, D., 1994. Estimation of the effective self-diffusion tensor from the NMR spin echo. J Magn Reson B 103, 247-254.
Bennett, K.M., Schmainda, K.M., Bennett, R.T., Rowe, D.B., Lu, H., Hyde, J.S., 2003. Characterization of continuously distributed cortical water diffusion rates with a stretched-exponential model. Magn Reson Med 50, 727-734.
Budde, M.D., Annese, J., 2013. Quantification of anisotropy and fiber orientation in human brain histological sections. Front Integr Neurosci 7, 3.
Burcaw, L.M., Fieremans, E., Novikov, D.S., 2015. Mesoscopic structure of neuronal tracts from time-dependent diffusion. Neuroimage 114, 18-37.
Dhital, B., Kellner, E., Reisert, M., Kiselev, V.G., 2015. Isotropic diffusion weighting provides insight on diffusion compartments in human brain white matter in vivo., Proc. Intl. Soc. Mag. Reson. Med. 23, Toronto, Canada, p. 2788.
Fieremans, E., Jensen, J.H., Helpern, J.A., 2011. White matter characterization with diffusional kurtosis imaging. Neuroimage 58, 177-188.
Fieremans, E., Lemberskiy, G., Veraart, J., Sigmund, E.E., Gyftopoulos, S., Novikov, D.S., 2017. In vivo measurement of membrane permeability and myofiber size in human muscle using time-dependent diffusion tensor imaging and the random permeable barrier model. NMR Biomed 30.
Jelescu, I.O., Kunz, N., Da Silva, A.R., Gruetter, R., 2017. Intra- and extra-axonal axial diffusivities in the white matter: which one is faster? , Proc. Intl. Soc. Mag. Reson. Med. 25, Honolulu, HI, USA, p. 281.
Jelescu, I.O., Veraart, J., Adisetiyo, V., Milla, S.S., Novikov, D.S., Fieremans, E., 2015. One diffusion acquisition and different white matter models: How does microstructure change in human early development based on WMTI and NODDI? Neuroimage 107, 242-256.
Jelescu, I.O., Veraart, J., Fieremans, E., Novikov, D.S., 2016a. Degeneracy in model parameter estimation for multi-compartmental diffusion in neuronal tissue. NMR Biomed 29, 33-47.
Jelescu, I.O., Zurek, M., Winters, K.V., Veraart, J., Rajaratnam, A., Kim, N.S., Babb, J.S., Shepherd, T.M., Novikov, D.S., Kim, S.G., Fieremans, E., 2016b. In vivo quantification of demyelination and recovery using compartment-specific diffusion MRI metrics validated by electron microscopy. Neuroimage 132, 104-114.
Jensen, J.H., Helpern, J.A., 2010. MRI quantification of non-Gaussian water diffusion by kurtosis analysis. NMR Biomed 23, 698-710.
Jensen, J.H., Helpern, J.A., Ramani, A., Lu, H., Kaczynski, K., 2005. Diffusional kurtosis imaging: the quantification of non-gaussian water diffusion by means of magnetic resonance imaging. Magn Reson Med 53, 1432-1440.
Jespersen, S.N., Bjarkam, C.R., Nyengaard, J.R., Chakravarty, M.M., Hansen, B., Vosegaard, T., Ostergaard, L., Yablonskiy, D., Nielsen, N.C., Vestergaard-Poulsen, P., 2010. Neurite density from magnetic resonance diffusion measurements at ultrahigh field: comparison with light microscopy and electron microscopy. Neuroimage 49, 205-216.
Jespersen, S.N., Kroenke, C.D., Ostergaard, L., Ackerman, J.J., Yablonskiy, D.A., 2007. Modeling dendrite density from magnetic resonance diffusion measurements. Neuroimage 34, 1473-1486.
Jones, D.K., 2010. Precision and accuracy in diffusion tensor magnetic resonance imaging. Top Magn Reson Imaging 21, 87-99.
Khan, A.R., Cornea, A., Leigland, L.A., Kohama, S.G., Jespersen, S.N., Kroenke, C.D., 2015. 3D structure tensor analysis of light microscopy data for validating diffusion MRI. Neuroimage 111, 192-203.
Kiselev, V.G., Il'yasov, K.A., 2007. Is the "biexponential diffusion" biexponential? Magn Reson Med 57(3), 464-469.
Leergaard, T.B., White, N.S., de Crespigny, A., Bolstad, I., D'Arceuil, H., Bjaalie, J.G., Dale, A.M., 2010. Quantitative histological validation of diffusion MRI fiber orientation distributions in the rat brain. PLoS One 5, e8595.
Mori, S., 2007. Chapter 11 - Application studies. Introduction to Diffusion Tensor Imaging. Elsevier Science B.V., Amsterdam, pp. 149-161.
Novikov, D.S., Jelescu, I.O., Fieremans, E., 2015. From diffusion signal moments to neurite diffusivities, volume fraction and orientation distribution: An exact solution., Proc. Intl. Soc. Mag. Reson. Med. 23, Toronto, Canada, p. 469.
Novikov, D.S., Veraart, J., Jelescu, I.O., Fieremans, E., 2016. Mapping orientational and microstructural metrics of neuronal integrity with in vivo diffusion MRI. https://arxiv.org/abs/1609.09144.
Ozarslan, E., Koay, C.G., Shepherd, T.M., Komlosh, M.E., Irfanoglu, M.O., Pierpaoli, C., Basser, P.J., 2013. Mean apparent propagator (MAP) MRI: a novel diffusion imaging method for mapping tissue microstructure. Neuroimage 78, 16-32.
Panagiotaki, E., Chan, R.W., Dikaios, N., Ahmed, H.U., O'Callaghan, J., Freeman, A., Atkinson, D., Punwani, S., Hawkes, D.J., Alexander, D.C., 2015. Microstructural characterization of normal and malignant human prostate tissue with vascular, extracellular, and restricted diffusion for cytometry in tumours magnetic resonance imaging. Invest Radiol 50, 218-227.
Panagiotaki, E., Schneider, T., Siow, B., Hall, M.G., Lythgoe, M.F., Alexander, D.C., 2012. Compartment models of the diffusion MR signal in brain white matter: a taxonomy and comparison. Neuroimage 59, 2241-2254.
Reynaud, O., Winters, K.V., Hoang, D.M., Wadghiri, Y.Z., Novikov, D.S., Kim, S.G., 2016. Pulsed and oscillating gradient MRI for assessment of cell size and extracellular space (POMACE) in mouse gliomas. NMR Biomed 29, 1350-1363.
Ronen, I., Budde, M., Ercan, E., Annese, J., Techawiboonwong, A., Webb, A., 2014. Microstructural organization of axons in the human corpus callosum quantified by diffusion-weighted magnetic resonance spectroscopy of N-acetylaspartate and post-mortem histology. Brain Struct Funct 219, 1773-1785.
Rosenkrantz, A.B., Padhani, A.R., Chenevert, T.L., Koh, D.M., De Keyzer, F., Taouli, B., Le Bihan, D., 2015. Body diffusion kurtosis imaging: Basic principles, applications, and considerations for clinical practice. J Magn Reson Imaging 42, 1190-1202.
Schilling, K., Janve, V., Gao, Y., Stepniewska, I., Landman, B.A., Anderson, A.W., 2016. Comparison of 3D orientation distribution functions measured with confocal microscopy and diffusion MRI. Neuroimage 129, 185-197.
Skinner, N.P., Kurpad, S.N., Schmit, B.D., Tugan Muftuler, L., Budde, M.D., 2016. Rapid in vivo detection of rat spinal cord injury with double-diffusion-encoded magnetic resonance spectroscopy. Magn Reson Med.
Stikov, N., Campbell, J.S., Stroh, T., Lavelee, M., Frey, S., Novek, J., Nuara, S., Ho, M.K., Bedell, B.J., Dougherty, R.F., Leppert, I.R., Boudreau, M., Narayanan, S., Duval, T., Cohen-Adad, J., Picard, P.A., Gasecka, A., Cote, D., Pike, G.B., 2015. In vivo histology of the myelin g-ratio with magnetic resonance imaging. Neuroimage 118, 397-405.
Szczepankiewicz, F., Lasic, S., van Westen, D., Sundgren, P.C., Englund, E., Westin, C.F., Stahlberg, F., Latt, J., Topgaard, D., Nilsson, M., 2015. Quantification of microscopic diffusion anisotropy disentangles effects of orientation dispersion from microstructure: applications in healthy volunteers and in brain tumors. Neuroimage 104, 241-252.
Tariq, M., Schneider, T., Alexander, D.C., Gandini Wheeler-Kingshott, C.A., Zhang, H., 2016. Bingham-NODDI: Mapping anisotropic orientation dispersion of neurites using diffusion MRI. Neuroimage 133, 207-223.
Van Hecke, W., Emsell, L., Sunaert, S., 2016. Diffusion Tensor Imaging - A Practical Handbook, 1 ed. Springer-Verlag New York.
Veraart, J., Poot, D.H., Van Hecke, W., Blockx, I., Van der Linden, A., Verhoye, M., Sijbers, J., 2011. More accurate estimation of diffusion tensor parameters using diffusion Kurtosis imaging. Magn Reson Med 65, 138-145.
Wang, Y., Wang, Q., Haldar, J.P., Yeh, F.C., Xie, M., Sun, P., Tu, T.W., Trinkaus, K., Klein, R.S., Cross, A.H., Song, S.K., 2011. Quantification of increased cellularity during inflammatory demyelination. Brain 134, 3590-3601.
Yablonskiy, D.A., Bretthorst, G.L., Ackerman, J.J., 2003. Statistical model for diffusion attenuated MR signal. Magn Reson Med 50, 664-669.
Zhang, H., Schneider, T., Wheeler-Kingshott, C.A., Alexander, D.C., 2012. NODDI: practical in vivo neurite orientation dispersion and density imaging of the human brain. Neuroimage 61, 1000-1016.
Figures