Introduction to IVIM
1DRF, NeuroSpin, Gif-sur-Yvette, France
Synopsis
Intravoxel Incoherent Motion (IVIM) refers to translational movements which within a given voxel and during the measurement time present a distribution of speeds in orientation and/or amplitude. The IVIM concept has been used to estimate perfusion in tissues as blood flow in randomly oriented capillaries mimics a pseudo-diffusion process. IVIM-based perfusion MRI, which does not require contrast agents, has gained momentum recently, especially in the field oncology. In this introduction the basic principles, models, technical requirements and limitations inherent to IVIM-based perfusion MRI, as well as new, non-perfusion applications of IVIM MRI, such as virtual MR Elastography will be outlined.
The IVIM Concept
“Intravoxel Incoherent Motion (IVIM) refers to translational movements which within a given voxel and during the measurement time present a distribution of speeds in orientation and/or amplitude” (1-3). Although the 1988 article explains how perfusion and diffusion effects can be disentangled in IVIM MRI, IVIM does not specifically refer to blood microcirculation (1), as other IVIM sources are possible. The idea to get perfusion images from diffusion MRI, without the need for contrast agents, was found ground-breaking at the time with a laudatory accompanying editorial from Thomas Dixon (4), but remained controversial due to technical insufficiencies of the MRI scanners of the time, although several groups validated the concept (5-6). It was not until the coupling with EPI that IVIM became available in the clinical world (7). Still, the first clinical validation, in the liver, came only 20 years after the introduction of the concept (8). More recently, IVIM MRI has experienced a remarkable revival for applications throughout the body (9), especially in the field of cancer imaging. The first reason is certainly that vast progress has been made in MRI scanner hardware and sequence developments, satisfying the signal:noise ratio hungry IVIM method. The second reason is that diffusion MRI has become a pillar of clinical MRI, part of many protocols, so that one may get IVIM/perfusion images “for free” together with the diffusion images, without the need for additional scanning time. The third reason is that IVIM MRI does not involve contrast agents, serving as an interesting alternative to perfusion MRI in some patients with contraindications for contrast agents, patients with renal failure at risk for Nephrogenic Systemic Fibrosis (NSF) or children or patients requiring multiple MRI scans which may lead to the accumulation of gadolinium deposits in the brain or other organs (10-11).IVIM and Perfusion MRI
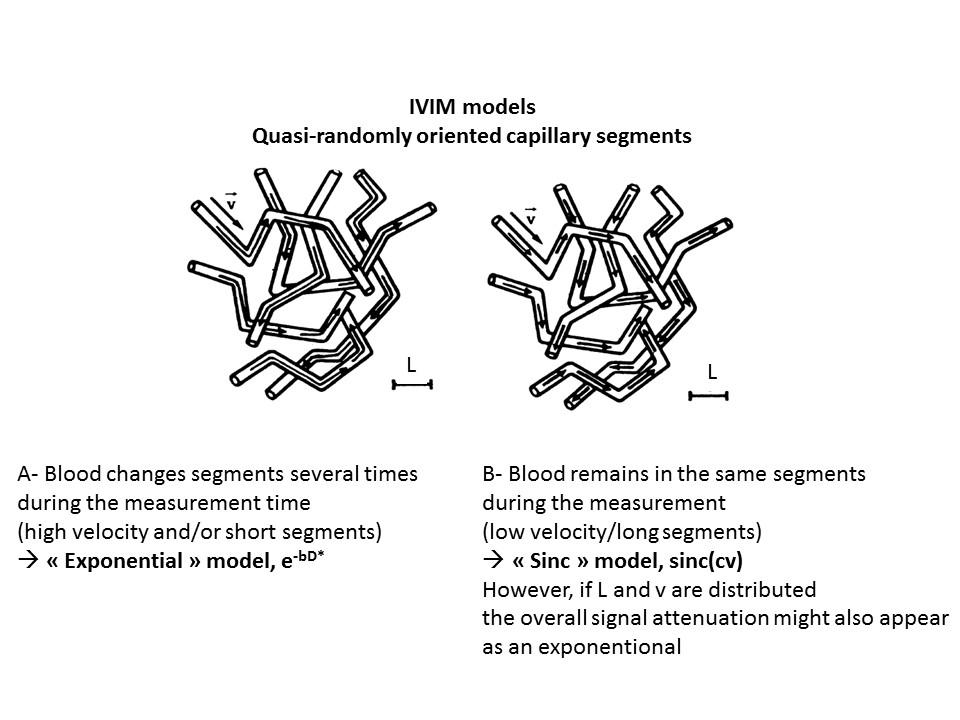
When blood spins change vessels many times during the diffusion encoding time flow of blood water in randomly oriented capillaries (at voxel level) may mimic a random walk (“pseudo-diffusion”) (2), which results in a signal attenuation in the presence of the diffusion-encoding gradient pulses (Fig.1). The attenuation of the MRI signal due to all IVIM effects can be expressed as:
S(b)=SoIVIM FIVIM(b) + Sodiff Fdiff(b) [1]
Sodiff and SoIVIM are the fractions of pure diffusion and IVIM components, respectively, with Sodiff=So(1- fIVIM) and SoIVIM=So fIVIM where fIVIM is the flowing blood volume fraction and So is the overall signal when b = 0. Fdiff(b) and FIVIM(b) are, respectively, the diffusion and perfusion-related IVIM signal attenuation as a function of diffusion weighting (b value). With the pseudo-diffusion model the expression for is exponential:
FIVIM(b)=exp[-b(Db+D*) [2]
where Db is the diffusion coefficient of water in blood and D*, so-called the “pseudo-diffusion coefficient”, which can be approximated by D*=Lv/6 (2-3), L and v being the mean capillary straight segment length and mean blood flow velocity in the voxel capillary network, respectively. It should be noted that tissue and blood contribute to So with different T2 and T1-weighting, which means that fIVIM values might be sometimes misestimated, depending on TE, on the voxel vessel oxygen content and on the field strength Bo, an issue when comparing literature results.
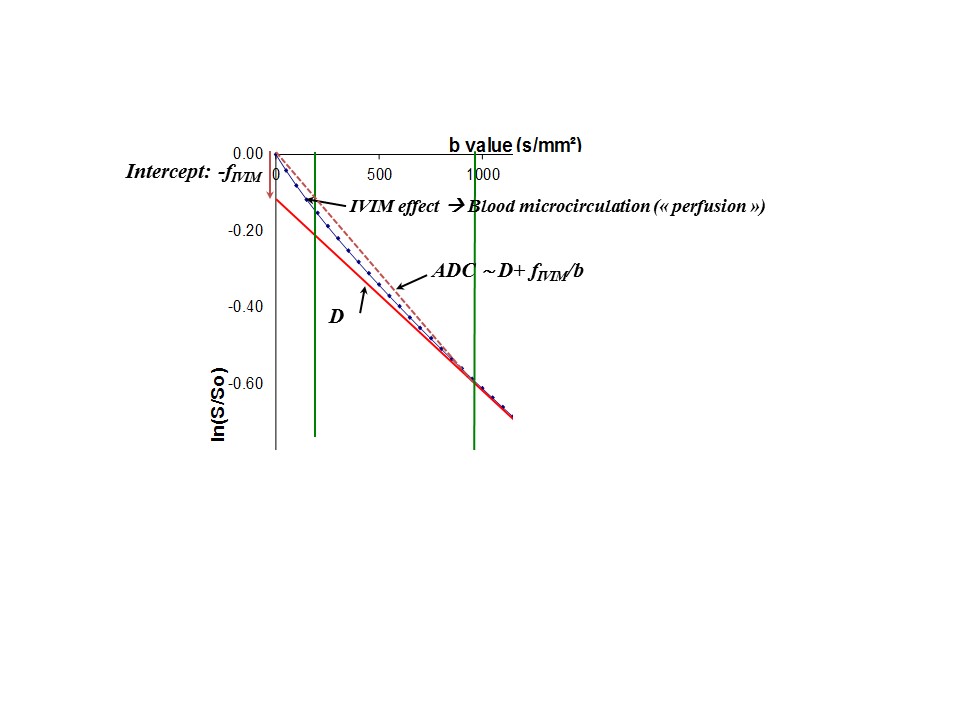
Given that the pseudo diffusion coefficient, D*, is much higher than the water molecular diffusion in tissues, D, at high b-values the MR signal originates solely from water molecules diffusing in the extravascular compartment (pure tissue diffusion effect). At small b-values, both diffusion and flowing blood effects are present and the Apparent Diffusion Coefficient, ADC, obtained by using very low b value signals is higher than when using larger values. As fIVIM is usually small, one has ADC~D+fIVIM/b when using 2 low b values (in addition to b=0) (2). Indeed, the first perfusion-driven IVIM measurements were obtained using 2 b values (100 and 200s/mm²) (2) (Fig.2). .
When stronger gradient hardware became available high b values could be reached and, to increase robustness, diffusion and perfusion parameters are now most often estimated by fitting signals collected at a large series of b values with Eq.[1] using a 2-step process, first fitting the experimental data for high b-values (above 200-600 s/mm²) with a diffusion model (Gaussian or non-Gaussian) for Fdiff(b) and then fitting the residual signal after removing the diffusion component at low b values (12).
Main Applications
IVIM fMRI - Back in the middle of the 1980s, the idea beyond IVIM imaging was to produce maps of brain perfusion to investigate brain function, given the known coupling between neural activation, metabolism, and blood flow. It did not work very well due to the technical limitations of MRI scanners at that time, and IVIM-based fMRI did not survive competing methods that appeared at about the same time, first one based on contrast agents (14) and almost immediately thereafter one based on the blood oxygen level dependant (BOLD) concept (15). BOLD was clearly much easier to implement and much more sensitive for fMRI. Later work, however, has proven the validity of the IVIM concept, with an increase in the IVIM perfusion parameters in brain activated regions, and the potential of the approach to aid in our understanding of the different vascular contributions to the fMRI signal (15-17). Interestingly, IVIM MRI has also been used in the context of fMRI in a negative way. A limitation of BOLD fMRI is its spatial resolution, as flow increase in somewhat large arteries or veins feed or drain large neuronal territories. By inserting “IVIM” gradient pulses in the MRI sequence (corresponding to low b-values), one may crush the contribution of the largest vessels (with high D* values associated with fast flow) in the BOLD signal and improve the spatial resolution of the activation maps (18-20). Several groups have relied on this trick, though not always considering referring to the IVIM concept. This IVIM concept has also been borrowed to improve other applications, for instance, arterial spin labeling (ASL) (23-24), or to suppress signal from extracellular flowing fluid in perfused cell systems (25).
Clinical applications - The leading clinical application for IVIM perfusion MRI is today oncology. Many articles have been published and a review is out of the scope of this introduction (see, for instance, Ref#9). Suffice to say that perfusion imaging, such as IVIM MRI is an important modality to evaluate neoangiogenesis, microvasculature heterogeneity for diagnosis, as well as to monitor treatment efficacy of chemo- or radiotherapy, and especially effectiveness of antiangiogenic drugs or vascular targeting agents. In the liver Yamada et al (8) showed the potential of IVIM MRI to differentiate HCC (hepatocellular carcinoma), hemangioma and cysts. Several studies have shown the potential of IVIM MRI for the evaluation of liver cirrhosis (26) or fibrosis (27), as well as for the tissue characterization of focal liver lesions (28). The IVIM perfusion fraction has been shown as a potential biomarker of NASH (nonalcoholic steatohepatitis) (29,30). Still, using ADC values solely for assessing hepatic lesions is likely to be challenging, as there is sometimes a considerable overlap between benign and malignant lesions and normal liver tissue (31-33). Beside, IVIM and diffusion MRIs in the liver is degraded by artifacts due to cardiac and respiratory motion (34) or to air in the adjacent stomach or colon. In the kidneys IVIM parameters seem to be more useful than diffusion parameters with the potential to predict the extent of deterioration in renal function (35): D* is in the renal cortex is significantly lower in both mild and severe renal dysfunction, while ADC values drop only in severe renal dysfunction. The perfusion fraction, fIVIM, and the tissue diffusivity have shown better diagnostic performance, separately, than the overall ADC for the discrimination of enhancing from non-enhancing renal lesions, with a good correlation between fIVIM and perfusion-related parameters using gadolinium-based contrast agents (36). Furthermore, histogram analyses of IVIM data have been shown useful for the discrimination of malignant and benign tumors, as well as renal tumor subtypes (37).
Models
Overall, there is a general consensus that the mono-exponential IVIM model is appropriate to fit experimental data at long diffusion times and it remains a reference for all IVIM clinical application studies. However, it might not be accurate at shorter time scales. At very short diffusion times, when blood remains in single, straight but randomly organized capillary segments, the signal attenuation can be modeled as a sinc function (2-3) (Fig.1):
FIVIM(c)= exp(-bDb) sinc (cv) [5]
where c is another pulse gradient factor, similar to the b factor. In the case of a pure pulsed-gradient spin-echo sequence with 2 pulses of length d separated by a time interval D one has c=(bD)1/2 when d<<D. In this very short diffusion time regimen D* can also be related to capillary blood velocity by calculating the Taylor expansion limited to the first orders of FIVIM(c), as D*=v²c²/(6b) (3), and does no longer depends on L as spins never get to probe the entire capillary segments. This sinc behavior has never been reported experimentally, however, event at short diffusion times, probably because the Gaussian distribution of blood velocities, v, in the voxel capillaries render Fivim(c) exponential anyway (42).
Kennan et al.(38) proposed a model based on a velocity autocorrelation function to cover intermediate situations between the two extreme regimens, mono-exponential and sinc. Arguing that the Gaussian phase approximation assumed by Kennan et al. is invalid in some cases, Wetscherek et al. (39) introduced another model based on normalized phase distributions. These two models assume that only flow in capillaries contributes to the IVIM signal. Noticing some disagreement between experimental data and the standard mono-exponential model, other authors have suggested models which take into account not only capillaries but all types of vessels (40-41). We recently introduced a bi-exponential IVIM model (not to be confounded with the bi-exponential model used sometimes to separate diffusion and IVIM effects), accounting for two different vascular pools with different blood velocities and geometries, as an alternative to the mono-exponential model (42). This bi-exponential model fits the experimental data better than the standard mono-exponential model at short diffusion times.
It is also possible to establish a bridge between the parameters of the perfusion-driven IVIM model and those which have been used with classical perfusion measurements (43-44), for instance blood flow, BF, or mean transit time, MTT. It can be shown than, under some hypotheses, one has (44): fIVIM=BV/fw; MTT=Cl/6D*; BF=(6fw/LCl)fD* where fw is the MRI-visible water content fraction, Cl the total capillary length (from artery to vein), MTT the mean transit time, BF the blood flow. The link between classical perfusion and IVIM resides in the capillary geometry, and more especially in two lengths; the capillary segment length and the total capillary length. Those quantities are constant for a given tissue, so that relative perfusion or blood flow can potentially be estimated from the product fD*. Furthermore, the mean transit time could also be evaluated (at least in a relative manner) from D* without the need for any arterial "input function" and will not include the transit time of blood in the large feeding vessels.
In any case, there is still the need for a deeper insight into the IVIM concept and a clearer understanding of what is seeing to fully gain the benefit of the IVIM based perfusion imaging in the clinical setting. The flowing blood fraction, fIVIM, appears correlated with vessel density (45-46), and recent studies have shown a correlation between fIVIM and CBV (Cerebral Blood Volume) derived from DSC (Dynamic Susceptibility Contrast) MRI in gliomas (47-48), or DCE (Dynamic Contrast-enhanced) derived parameters in renal tumors (49), head and neck tumors (50), or breast tumors. One also has to keep in mind that IVIM imaging has a differential sensitivity to vessel sizes, according to the range of b values which are used.
Technical aspects
An important issue is that MR imaging gradient pulses must be taken into account in the calculation of IVIM effects, as cross-terms between diffusion-encoding and imaging gradient pulses are often not negligible. This is the reason why the “b factor” was introduced as one of the cornerstones of IVIM and diffusion MRI from its conception (51). This is especially important for IVIM perfusion imaging as data must be collected at very low b values. For instance, the “b=0 value” is never available, as most manufacturers add crusher gradient pulses in all MRI sequences to clean signals (and images) from unwanted resonances, and the lowest achievable b values are sometimes as high as 15-20s/mm² or even higher. Instabilities in gradient amplifiers may also render low b values unreliable, sometimes up to b=50s/mm².
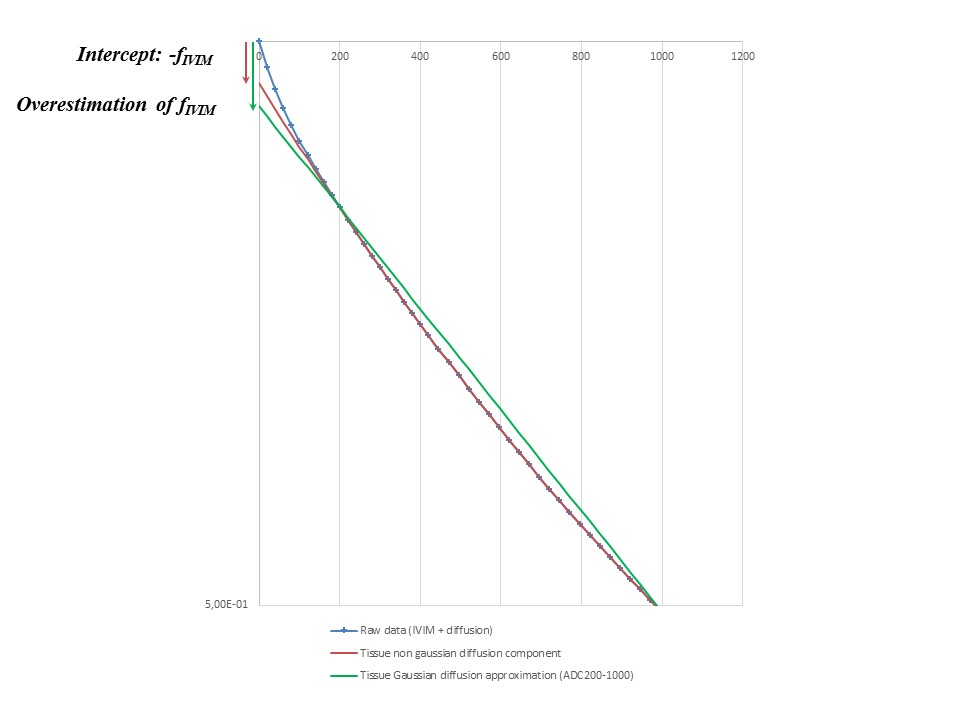
Another source of inaccuracy in IVIM measurements is the failure to take into account non-Gaussian diffusion. Non-Gaussian diffusion results in a curvature of Fdiff(b) (or plot of ln(S) versus b) which appears when using b values higher than a few hundred s/mm². As a consequence, a linear model for Fdiff (simple ADC) will erroneously generate an IVIM effect (fIVIM>0), even if there is no perfusion in the tissue (Fig.3).
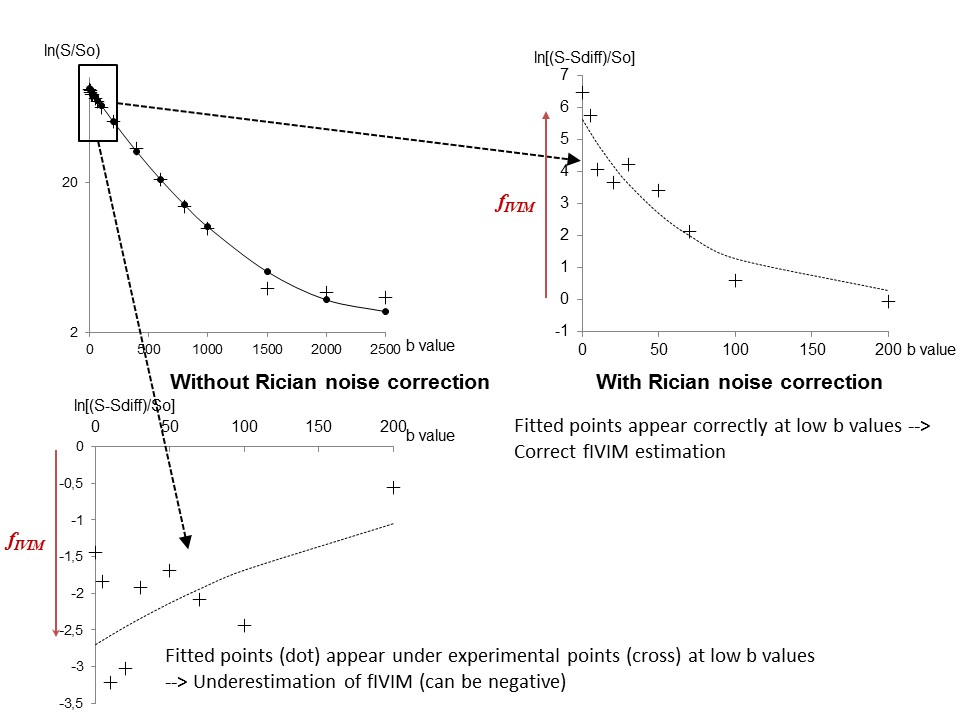
Another important confounding effect is the Rician noise observable at high b values when the signal reached the noise floor (12). It might look counterintuitive but signal behavior at high b values has a strong impact on IVIM parameter estimates, although the IVIM effects is present only at very low b values Correction for non-Gaussian and possible Rician noise effects should be mandatory steps when fitting IVIM/diffusion MRI data. When using a 2-step processing algorithm one issue is to define the b value threshold above which perfusion IVIM effects can be neglected. To do so one should appreciate how much IVIM effects are left above that threshold, which depends on the data signal:noise ratio. Taking fIVIM=5% and D*=20mm²/s the IVIM contribution at b=200s/mm² is 1/1000 of the total signal, completely negligible. However, with fIVIM =25%, D*=5mm²/s there is still more than 2% signal left at b=400s/mm². The b value threshold should be chosen according to the expected level of perfusion (low in the brain, higher in the body) and the overall signal:noise ratio of the data.
Non perfusion-driven IVIM MRI
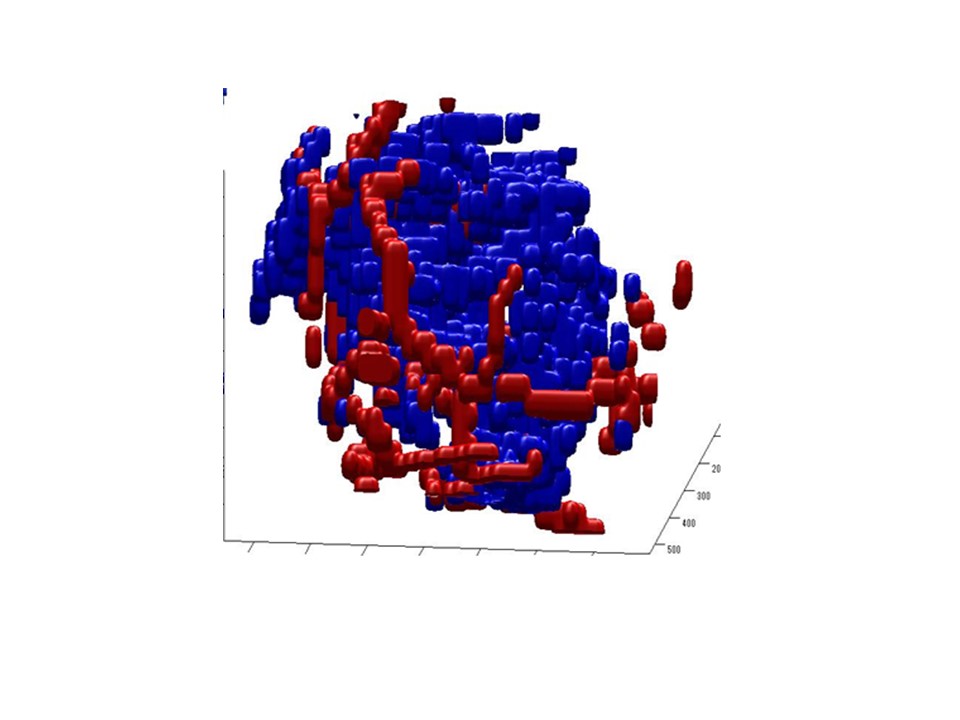
IVIM MRI is sensitive to any fluid flow, not only blood, as long as there is an intravoxel distribution. In the brain CSF flow is clearly visible on IVIM images (1) and might be a confound when evaluation perfusion in the brain cortex. Vascular and tubular flow may be difficult to disentangle in some tissues, such as the kidney (52). Active transport resulting from glandular secretion (breast ducts, salivary glands and pancreas) may also be difficult to separate from microcapillary perfusion. Beside capillaries, in somewhat larger blood vessels laminar flow (or even more turbulent flow) leads to a distribution of velocities within the vessel lumen and in some cases to an IVIM signal attenuation much larger than the perfusion-driven IVIM effect. This feature can be successfully exploited to identify vessel containing voxels and generate IVIM 3D angiograms without the need for contrast agents.
Another emerging field of application is IVIM MR Elastography (MRE). With standard MRE propagating shear waves through tissues lead to microscopic tissue displacements resulting in phase shifts in the presence of magnetic gradient pulses, which can be exploited to estimate tissue shear stiffness. However, those mechanically-induced phase shifts are spatially distributed and results in a phase dispersion in each voxel and an amplitude signal attenuation, that is an IVIM effect (53). The degree of attenuation in those IVIM images would depend on the tissue elasticity and on the choice of acquisition parameters (mainly IVIM b value, vibration frequency and amplitude of the propagating shear waves), creating interesting contrast to highlight lesions which are most often associated with a high stiffness. This approach is challenging, though, with standard MRE as the wave amplitude dampens very quickly when waves penetrate tissues. However, this elasticity-driven IVIM contrast can be emulated virtually once the tissue elasticity is known, which can be obtained directly from diffusion MRI without the need to use any mechanical vibration device (54). This new elasticity-driven IVIM contrast can then be emulated to any ranges of virtual vibration frequencies and amplitudes not limited by MRE or MRI hardware capacities.
Acknowledgements
No acknowledgement found.References
1. Le Bihan D, Breton E, Lallemand D, Grenier P, Cabanis E, Laval Jeantet M. MR Imaging of intravoxel incoherent motions: application to diffusion and perfusion in neurologic disorders. Radiology 161:401–407, 1986.
2. Le Bihan D, Breton E, Lallemand D, Aubin ML, Vignaud J, Laval-Jeantet M. Separation of diffusion and perfusion in intravoxel incoherent motion MR imaging. Radiology 168: 497-505, 1988.
3. Le Bihan D. Magnetic resonance imaging of perfusion. MRM 14: 283-292, 1990.
4. Dixon WT (1988). Separation of diffusion and perfusion in intravoxel incoherent motion MR imaging: a modest proposal with tremendous potential. Radiology 168:566–567.
5. Pickens DR III, Jolgren DL, Lorenz CH, Creasy JL, Price RR. Magnetic resonance perfusion/diffusion imaging of the excised dog kidney. Invest Radiol 27:287–292, 1992.
6. Neil JJ, Bosch CS, Ackerman JJ (1994). An evaluation of the sensitivity of the intravoxel incoherent motion (IVIM) method of blood flow measurement to changes in cerebral blood flow. MRM 32:60–65.
7. Turner R, Le Bihan D, Maier J, Vavrek R, Hedges LK, Pekar J. Echo-planar imaging of intravoxel incoherent motions. Radiology 177:407–414, 1990.
8. Yamada I, Aung W, Himeno Y, Nakagawa T, Shibuya H. Diffusion coefficients in abdominal organs and hepatic lesions: evaluation with intravoxel incoherent motion echo- planar MR imaging. Radiology 210:617–623, 1999.
9. Iima M, Le Bihan D. Clinical Intravoxel Incoherent Motion and Diffusion MR Imaging: Past, Present, and Future. Radiology 278: 13-32, 2016.
10. Kanda T, Ishii K, Kawaguchi H, Kitajima K, Takenaka D. High signal intensity in the dentate nucleus and globus pallidus on unenhanced T1-weighted MR images: relationship with increasing cumulative dose of a gadolinium-based contrast material. Radiology 270: 834-841, 2014.
11. Kanda T, Osawa M, Oba H, Toyoda K, Kotoku J, Haruyama T et al. High Signal Intensity in Dentate Nucleus on Unenhanced T1-weighted MR Images: Association with Linear versus Macrocyclic Gadolinium Chelate Administration. Radiology 275: 803-809, 2015.
12. Iima M, Yano K, Kataoka M, Umehana M, Murata K, Kanao S et al. Quantitative non-Gaussian diffusion and intravoxel incoherent motion magnetic resonance imaging: differentiation of malignant and benign breast lesions. Invest Radiol 50: 205-211, 2015.
13. Belliveau JW, Kennedy DN, McKinstry RC, Burchbinder BR, Weisskoff RM, Cohen MS, Vevea JM, Brady TJ, Rosen BR, Buchbinder BR. Functional mapping of the human visual cortex by magnetic resonance imaging. Science 254:716–719, 1991.
14. Ogawa S, Tank DW, Menon RS, Ellerman JM, Kim SG, Merkle H, Ugurbil K. Intrinsic signal changes accompanying sensory stimulation—functional brain mapping with magnetic resonance imaging. Proc Natl Acad Sci U S A 89:5951–5955, 1992.
15. Song AW, Wong EC, Tan SG, Hyde JS. Diffusion weighted fMRI at 1.5 T. MRM 35:155–158, 1996.
16. Gangstead SL, Song AW. On the timing characteristics of the apparent diffusion coefficient contrast in fMRI. MRM 48:385–388, 2002.
17. Jin T, Zhao F, Kim SG. Sources of functional apparent diffusion coefficient changes investigated by diffusion-weighted spin-echo fMRI. MRM 56:1283–1292, 2006.
18. Boxerman JL, Bandettini PA, Kwong KK, Baker JR, Davis TL, Rosen BR, Weisskoff RM. The intravascular contribution of fMRI signal change: Monte Carlo modeling and diffusion-weighted studies in vivo. MRM 34:4–10, 1995.
19. Lee SP, Silva AC, Kim SG. Comparison of diffusion-weighted high-resolution CBF and spin-echo BOLD fMRI at 9.4 T. MRM 47:736–741, 2002.
20. Duong TQ, Yacoub E, Adriany G, Hu XP, Ugurbil K, Kim SG (2003). Microvascular BOLD contribution at 4 and 7 T in the human brain: gradient-echo and spin-echo fMRI with suppression of blood effects. MRM 49:1019–1027, 2003.
21. Song AW, Li T. Improved spatial localization based on flow-moment-nulled and intra-voxel incoherent motion-weighted fMRI. NMR Biomed 16:137–143, 2003.
22. Michelich CR, Song AW, MacFall JR. Dependence of gradient-echo and spin-echo BOLD fMRI at 4 T on diffusion weighting. NMR Biomed 19:566–572, 2006.
23. Silva AC, Williams DS, Koretsky AP (1997). Evidence for the exchange of arterial spin-labeled water with tissue water in rat brain from diffusion-sensitized measurements of perfusion. MRM 38:232–237, 1997
24. Kim T, Kim SG. Quantification of cerebral arterial blood volume using arterial spin labeling with intravoxel incoherent motion-sensitive gradients. MRM 55:1047–1057, 2006.
25. Van Zijl PCM, Moonen CTW, Faustino P, Pekar J, Kaplan O, Cohen JS. Complete separation of intracellular and extracellular information in NMR spectra of perfused cells by diffusion-weighted spectroscopy. Proc Natl Acad Sci U S A 88:3228–3232, 1991.
26. Luciani A, Vignaud A, Cavet M, et al. Liver Cirrhosis: Intravoxel Incoherent Motion MR Imaging—Pilot Study 1. Radiology. 249(3):891-899, 2008.
27. Patel J, Sigmund EE, Rusinek H, Oei M, Babb JS, Taouli B. Diagnosis of cirrhosis with intravoxel incoherent motion diffusion MRI and dynamic contrast-enhanced MRI alone and in combination: Preliminary experience. JMRI 31(3):589-600, 2010.
28. Yoon JH, Lee JM, Yu MH, Kiefer B, Han JK, Choi BI. Evaluation of hepatic focal lesions using diffusion-weighted MR imaging: Comparison of apparent diffusion coefficient and intravoxel incoherent motion-derived parameters. JMRI 39(2):276-285, 2014.
29. Joo I, Lee JM, Yoon JH, Jang JJ, Han JK, Choi BI. Nonalcoholic fatty liver disease: Intravoxel incoherent motion diffusion-weighted MR imaging—an experimental study in a rabbit model. Radiology. 270(1):131-140, 2014.
30. Van Beers BE. Science to Practice: Can We Diagnose Nonalcoholic Steatohepatitis with Intravoxel Incoherent Motion Diffusion-weighted MR Imaging? Radiology 270(1):1-2, 2014.
31. Anderson SW, Barry B, Soto J, Ozonoff A, O'Brien M, Jara H. Characterizing non-gaussian, high b-value diffusion in liver fibrosis: Stretched exponential and diffusional kurtosis modeling. JMRI 39(4):827-834, 2014.
32. Taouli B, Vilgrain V, Dumont E, Daire J-L, Fan B, Menu Y. Evaluation of Liver Diffusion Isotropy and Characterization of Focal Hepatic Lesions with Two Single-Shot Echo-planar MR Imaging Sequences: Prospective Study in 66 Patients. Radiology. 226(1):71-78, 2003.
33. Koh D, Scurr E, Collins D, et al. Colorectal hepatic metastases: quantitative measurements using single-shot echo-planar diffusion-weighted MR imaging. European Radiology. 16(9):1898-1905, 2006.
34. Lee Y, Lee SS, Kim N, et al. Intravoxel incoherent motion diffusion-weighted MR imaging of the liver: effect of triggering methods on regional variability and measurement repeatability of quantitative parameters. Radiology 274(2):405-415, 2015.
35. Ichikawa S, Motosugi U, Ichikawa T, Sano K, Morisaka H, Araki T. Intravoxel incoherent motion imaging of the kidney: alterations in diffusion and perfusion in patients with renal dysfunction. Magnetic Resonance Imaging 31(3):414-417, 2013.
36. Chandarana H, Lee VS, Hecht E, Taouli B, Sigmund EE. Comparison of biexponential and monoexponential model of diffusion weighted imaging in evaluation of renal lesions: preliminary experience. Invest Radiol. 46(5):285-291, 2011.
37. Gaing B, Sigmund EE, Huang WC, et al. Subtype differentiation of renal tumors using voxel-based histogram analysis of intravoxel incoherent motion parameters. Invest Radiol. 50(3):144-152, 2015. 38. Kennan RP, Gao JH, Zhong J, Gore JC. A general model of microcirculatory blood flow effects in gradient sensitized MRI. Med Phys 21: 539-545, 1994.
39. Wetscherek A, Stieltjes B, Laun FB. Flow-compensated intravoxel incoherent motion diffusion imaging. MRM 74: 410-419, 2015.
40. Henkelman RM, Neil JJ, Xiang QS. A quantitative interpretation of IVIM measurements of vascular perfusion in the rat brain. MRM 32: 464-469, 1994.
41. Duong TQ, Kim SG. In vivo MR measurements of regional arterial and venous blood volume fractions in intact rat brain. MRM 43: 393-402, 2000.
42. Fournet G, Li JR, Cerjanic AM, Sutton BP, Ciobanu L, Le Bihan D. A two-pool model to describe the IVIM cerebral perfusion. J Cereb Blood Flow Metab. Nov 30. pii: 0271678X16681310, 2016. [Epub ahead of print]
43. Henkelman RM. Does IVIM measure classical perfusion? MRM 16:470–475, 1990.
44. Le Bihan D, Turner R. The capillary network: a link between IVIM and classical perfusion. MRM 27:171–178, 1992.
45. Iima M, Reynaud O, Tsurugizawa T, et al. Characterization of Glioma Microcirculation and Tissue Features Using Intravoxel Incoherent Motion Magnetic Resonance Imaging in a Rat Brain Model. Invest Radiol. 49(7):485-490, 2014.
46. Lee HJ, Rha SY, Chung YE, et al. Tumor perfusion-related parameter of diffusion-weighted magnetic resonance imaging: Correlation with histological microvessel density. MRM 71(4):1554-1558, 2014.
47. Federau C, Meuli R, O'Brien K, Maeder P, Hagmann P. Perfusion measurement in brain gliomas with intravoxel incoherent motion MRI. American Journal of Neuroradiology 35(2):256-262, 2014.
48. Kim H, Suh C, Kim N, Choi C-G, Kim S. Histogram analysis of intravoxel incoherent motion for differentiating recurrent tumor from treatment effect in patients with glioblastoma: initial clinical experience. American Journal of Neuroradiology 35(3):490-497, 2014.
49. Chandarana H, Kang SK, Wong S, et al. Diffusion-weighted intravoxel incoherent motion imaging of renal tumors with histopathologic correlation. Invest Radiol. 47(12):688-696, 2012.
50. Fujima N, Yoshida D, Sakashita T, et al. Intravoxel incoherent motion diffusion-weighted imaging in head and neck squamous cell carcinoma: assessment of perfusion-related parameters compared to dynamic contrast-enhanced MRI. Magnetic Resonance Imaging. 32(10):1206-1213, 2014.
51. Le Bihan D, Breton E. Imagerie de diffusion in-vivo par résonance magnétique nucléaire. Comptes-Rendus de l'Académie des Sciences. 93(5):27-34, 1985.
52. Notohamiprodjo M, Chandarana H, Mikheev A, et al. Combined intravoxel incoherent motion and diffusion tensor imaging of renal diffusion and flow anisotropy. MRM 73(4):1526-1532, 2015.
53. Glaser K.J., Felmlee JP, Manduca A, Ehman RL. Shear stiffness estimation using intravoxel phase dispersion in magnetic resonance elastography. MRM 50:1256-1265, 2003.
54. Le Bihan D, Ichikawa S, Motosugu U. IVIM virtual MR elastography of the liver, Proceedings, ISMRM meeting 2017.
Figures