QSM Software Demo
1UC Berkeley, berkeley, CA, United States
Synopsis
Quantitative susceptibility mapping (QSM) and susceptibility tensor imaging (STI) are two recently developed imaging methods for quantifying tissue’s magnetic property. Magnetic susceptibility offers a new contrast for high-resolution anatomical imaging; it further provides important information on tissue’s chemical composition, especially myelin and iron, and white matter microstructures of the brain. However, processing QSM and STI still requires advanced technical expertise. The growing application and wider acceptance of this new technique has generated a need for a comprehensive software package that can easily perform all these analysis. Here, we have developed such a tool named “STI Suite”. This software is based on our previous works. In this Matlab-based software package, we have implemented the essential algorithms for phase processing, QSM, STI, and related analysis tools. To facilitate the dissemination and evaluation of these methods, we make STI Suite freely available at http://people.duke.edu/~cl160/ for non-commercial academic use. STI Suite contains both Matlab command-line functions and graphical user interfaces (GUIs) for phase processing, QSM, STI, and related visualization and ROI analysis tools.
STI Suite V3.0 – main GUI
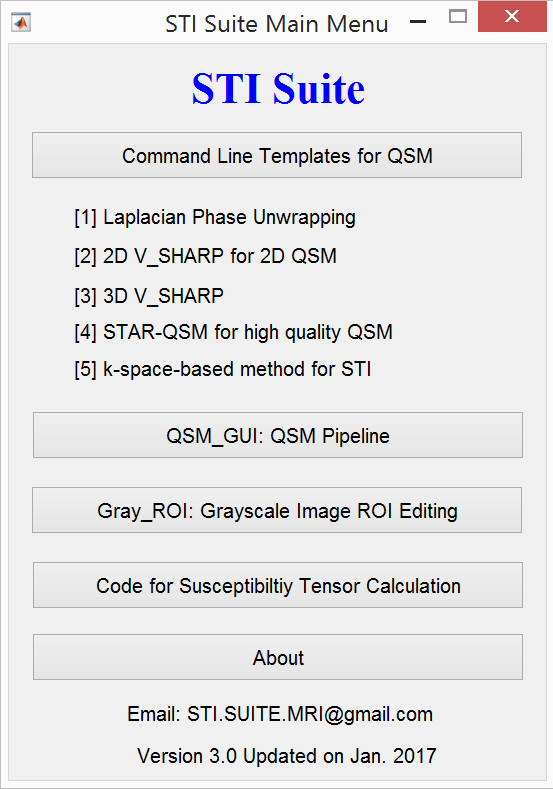
In this section, I will introduce the main user interface of STISuite V3.0 software package. It includes the demo data: 2D-EPI human brain data, multi-TEs 3D GRE human brain data, single echo 3D GRE human brain data, 3D GRE mouse brain data, 3D GRE human liver data in dicom format. In the source code folder, it includes the source code and the user manuals. The main GUI contains Command line templates for STISuite functions, i.e., Laplacian phase unwrapping (1-3), 2D phase processing for 2D QSM (4), 3D V_SHARP (1-3), STAR-QSM (5) for high quality QSM, iLSQR, and k-space -based method for susceptibility tensor reconstruction (6-7).STI Suite V3.0 – QSM GUI
The QSM GUI contains two main type of QSM reconstruction pipeline: 1) step-by-step processing, allows researchers to interact with each step result; 2) single button for QSM calculation, once the data is loaded into the software, click this single button would allow the final computed QSM.STI Suite V3.0 – ROI Editing
Once the QSM is computed by the QSM GUI, the saved QSM images using the button can be loaded to the ROI Editing GUI. With different colors and adjusted pencil size, it allows the researcher to draw the ROIs across multiple slices and multiple views. The mean susceptibility values over ROIs can be saved into the matlab workspace. This also allows ROIs for each volume of the 4th dimension. Save separate 3D ROIs for each volume.Acknowledgements
No acknowledgement found.References
1. Li W, Wu B, Avram AV, Liu C. Magnetic susceptibility anisotropy of human brain in vivo and its molecular underpinnings. Neuroimage. 2012;59(3):2088-2097.
2. Li W, Wu B, Liu C. Quantitative susceptibility mapping of human brain reflects spatial variation in tissue composition. Neuroimage. 2011;55:1645-1656.
3. Wu B, Li W, Guidon A, Liu C. Whole brain susceptibility mapping using compressed sensing. Magn Reson Med. 2012;67(1):137-147.
4. Wei H et al. Joint 2D and 3D phase processing for quantitative susceptibility mapping: application to 2D echo-planar imaging. NMR in Biomedicine. 2017 Apr;30(4). doi: 10.1002/nbm.3501.
5. Wei H et al. Streaking artifact reduction for quantitative susceptibility mapping of sources with large dynamic range. NMR in Biomedicine. 2015 Oct;28(10):1294-303. doi: 10.1002/nbm.3383.
6. Liu C. Susceptibility tensor imaging. Magn. Reson. Med. Jun 2010;63(6):1471-1477.
7. Liu C, Li W, Wu B, Jiang Y, Johnson GA. 3D Fiber tractography with susceptibility tensor imaging. Neuroimage. 2012;59(2):1290-1298.
Figures