QSM Software Demo
1Martinos Center for Biomedical Imaging, Charlestown, MA, United States
Synopsis
This demo focuses on the processing pipeline of the 2016 QSM Reconstruction Challenge. The aims of the Challenge were (i) to test the ability of QSM algorithms to recover the underlying susceptibility from phase data, and (ii) to provide a dataset that would help benchmark existing and future techniques. The demo begins with raw phase data and applies unwrapping, background removal, transmit phase mitigation, and finishes with fast dipole inversion techniques: TKD and Closed-Form L2-regularization. This replicates the pipeline through which the benchmark susceptibility maps were computed for the Challenge, and can serve as a starting point in future studies.
Introduction
Quantitative susceptibility mapping (QSM) allows the determination of tissue magnetic susceptibility in vivo that is highly sensitive to tissue composition (1–3). QSM solves an inverse field-to-source problem, calculating the underlying magnetic susceptibility distribution from gradient-echo (GRE) phase images (4). Over the last decade, a variety of algorithms have been developed for the solution of this inverse problem. We implemented the first QSM Reconstruction Challenge to compare and assess these available algorithms. The Challenge also aimed to provide a common dataset that would help benchmark both existing and future QSM algorithms. To this end, the input tissue phase data, reference susceptibility maps as well as a simple reconstruction script were made available at http://www.qsm2016.com/
In this software demo, we look behind the scenes and delve into the processing pipeline that went into computing the tissue phase data and benchmark susceptibility maps presented to the contestants. The demo package including data and code will be available at: http://bit.ly/2nxquZL
Acquisition
3D GRE with Wave-CAIPI acquisition was used to collect
images with 1.06 mm isotropic resolution (5,6). Sequence parameters were TE / TR = 25 / 35 ms, BW =
100 Hz/pixel and a 94-s acquisition time with 15-fold acceleration using a
Siemens 32 channel head coil. Roemer/SENSE coil combination was employed (7,8), which used sensitivities estimated from two
reference acquisitions made with head and body coil reception. Reconstruction
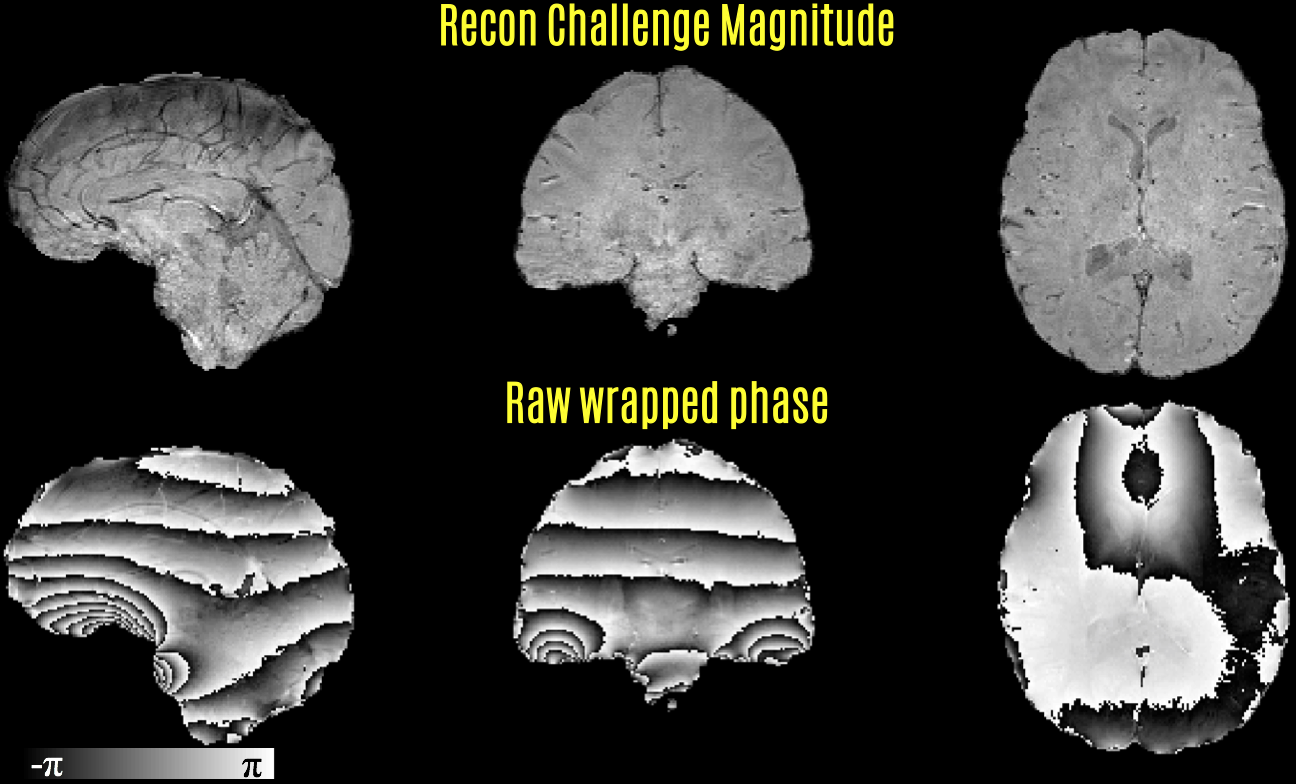
Reconstructed magnitude image was processed by Brain Extraction Tool (BET) (9) to create a brain mask. The mask was applied to the raw, wrapped phase image (Fig1). This was followed by Laplacian unwrapping (3,10) to remove 2π phase jumps (as implemented in the STI Suite http://people.duke.edu/~cl160/) and Laplacian Boundary Value (LBV) solution to remove phase contributions due to background sources (11) (as implemented in the MEDI Toolbox http://weill.cornell.edu/mri/pages/qsm.html) (Fig2). The final processing step was to fit a 4th order, 3D polynomial to the output of LBV. The fitted polynomial was then subtracted to mitigate residual contributions due to transmit phase (12), which propagated due to the Roemer/SENSE coil combination.
The resulting background- and transmit-removed tissue phase image was then processed with two simple and fast dipole inversion algorithms, (i) Thresholded K-space Division (TKD) (13,14), and (ii) Closed-Form L2-regularization (CF-L2) (15) (Fig3). This tissue phase and the two susceptibility maps were also provided to the contestants in the Challenge. The phase processing pipeline is now included in this demo package, which was not available in the Challenge source code.
Discussion & Conclusion
This demo aims to shed light into the phase processing that was applied in the 2016 QSM Reconstruction Challenge. Apart from brain masking that is a part of the FSL library (16), the script includes the necessary tools to estimate the tissue susceptibility beginning from the raw, wrapped GRE phase. This is achieved through fast phase processing and dipole inversion routines, which could serve as a starting point in future studies. Reconstruction performance can be improved using more involved algorithms e.g. (17–20), albeit at the cost of processing time.Acknowledgements
Contribution of co-organizers of the challenge, Drs. Ferdinand Schweser and Christian Langkammer, is gratefully acknowledged.References
1. de Rochefort L, Liu T, Kressler B, Liu J, Spincemaille P, Lebon V, Wu J, Wang Y. Quantitative susceptibility map reconstruction from MR phase data using bayesian regularization: Validation and application to brain imaging. Magn. Reson. Med. 2009;63. doi: 10.1002/mrm.22187.
2. Schweser F, Deistung A, Lehr BW, Reichenbach JR. Quantitative imaging of intrinsic magnetic tissue properties using MRI signal phase: An approach to in vivo brain iron metabolism? Neuroimage 2011;54:2789–2807. doi: 10.1016/j.neuroimage.2010.10.070.
3. Li W, Wu B, Liu C. Quantitative susceptibility mapping of human brain reflects spatial variation in tissue composition. Neuroimage 2011;55:1645–1656. doi: 10.1016/j.neuroimage.2010.11.088.
4. Marques JP, Bowtell R. Application of a Fourier-based method for rapid calculation of field inhomogeneity due to spatial variation of magnetic susceptibility. Concepts Magn. Reson. Part B Magn. Reson. Eng. 2005;25B:65–78. doi: 10.1002/cmr.b.20034.
5. Bilgic B, Xie L, Dibb R, et al. Rapid multi-orientation quantitative susceptibility mapping. Neuroimage 2016;125:1131–41. doi: 10.1016/j.neuroimage.2015.08.015.
6. Bilgic B, Gagoski BA, Cauley SF, Fan AP, Polimeni JR, Grant PE, Wald LL, Setsompop K. Wave-CAIPI for highly accelerated 3D imaging. Magn. Reson. Med. 2015;73:2152–2162. doi: 10.1002/mrm.25347.
7. Pruessmann KP, Weiger M, Scheidegger MB, Boesiger P. SENSE: Sensitivity encoding for fast MRI. Magn. Reson. Med. 1999;42:952–962.
8. Roemer PB, Edelstein WA, Hayes CE, Souza SP, Mueller OM. The NMR phased array. Magn. Reson. Med. 1990;16:192–225.
9. Smith SM. Fast robust automated brain extraction. Hum. Brain Mapp. 2002;17:143–155. doi: 10.1002/hbm.10062.
10. Schofield MA, Zhu Y. Fast phase unwrapping algorithm for interferometric applications. Opt. Lett. 2003;28:1194. doi: 10.1364/OL.28.001194.
11. Zhou D, Liu T, Spincemaille P, Wang Y. Background field removal by solving the Laplacian boundary value problem. NMR Biomed. 2014;27:312–319. doi: 10.1002/nbm.3064.
12. Schweser F, Atterbury M, Deistung A, Lehr BW, Sommer K, Reichenbach JR. Harmonic phase subtraction methods are prone to B1 background components. In: Proceedings of the International Society for Magnetic Resonance in Medicine. ; 2011. p. 2657.
13. Shmueli K, de Zwart JA, van Gelderen P, Li T-Q, Dodd SJ, Duyn JH. Magnetic susceptibility mapping of brain tissue in vivo using MRI phase data. Magn. Reson. Med. 2009;62:1510–1522. doi: 10.1002/mrm.22135.
14. Wharton S, Schäfer A, Bowtell R. Susceptibility mapping in the human brain using threshold-based k-space division. Magn. Reson. Med. 2010;63:1292–304. doi: 10.1002/mrm.22334.
15. Bilgic B, Chatnuntawech I, Fan AP, Setsompop K, Cauley SF, Wald LL, Adalsteinsson E. Fast image reconstruction with L2-regularization. J. Magn. Reson. Imaging 2013;0:1–11. doi: 10.1002/jmri.24365.
16. Jenkinson M, Beckmann CF, Behrens TEJ, Woolrich MW, Smith SM. FSL. Neuroimage 2012;62:782–790. doi: 10.1016/j.neuroimage.2011.09.015.
17. Schweser F, Sommer K, Deistung A, Reichenbach JR. Quantitative susceptibility mapping for investigating subtle susceptibility variations in the human brain. Neuroimage 2012;62:2083–100. doi: 10.1016/j.neuroimage.2012.05.067.
18. Bao L, Li X, Cai C, Chen Z, van Zijl P. Quantitative Susceptibility Mapping using Structural Feature based Collaborative Reconstruction (SFCR) in the Human Brain. IEEE Trans. Med. Imaging 2016;62:1–1. doi: 10.1109/TMI.2016.2544958.
19. Langkammer C, Bredies K, Poser B a., Barth M, Reishofer G, Fan AP, Bilgic B, Fazekas F, Mainero C, Ropele S. Fast quantitative susceptibility mapping using 3D EPI and total generalized variation. Neuroimage 2015;111:622–630. doi: 10.1016/j.neuroimage.2015.02.041.
20. Wu B, Li W, Guidon A, Liu C. Whole brain susceptibility mapping using compressed sensing. Magn. Reson. Med. 2012;67:137–147. doi: 10.1002/mrm.23000.
Figures