Microstructural Effect on Susceptibility
Synopsis
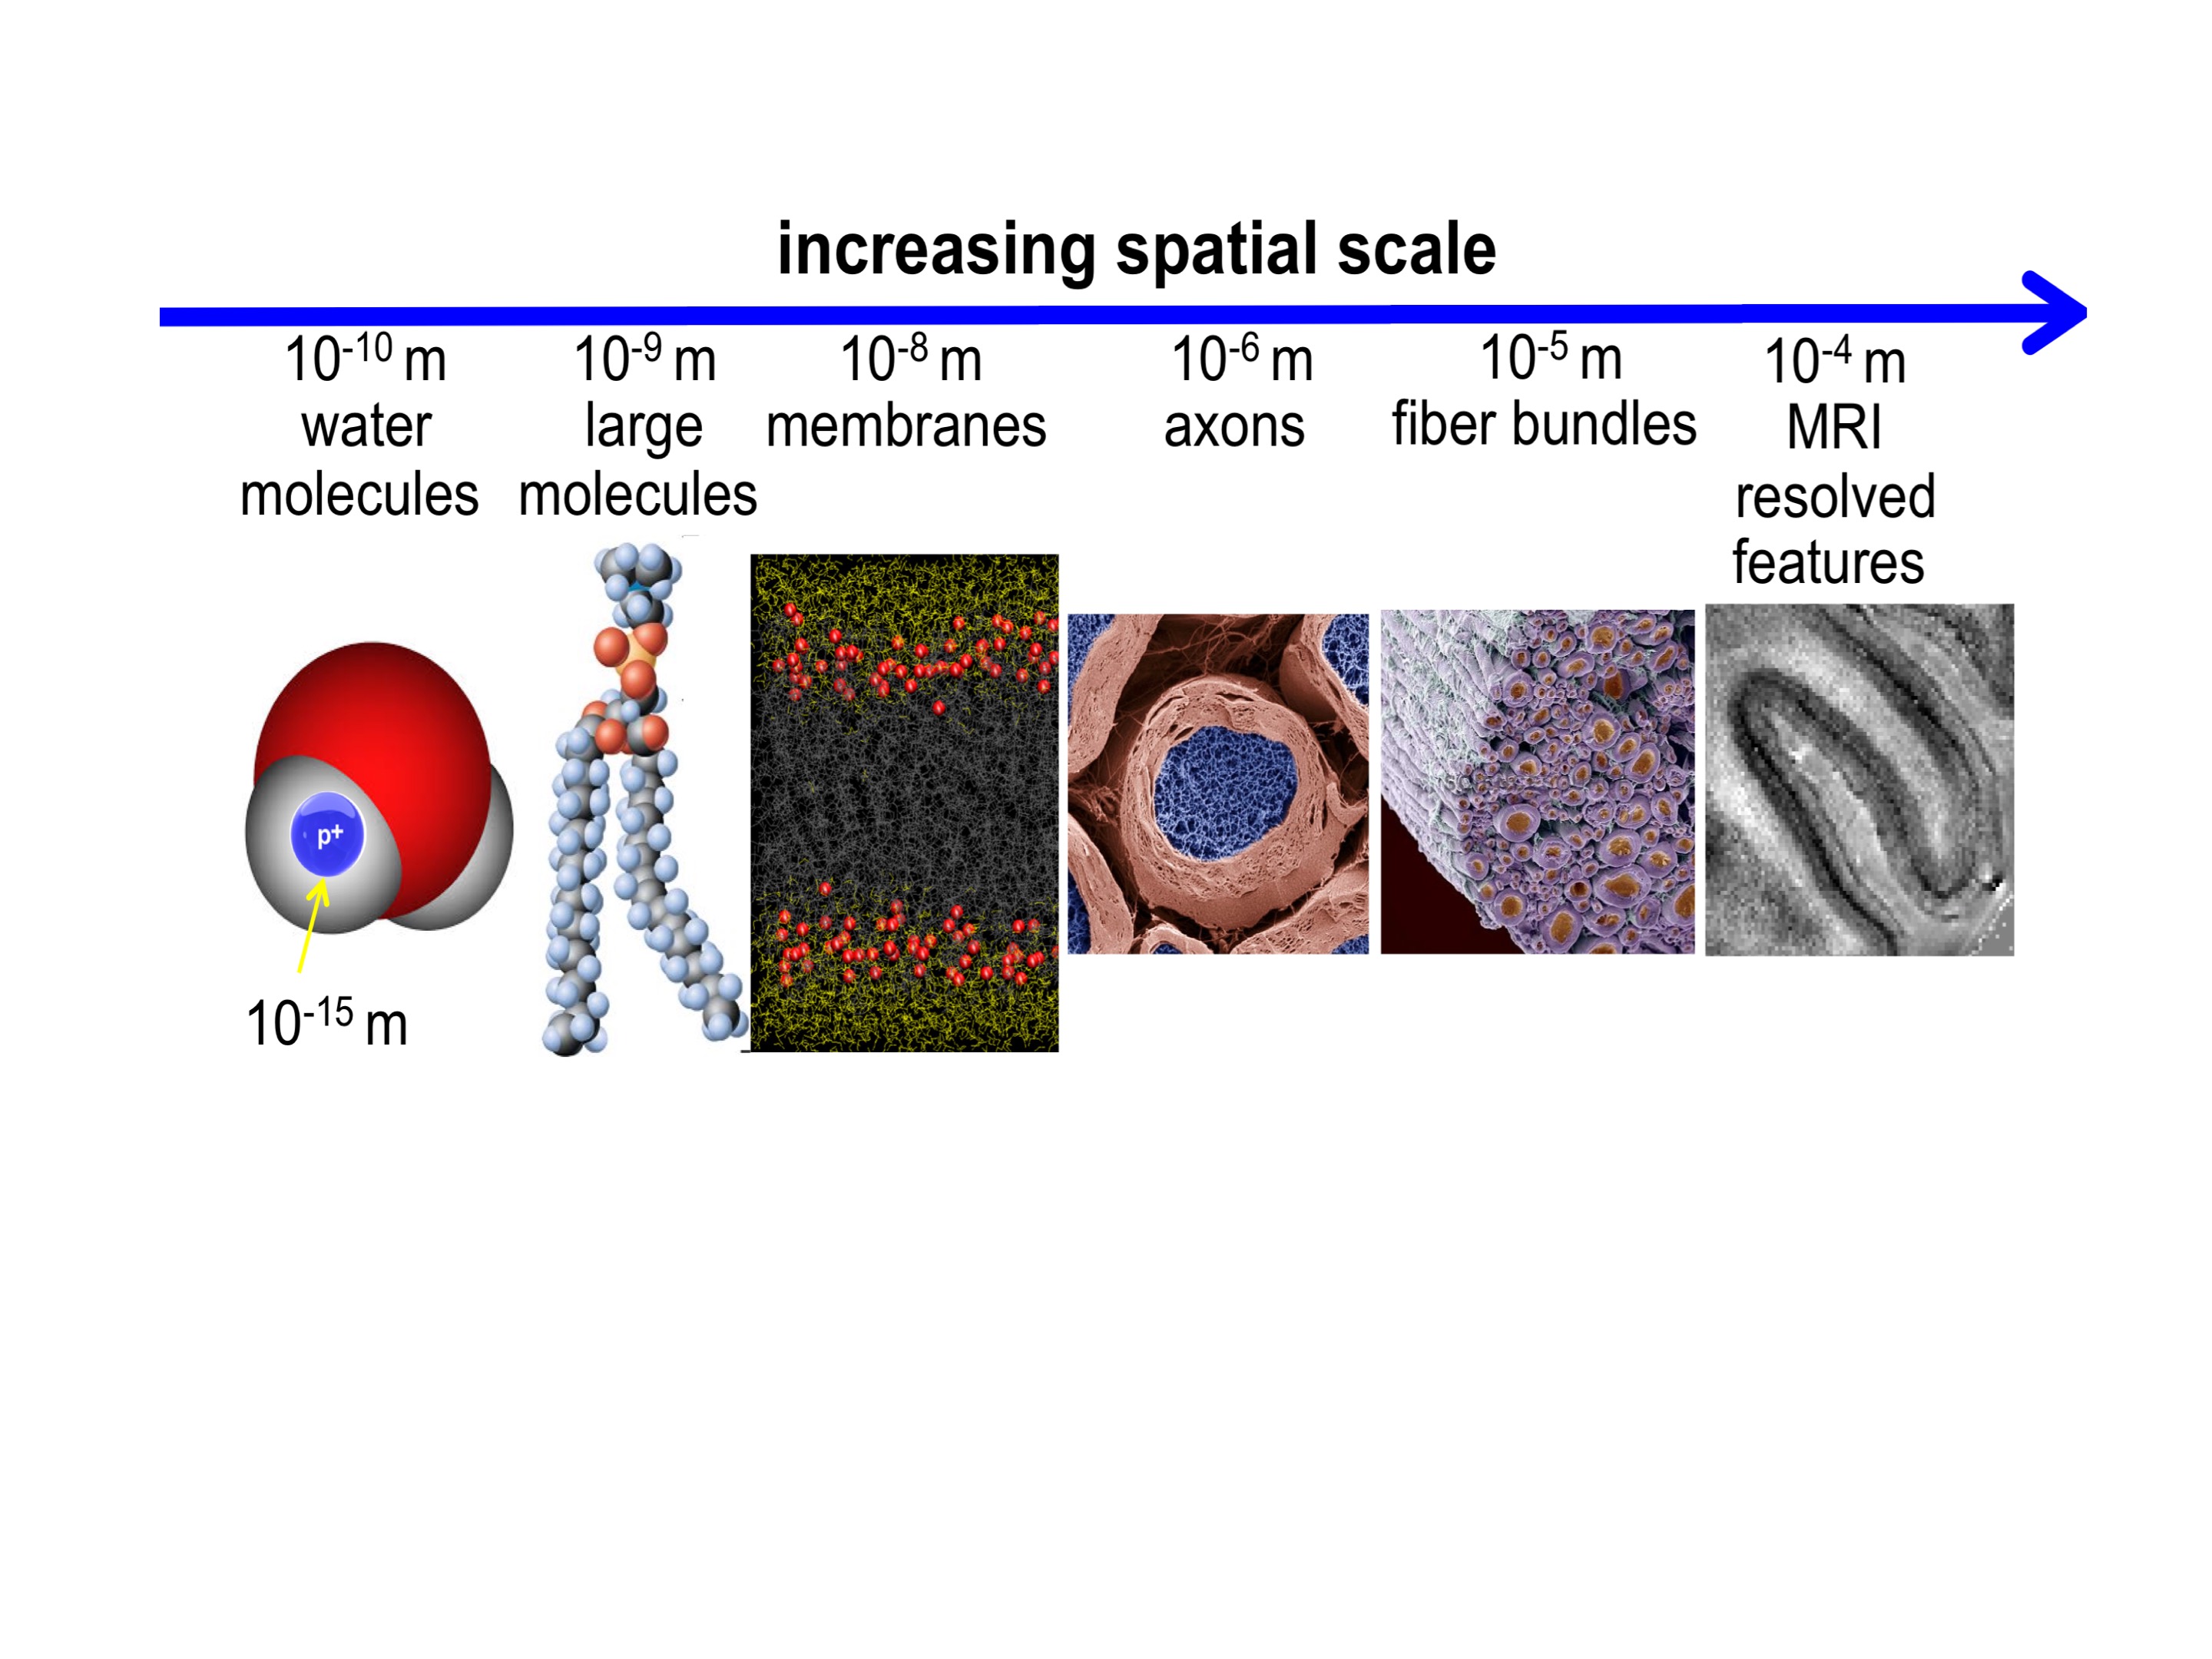
High field studies have brought to light not only that the composition of tissues affects MRI susceptibility contrast, but also that a tissue’s sub-voxel structure at scales all the way down to the molecular level plays an important role as well. In this overview, various ways will be discussed by which sub-voxel structure can affect magnetic susceptibility contrast, and the extraction of quantitative magnetic susceptibility values. In addition, opportunities study the microstructural aspects of brain tissue with susceptibility weighted MRI will be reviewed, with an emphasis for inferring the orientation of fiber bundles in white matter and the relative size of the myelin water compartment.
Subtle variations in the magnetic susceptibility of brain tissues can affect the MRI signal and lead to contrast that can be used to study anatomy and function. For this purpose, dedicated scan techniques such as susceptibility-weighted (SW) anatomical MRI and blood-oxygen level dependent functional MRI have been developed. In human brain, particularly strong susceptibility contrast has been observed with modern high field scanners (Li et al., 2006, Duyn et al., 2007), and this has helped understanding contributing sources and mechanisms. To interpret magnetic susceptibility contrast, analysis approaches have been developed with the goal of quantifying local tissue magnetic susceptibility, a physical quantity that, in some brain regions, allows estimation of local tissue iron content and quantification of changes with disease. Interestingly, high field studies have also brought to light not only that the composition of tissues affects MRI susceptibility contrast, but also that a tissue’s sub-voxel structure at scales all the way down to the molecular level plays an important role as well (Figure 1,2) (He and Yablonskiy, 2009, Wharton and Bowtell, 2012, Sati et al., 2013). This has been observed not only in brain but in various other organs as well (Dibb et al., 2016). This sensitivity to microstructure originates from local, sub-voxel variations in magnetic field that affect the resonance frequency of water protons. In multi-gradient echo imaging, a popular SW MRI technique, shifts and variations in resonance frequency within a voxel affect amplitude and phase of the voxel-averaged signal, and as a result the characteristics of the amplitude and phase evolution over the echo train. Because susceptibility perturbers (i.e. molecules and complexes/structures with a magnetic susceptibility different than that of water) generate non-local field distributions, the average field within a voxel does not only depend on local (intra-voxel) sources (perturbers), but also sources outside the voxel. While some of the non-local effects can be accounted for with the technique of quantitative susceptibility mapping (QSM) and converted in local, voxel-averaged susceptibility values, microstructural (intra-voxel) susceptibility distributions can confound this conversion (Wharton and Bowtell, 2015). To understand the effect of microstructure on SW MRI and QSM, we have to consider the following:
- The voxel frequency does only indirectly and imprecisely report on the voxel averaged magnetic field (along the main field B0). This has two main reasons: first, the MRI signal originates from a large number of water hydrogen protons that jointly “sense” the microscopic field distribution. The average of phases of these sensors is not generally equal to the phase of average signal generated by the sensors. Substantial deviations are expected in conditions where spins accumulate large phase angles (for details see (Duyn, 2017)). Secondly, this field sensing may be microscopically non-uniform as it is affected by the spatial distribution, motion, and MRI visibility of the water protons, all of which depend on tissue micro-structure. For example, in white matter, the myelin sheath surrounding axons displaces water (sensors) and restricts motion and diffusion of water between intra- and extra axonal compartments. MR visibility refers to effects from T1 and T2 weighting, which may vary on a microscopic scale.
- The tissue structure responsible for microscopic variations in magnetic susceptibility (and magnetic field) also affects the distribution of (sensing) water molecules, i.e. the distribution of field sensors and sources generally (anti-) correlate (Duyn and Schenck, 2016). This can result in difference between the average of the sensed field and the voxel-averaged field.
- Microstructure at the molecular level can affect magnetic susceptibility, which in turn can lead to field changes. An example is the highly anisotropic arrangement of lipid molecules of myelin (Li et al., 2012, Wharton and Bowtell, 2012, Sati et al., 2013).
In this overview, various ways will be discussed by which sub-voxel structure can affect magnetic susceptibility contrast, and the extraction of quantitative measures with QSM. In addition, opportunities study the microstructural aspects of brain tissue with SW MRI will be reviewed, with an emphasis for inferring the orientation of fiber bundles in white matter (Lee et al., 2011) and the relative size of the myelin water compartment (Li et al., 2015, Nam et al., 2015).
Acknowledgements
No acknowledgement found.References
Dibb R, Xie L, Wei H, Liu C (2016) Magnetic susceptibility anisotropy outside the central nervous system. NMR in biomedicine.
Duyn JH (2017) Studying brain microsctructure with magnetic susceptibility contrast at high field. NeuroImage.
Duyn JH, Schenck J (2016) Contributions to magnetic susceptibility of brain tissue. NMR in biomedicine.
Duyn JH, van Gelderen P, Li TQ, de Zwart JA, Koretsky AP, Fukunaga M (2007) High-field MRI of brain cortical substructure based on signal phase. Proc Natl Acad Sci U S A 104:11796-11801.
He X, Yablonskiy DA (2009) Biophysical mechanisms of phase contrast in gradient echo MRI. Proc Natl Acad Sci U S A 106:13558-13563.
Lee J, van Gelderen P, Kuo LW, Merkle H, Silva AC, Duyn JH (2011) T2*-based fiber orientation mapping. NeuroImage 57:225-234.
Li TQ, van Gelderen P, Merkle H, Talagala L, Koretsky AP, Duyn J (2006) Extensive heterogeneity in white matter intensity in high-resolution T2*-weighted MRI of the human brain at 7.0 T. NeuroImage 32:1032-1040.
Li W, Wu B, Avram AV, Liu C (2012) Magnetic susceptibility anisotropy of human brain in vivo and its molecular underpinnings. NeuroImage 59:2088-2097.
Li X, van Gelderen P, Sati P, de Zwart JA, Reich DS, Duyn JH (2015) Detection of demyelination in multiple sclerosis by analysis of relaxation at 7 T. NeuroImage: Clinical 7:709-714.
Nam Y, Lee J, Hwang D, Kim DH (2015) Improved estimation of myelin water fraction using complex model fitting. NeuroImage 116:214-221.
Sati P, van Gelderen P, Silva AC, Reich DS, Merkle H, de Zwart JA, Duyn JH (2013) Micro-compartment specific T2() relaxation in the brain. NeuroImage 77:268-278.
Wharton S, Bowtell R (2012) Fiber orientation-dependent white matter contrast in gradient echo MRI. Proc Natl Acad Sci U S A 109:18559-18564.
Wharton S, Bowtell R (2015) Effects of white matter microstructure on phase and susceptibility maps. Magn Reson Med 73:1258-1269.
Figures