Quantitative Myocardial Perfusion
1National Heart Lung and Blood Institute, National Institutes of Health, Bethesda, MD, United States
Synopsis
Quantification of myocardial blood flow (MBF, in the unit of ml/min/g) is more objective to assess myocardial micro-circulation under rest and pharmaceutical or exercise stress condition and capture global flow reduction. Although perfusion quantification has been studies for the past 20 years, it is still not clear how to build a practical quantitative myocardial perfusion workflow. This syllabus reviews key components of such system and emphasizes on motion correction, intensity to Gd concentration conversion and Gd kinetics modelling. With recent developments more focusing on the automation and completeness of entire workflow, including fully automated processing and motion correction, the quantitative perfusion is becoming clinically practical.
Introduction
Myocardial perfusion magnetic resonance imaging has been established as a high sensitive, non-invasive, non-toxic imaging technique with superior spatial resolution to evaluate the myocardial blood flow, compared to the nuclear imaging such as SPECT or PET or more invasive coronary catheterization [1]. The majority of MR perfusion imaging is conducted with cardiac triggering and relies on continuously measuring the myocardium signal during the passage of T1 shortening contrast agent gadopentetate dimeglumine (Gd-DTPA) over sufficient number of heart beats (e.g. 40-60) [2]. The perfusion images are usually evaluated by visual assessment and semi-quantitative metrics, e.g. upslope of time intensity curves. Compared to these methods, quantification of myocardial blood flow (MBF, in the unit of ml/min/g) is more objective to assess myocardial micro-circulation under rest and pharmaceutical or exercise stress condition and quantify absolute flow reduction. It also has the potential to be superior in differentiating global blood flow reduction, such as multi-vessel diseases or micro-vascular diseases.
Accuracy of perfusion flow quantification highly depends on the correct measurement of arterial input function (AIF). Since longer saturation time leads to saturated signal intensities in perfusion imaging during the contrast uptake, either “dual-bolus” [3] or “dual-sequence” [4] technique has been proposed for more accurate AIF estimation. The former relies on injecting a very low dose bolus and assumes the signal linearity between contrast concentration and signal intensity. The latter modified the saturation recovery sequence to acquire a low resolution image (so-called AIF images) with very short saturation time; therefore the signal saturation is less severe. Compared to the "dual-bolus" method, the “dual- sequence” technique requires only one contrast injection and simplifies the clinical workflow. The assumption of signal linearity to Gd concentration can be removed by converting the signal intensity of AIF and perfusion images to Gd concentration unit ([Gd], mmol/L).
As a nontrivial step, the Gd concentration signals of AIF and perfusion images are inputted into certain contrast kinetics model for the estimation of MBF and other parameters. These parameters characterize myocardial microvascular structures, such as blood volume (ml/g) or plasma volume (ml/g), interstitial volume (ml/g) and extraction fraction E .
Since the complete imaging of contrast uptake will take ~60 or more heart beats, it is not possible to breath-hold patients. The breath-holding should not be used during perfusion imaging; but this requires to develop effective motion correction (MOCO) to correct respiratory motion. As shown in Figure 1, a complete workflow of quantitative perfusion imaging includes image acquisition, motion correction on AIF and perfusion series, intensity to [Gd] conversion and Gd kinetics modelling. This syllabus will overview the entire workflow for quantitative myocardial perfusion process.
Imaging sequence
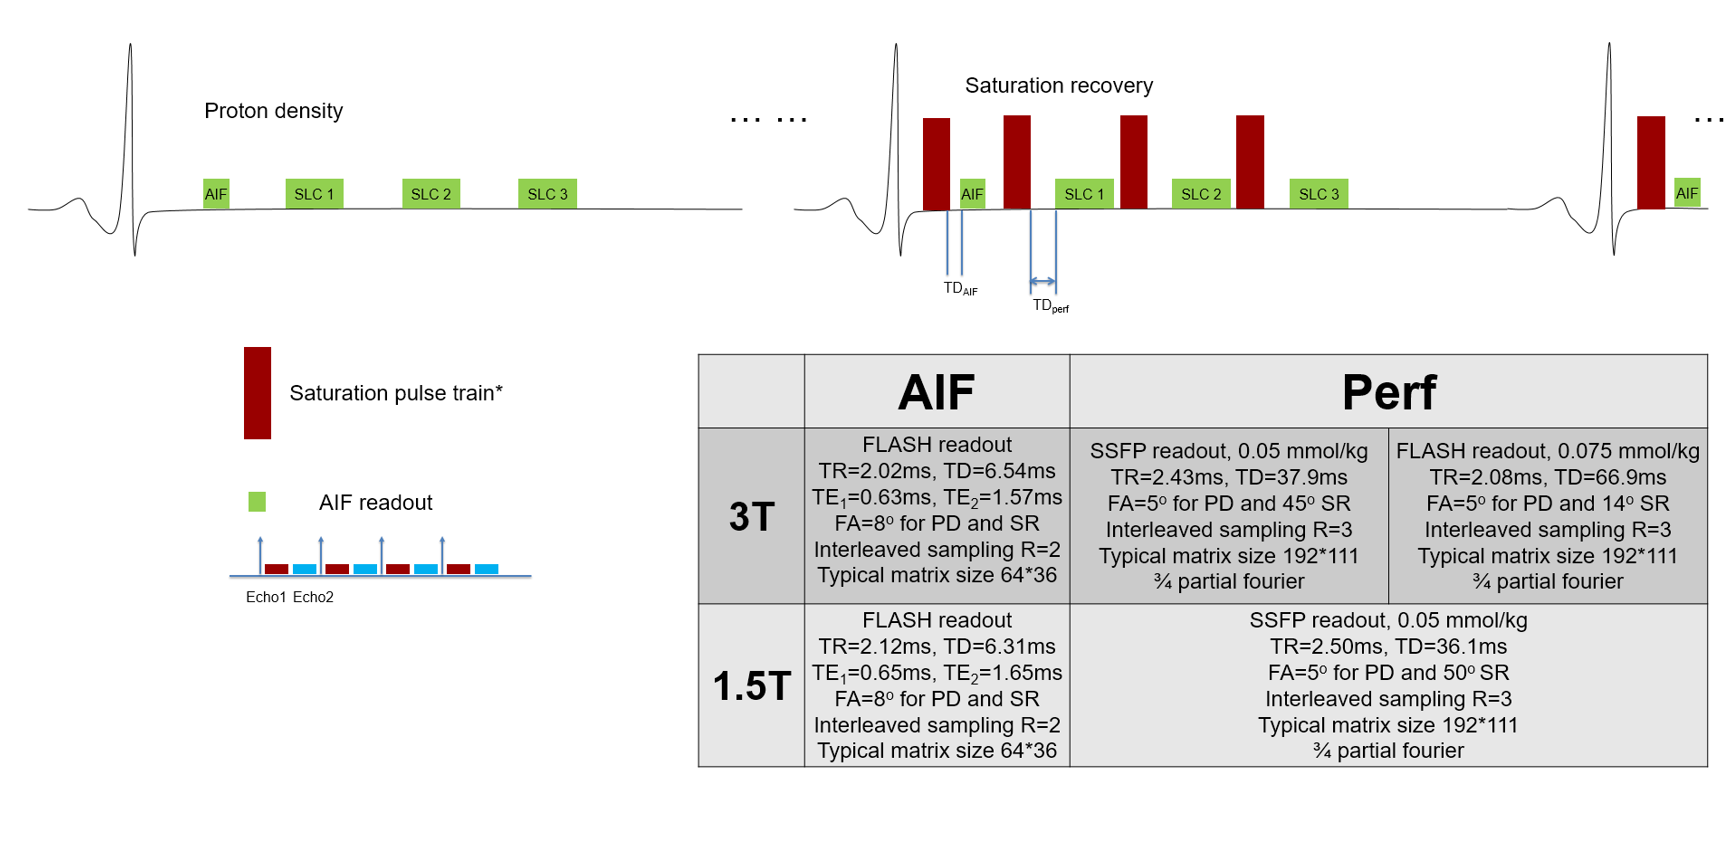
Saturation recovery (SR) based perfusion imaging sequence is the current 'standard' for myocardial perfusion imaging. The advantage of SR in perfusion imaging is its less sensitive to heart rate variation and more myocardial coverage with multiple slices, given a good saturation can be achieved over the heart. It is necessary to use composite RF pulses for SR to have good B0 and B1 insensitivity or to use B1-insensitive pulses (e.g. BIR-4). To correct surface coil inhomogeneity, it is often to acquire proton density weighted (PD) images before the SR readouts. The low resolution AIF imaging module can be inserted after the R-wave to get AIF signal. Figure 2 gives an illustration of SR based perfusion imaging sequences. More detailed review can be found at [2] and [5].Motion correction
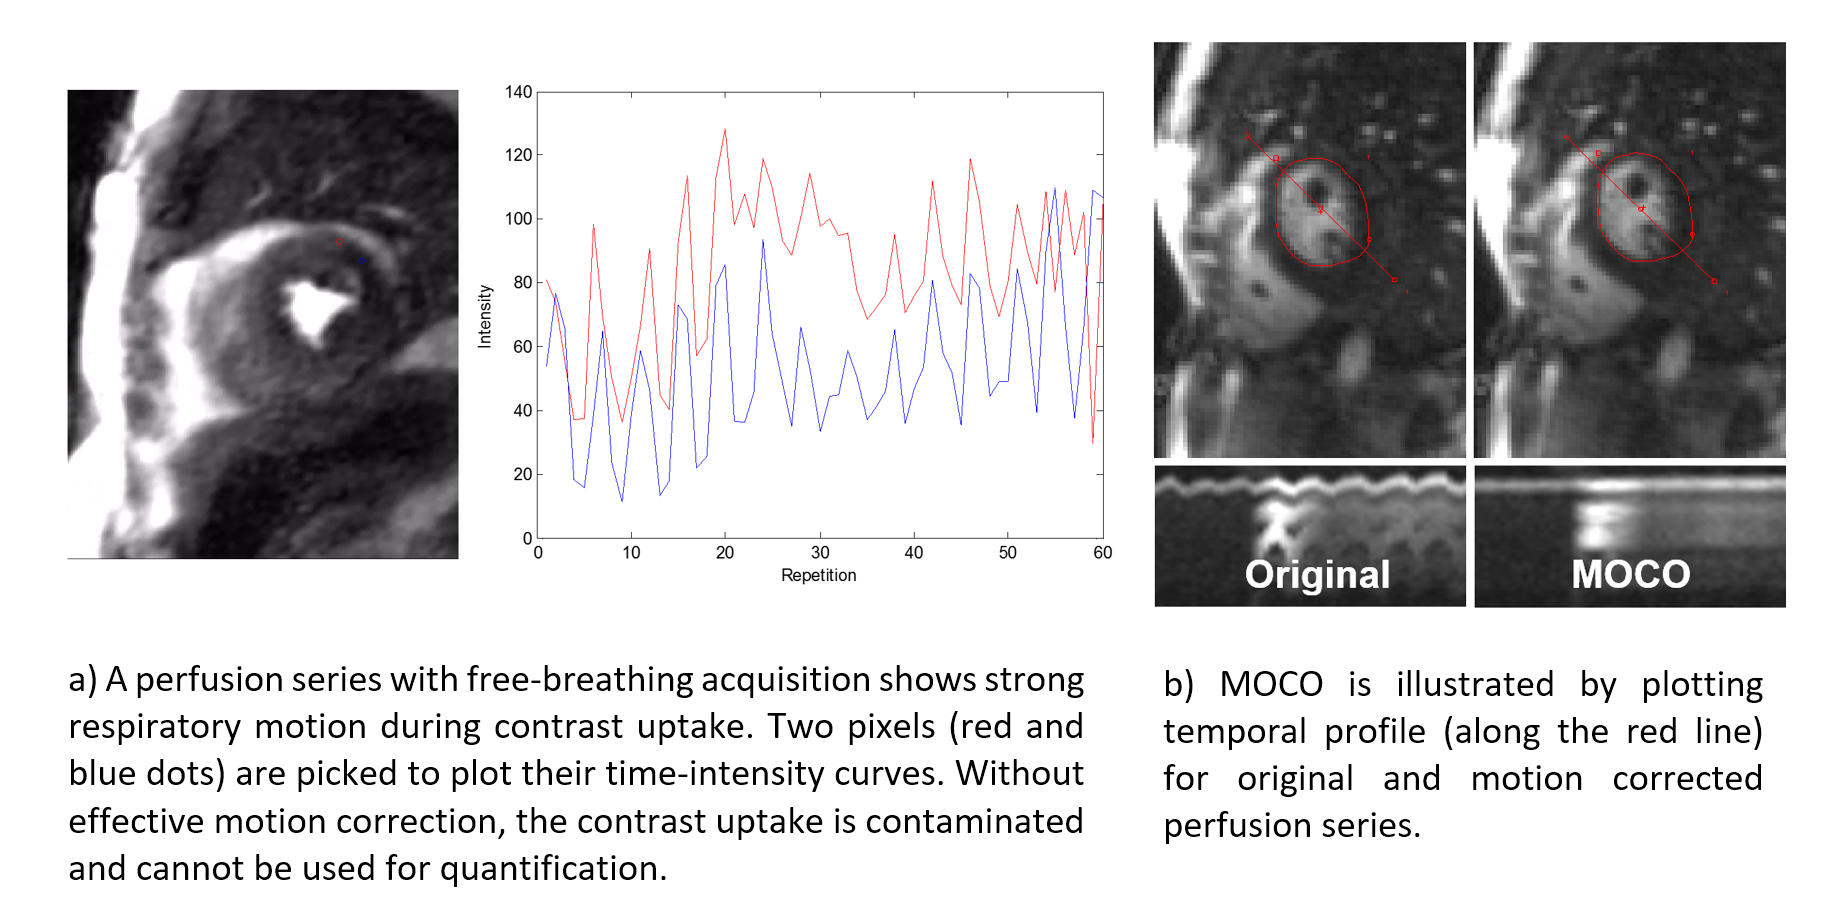
The purpose of MOCO is to restore the correct spatial alignment of myocardium during contrast passage. This step is essential for the free-breathing acquisition. Considerable amount of effort had been made to develop robust, fully automated MOCO solution for perfusion imaging [6–8]. Majority of algorithms utilize the non-rigid image registration to estimate spatial movement and deformation among perfusion images taken at different heart beats. The main difficulties of this task lie on the rapid and drastic contrast changes in perfusion images. Figure 3 illustrates an example of perfusion MOCO. To enable perfusion quantification, it is necessary to correction motion among AIF series. Also, co-registration of PD images to perfusion images is a required feature.Intensity to [Gd] conversion
Often, perfusion quantification relies on certain assumption that contrast concentration is linearly proportional to image intensity [9,10]. This assumption is very hard to hold, given the variation of dosage, infusion rate, and imperfect imaging sequences and image reconstruction. For the "dual-sequence" scheme, the AIF imaging module has very different parameters (e.g. spatial resolution, readout types). It is impossible to simply take image intensity and assume they represent the [Gd] values correctly. Moreover, perfusion imaging readout can be SSFP for better SNR and AIF readout may remain FLASH. In this case, intensity values cannot be compared directly. The assumption of signal linearity to Gd concentration can be completely removed by converting the signal intensity of AIF and perfusion images to Gd concentration unit ([Gd], mmol/L). This strategy was previously proposed with FLASH perfusion imaging sequences [11,12] and extended to work in SSFP readout [13], as shown in Figure 4.Gd kinetics modelling
The AIF and perfusion signal has been converted into [Gd] unit with the signal nonlinearity corrected. They serve as inputs to the flow mapping. The principle to estimate MBF from [Gd] concentration utilizes the dynamics of Gd transport across the capillary membrane from the vascular space to the interstitial space. An in-depth review of this topic can be found at [14]. The Gd kinetics models can be divided into two categories: compartmental and distributed parameter (DP) models. In the category of compartmental model, the Fermi function [15] or BSpline based model free deconvolution [16] or exponential decay [17] had be applied to myocardial perfusion. As well illustrated in prior publications [14,17–25], the assumption behind these models is the Gd delivery to the myocardial interstitial space from vascular space is flow limited, at least at the low flow scenario. Thus, the compartmental models do not explicitly count for the Gd extraction from the vascular space into the interstitial space. More studies [26–28] have suggested the Gd delivery to the myocardium is not necessarily flow limited, especially under the stress condition. Since the compartmental model assumes spatially invariant distribution or instantaneous mixing of Gd concentration [14,17] and does not explicitly estimate the influence of extraction fraction (0≤E≤1, a dimensionless scalar, the fraction of Gd extracted from vascular space into the interstitial space [29]), more comprehensive distributed parameter models are applied to the estimate of myocardial blood flow in MRI [14,26–28,30] and in PET [31–33]. Besides the estimation of myocardial blood flow (ml/min/g), distributed models [26–28] were studies to estimate other parameters characterizing myocardial microvascular structures, including blood volume (ml/g) or plasma volume (ml/g), interstitial volume (ml/g) and extraction fraction E .Other aspects
There are more advanced imaging sequences for perfusion imaging, e.g. 3D k-t sampling [34] and spiral perfusion imaging [35]. To compute MBF from these sequences, two difficulties are motion correction and [Gd] conversion.
The DP models can estimate more parameters, besides MBF, to characterize microvascular structure of myocardium. The potential of those parameters is of strong interests for microvascular diseases and non-ischemic cardiovascular diseases.
The validation of MBF is not an easy task. Animal validation on MBF estimates has been performed against the microsphere in dog or canine models [3,16,20,36,37]. In-vivo validation compared MR MBF values to PET imaging [31,32,38]. A more recent approach is to compare perfusion flow to coronary sinus flow estimation [39].
Fully automated myocardial quantitative perfusion solution has been developed and integrated on the clinical MR scanners [13]. This package includes optimized SR perfusion sequences, motion correction, intensity to [Gd] conversion, different Gd kinetics models. The motion corrected perfusion images and pixel-wise MBF maps are sent to the scanner without any user interaction. Figure 5 gives examples of pixel-wise MBF maps generated with this automated inline quantitative perfusion package.
Conclusions
Quantitative myocardial perfusion has been studies for the past 20 years. With recent developments more focusing on the automation and completeness of entire workflow, including fully automated processing and motion correction, the quantitative perfusion is becoming clinically practical.Acknowledgements
No acknowledgement found.References
1. Coelho-Filho OR, Rickers C, Kwong RY, Jerosch-Herold M. MR myocardial perfusion imaging. Radiology. 2013;266:701–15.
2. Kellman P, Arai AE. Imaging sequences for first pass perfusion --a review. J. Cardiovasc. Magn. Reson. 2007;9:525–37.
3. Christian TF, Rettmann DW, Aletras AH, Liao SL, Taylor JL, Balaban RS, et al. Absolute myocardial perfusion in canines measured by using dual-bolus first-pass MR imaging. Radiology. 2004;232:677–84.
4. Gatehouse PD, Elkington AG, Ablitt N a, Yang G-Z, Pennell DJ, Firmin DN. Accurate assessment of the arterial input function during high-dose myocardial perfusion cardiovascular magnetic resonance. J. Magn. Reson. Imaging. 2004;20:39–45.
5. Gerber BL, Raman S V, Nayak K, Epstein FH, Ferreira P, Axel L, et al. Myocardial first-pass perfusion cardiovascular magnetic resonance: history, theory, and current state of the art. J. Cardiovasc. Magn. Reson. 2008;5:1–5.
6. Stegmann MB, Larsson HBW. Automatic Assessment of Cardiac Perfusion. 2004;3:1060–1.
7. Bracoud L, Vincent F, Pachai C, Canet E, Croisille P, Revel D. Automatic registration of MR first-pass myocardial perfusion images. Funct. Imaging Model. Hear. 2003;1007–1007. Available from: http://www.springerlink.com/index/A0BWQQLWPDCC08BK.pdf
8. Adluru G, DiBella EVR, Schabel MC. Model-based registration for dynamic cardiac perfusion MRI. J. Magn. Reson. Imaging. 2006;24:1062–70.
9. Lee DC, Johnson NP. Quantification of Absolute Myocardial Blood Flow by Magnetic Resonance Perfusion Imaging. JACC Cardiovasc. Imaging. American College of Cardiology Foundation; 2009;2:761–70. Available from: http://dx.doi.org/10.1016/j.jcmg.2009.04.003
10. Jerosch-Herold M, Stillman a E, Wilke N. Magnetic resonance quantification of the myocardial perfusion reserve with a Fermi function model for constrained deconvolution. Med. Phys. 1998;25:73–84. Available from: http://eutils.ncbi.nlm.nih.gov/entrez/eutils/elink.fcgi?dbfrom=pubmed&id=9472829&retmode=ref&cmd=prlinks
11. Breton E, Kim D, Chung S, Axel L. Quantitative contrast-enhanced first-pass cardiac perfusion MRI at 3 Tesla with accurate arterial input function and myocardial wall enhancement. J. Magn. Reson. Imaging. 2011;34:676–84.
12. Cernicanu A, Axel L. Theory-Based Signal Calibration with Single-Point T1 Measurements for First-Pass Quantitative Perfusion MRI Studies. Acad. Radiol. 2006;13:686–93.
13. Kelllman P, Hansen MS, Nielles-Vallespin S, Nickander J, Themudo R, Ugander M, et al. Myocardial Perfusion Imaging: Image acquisition and Arterial Input Function for Quantification. J. Cardiovasc. Magn. Reson. 2017;
14. Sourbron SP, Buckley DL. Tracer kinetic modelling in MRI: estimating perfusion and capillary permeability. Phys. Med. Biol. 2011;57:1–33.
15. Jerosch-Herold M, Wilke N, Stillman a E. Magnetic resonance quantification of the myocardial perfusion reserve with a Fermi function model for constrained deconvolution. Med. Phys. 1998;25:73–84.
16. Jerosch-Herold M, Swingen C, Seethamraju RT. Myocardial blood flow quantification with MRI by model-independent deconvolution. Med. Phys. 2002;29:886–97.
17. Larsson HB, Fritz-Hansen T, Rostrup E, Søndergaard L, Ring P, Henriksen O. Myocardial perfusion modeling using MRI. Magn. Reson. Med. 1996;35:716–26.
18. Diesbourg LD, Prato FS, Wisenberg G, Drost DJ, Marshall TP, Carroll SE, et al. Quantification of myocardial blood flow and extracellular volumes using a bolus injection of Gd-DTPA: kinetic modeling in canine ischemic disease. Magn. Reson. Med. 1992;23:239–53. Available from: http://www.ncbi.nlm.nih.gov/pubmed/1549039
19. Cullen JH, Horsfield M a, Reek CR, Cherryman GR, Barnett DB, Samani NJ. A Myocardial Perfusion Reserve Index in Humans Using First-Pass Contrast-Enhanced Magnetic Resonance Imaging. Jacc 1999;33:1386–94. Available from: http://www.ncbi.nlm.nih.gov/pubmed/10193743
20. Fluckiger JU, Benefield BC, Bakhos L, Harris KR, Lee DC. A Comparison of Theory-Based and Experimentally Determined Myocardial Signal Intensity Correction Methods in First-Pass Perfusion Magnetic Resonance Imaging. Computational and Mathematical Methods in Medicine. 2015;2015.
21. Ichihara T, Ishida M, Kitagawa K, Ichikawa Y, Natsume T, Yamaki N, et al. Quantitative analysis of first-pass contrast-enhanced myocardial perfusion MRI using a Patlak plot method and blood saturation correction. Magn. Reson. Med. 2009;62:373–83.
22. Ishida M, Ichihara T, Nagata M, Ishida N, Takase S, Kurita T, et al. Quantification of myocardial blood flow using model based analysis of first-pass perfusion MRI: Extraction fraction of Gd-DTPA varies with myocardial blood flow in human myocardium. Magn. Reson. Med. 2011;66:1391–9.
23. Tong CY, Prato FS, Wisenberg G, Lee TY, Carroll E, Sandler D, et al. Measurement of the extraction efficiency and distribution volume for Gd-DTPA in normal and diseased canine myocardium. Magn. Reson. Med. 1993;30:337–46.
24. Vallée JP, Sostman HD, MacFall JR, DeGrado TR, Zhang J, Sebbag L, et al. Quantification of myocardial perfusion by MRI after coronary occlusion. Magn. Reson. Med. 1998;40:287–97. Available from: http://www.ncbi.nlm.nih.gov/pubmed/9702711
25. Vallhe J, Sostman HD, Macfall JR, Wheeler T, Hedlund LW, Spritzer CE, et al. MRI quantitative myocardial perfusion with compartmental analysis: a rest and stress study. Magn Reson Med 1997;38:981–9. Available from: http://www.ncbi.nlm.nih.gov/pubmed/9402200
26. Kunze KP, Rischpler C, Hayes C, Ibrahim T, Laugwitz K-L, Haase A, et al. Measurement of extracellular volume and transit time heterogeneity using contrast-enhanced myocardial perfusion MRI in patients after acute myocardial infarction. Magn. Reson. Med. 2016;0. Available from: http://doi.wiley.com/10.1002/mrm.26320
27. Chung S, Shah B, Storey P, Iqbal S, Slater J, Axel L. Quantitative Perfusion Analysis of First-Pass Contrast Enhancement Kinetics: Application to MRI of Myocardial Perfusion in Coronary Artery Disease. PLoS One 2016;11:e0162067. Available from: http://dx.plos.org/10.1371/journal.pone.0162067
28. Broadbent DA, Biglands JD, Larghat A, Sourbron SP, Radjenovic A, Greenwood JP, et al. Myocardial blood flow at rest and stress measured with dynamic contrast-enhanced MRI: Comparison of a distributed parameter model with a fermi function model. Magn. Reson. Med. 2013;70:1591–7.
29. Bassingthwaighte JB, Chinard FP, Crone C, Goresky CA, Lassen NA, Reneman RS, et al. Terminology for mass transport and exchange. Am. J. Physiol. 1986;250:H539-45. Available from: http://www.pubmedcentral.nih.gov/articlerender.fcgi?artid=3008667&tool=pmcentrez&rendertype=abstract
30. Bassingthwaighte JB, Chan Hvs, Dewitt Is, Gorman Df, W. M. Modeling of transendothelial transport. 2013;18:1199–216.
31. Kuhle WG, Porenta G, Huang SC, Buxton D, Gambhir SS, Hansen H, et al. Quantification of regional myocardial blood flow using 13N-ammonia and reoriented dynamic positron emission tomographic imaging. Circulation 1992;86:1004–17. Available from: http://www.ncbi.nlm.nih.gov/pubmed/1516170
32. Alessio AM, Bassingthwaighte JB, Glenny R, Caldwell JH. Validation of an axially distributed model for quantification of myocardial blood flow using 13N-ammonia PET. J. Nucl. Cardiol. 2013;20:64–75.
33. Alessio AM, Butterworth E, Caldwell JH, Bassingthwaighte JB. Quantitative imaging of coronary blood flow. Nano Rev. 2010;1:1–13.
34. Fair MJ, Gatehouse PD, DiBella EVR, Firmin DN. A review of 3D first-pass, whole-heart, myocardial perfusion cardiovascular magnetic resonance. J. Cardiovasc. Magn. Reson. Journal of Cardiovascular Magnetic Resonance; 2015;17:68. Available from: http://jcmr-online.com/content/17/1/68
35. Salerno M, Taylor a., Yang Y, Kuruvilla S, Ragosta M, Meyer CH, et al. Adenosine Stress Cardiovascular Magnetic Resonance With Variable-Density Spiral Pulse Sequences Accurately Detects Coronary Artery Disease: Initial Clinical Evaluation. Circ. Cardiovasc. Imaging 2014;7:639–46. Available from: http://circimaging.ahajournals.org/cgi/doi/10.1161/CIRCIMAGING.113.001584
36. Christian TF, Aletras AH, Arai AE. Estimation of absolute myocardial blood flow during first-pass MR perfusion imaging using a dual-bolus injection technique: Comparison to single-bolus injection method. J. Magn. Reson. Imaging. 2008;27:1271–7.
37. Hsu LY, Groves DW, Aletras AH, Kellman P, Arai AE. A quantitative pixel-wise measurement of myocardial blood flow by contrast-enhanced first-pass CMR perfusion imaging: Microsphere validation in dogs and feasibility study in humans. JACC Cardiovasc. Imaging Elsevier Inc.; 2012;5:154–66. Available from: http://dx.doi.org/10.1016/j.jcmg.2011.07.013
38. DeGrado TR, Hanson MW, Turkington TG, Delong DM, Brezinski DA, Vallée JP, et al. Estimation of myocardial blood flow for longitudinal studies with 13N-labeled ammonia and positron emission tomography. J. Nucl. Cardiol. 1996;3:494–507.
39. Themudo R, Nickander J, Kellman P, Xue H, Ugander ASM. Validation of fully automated quantitative myocardial perfusion by cardiovascular magnetic resonance compared to coronary sinus flow. SCMR. 2017. p. 298.
Figures