Postprocessing & Quality Assurance
1McGill University, Montreal, QC, Canada
Synopsis
In-vivo MRS data is unavoidably degraded by experimental imperfections such as subject motion, scanner drift, and eddy currents. Spectral preprocessing improves spectral quality and quantification reliability, and is an indispensable part of any in-vivo MRS experiment. MRS preprocessing is usually organized as a sequence, or ‘pipeline’ of individual processing routines, each designed to address a specific issue with the data. This talk covers some of the most common experimental issues affecting MRS data, and the processing routines and pipelines that can address these issues.
Highlights
- Discuss common spectral imperfections, and processing routines to address them.
- Quick look at the algorithms behind some common processing routines.
- Introduce specific pipelines for various MRS acquisitions.
Problem Summary
In-vivo MRS data is unavoidably degraded by experimental imperfections such as subject motion, scanner drift, and eddy currents. Spectral preprocessing improves spectral quality and quantification reliability, and is an indispensable part of any in-vivo MRS experiment.
MRS preprocessing is usually organized as a sequence, or ‘pipeline’ of individual processing routines, each designed to address a specific issue with the data. We will discuss processing pipelines a bit later, but first, let’s cover some of the most common experimental issues affecting MRS data, and the processing routines that can address these issues.
Processing Routines
Problem: Noise
Experimental MRS data contains noise. Noise can make it difficult to identify and quantify the spectral peaks of interest.
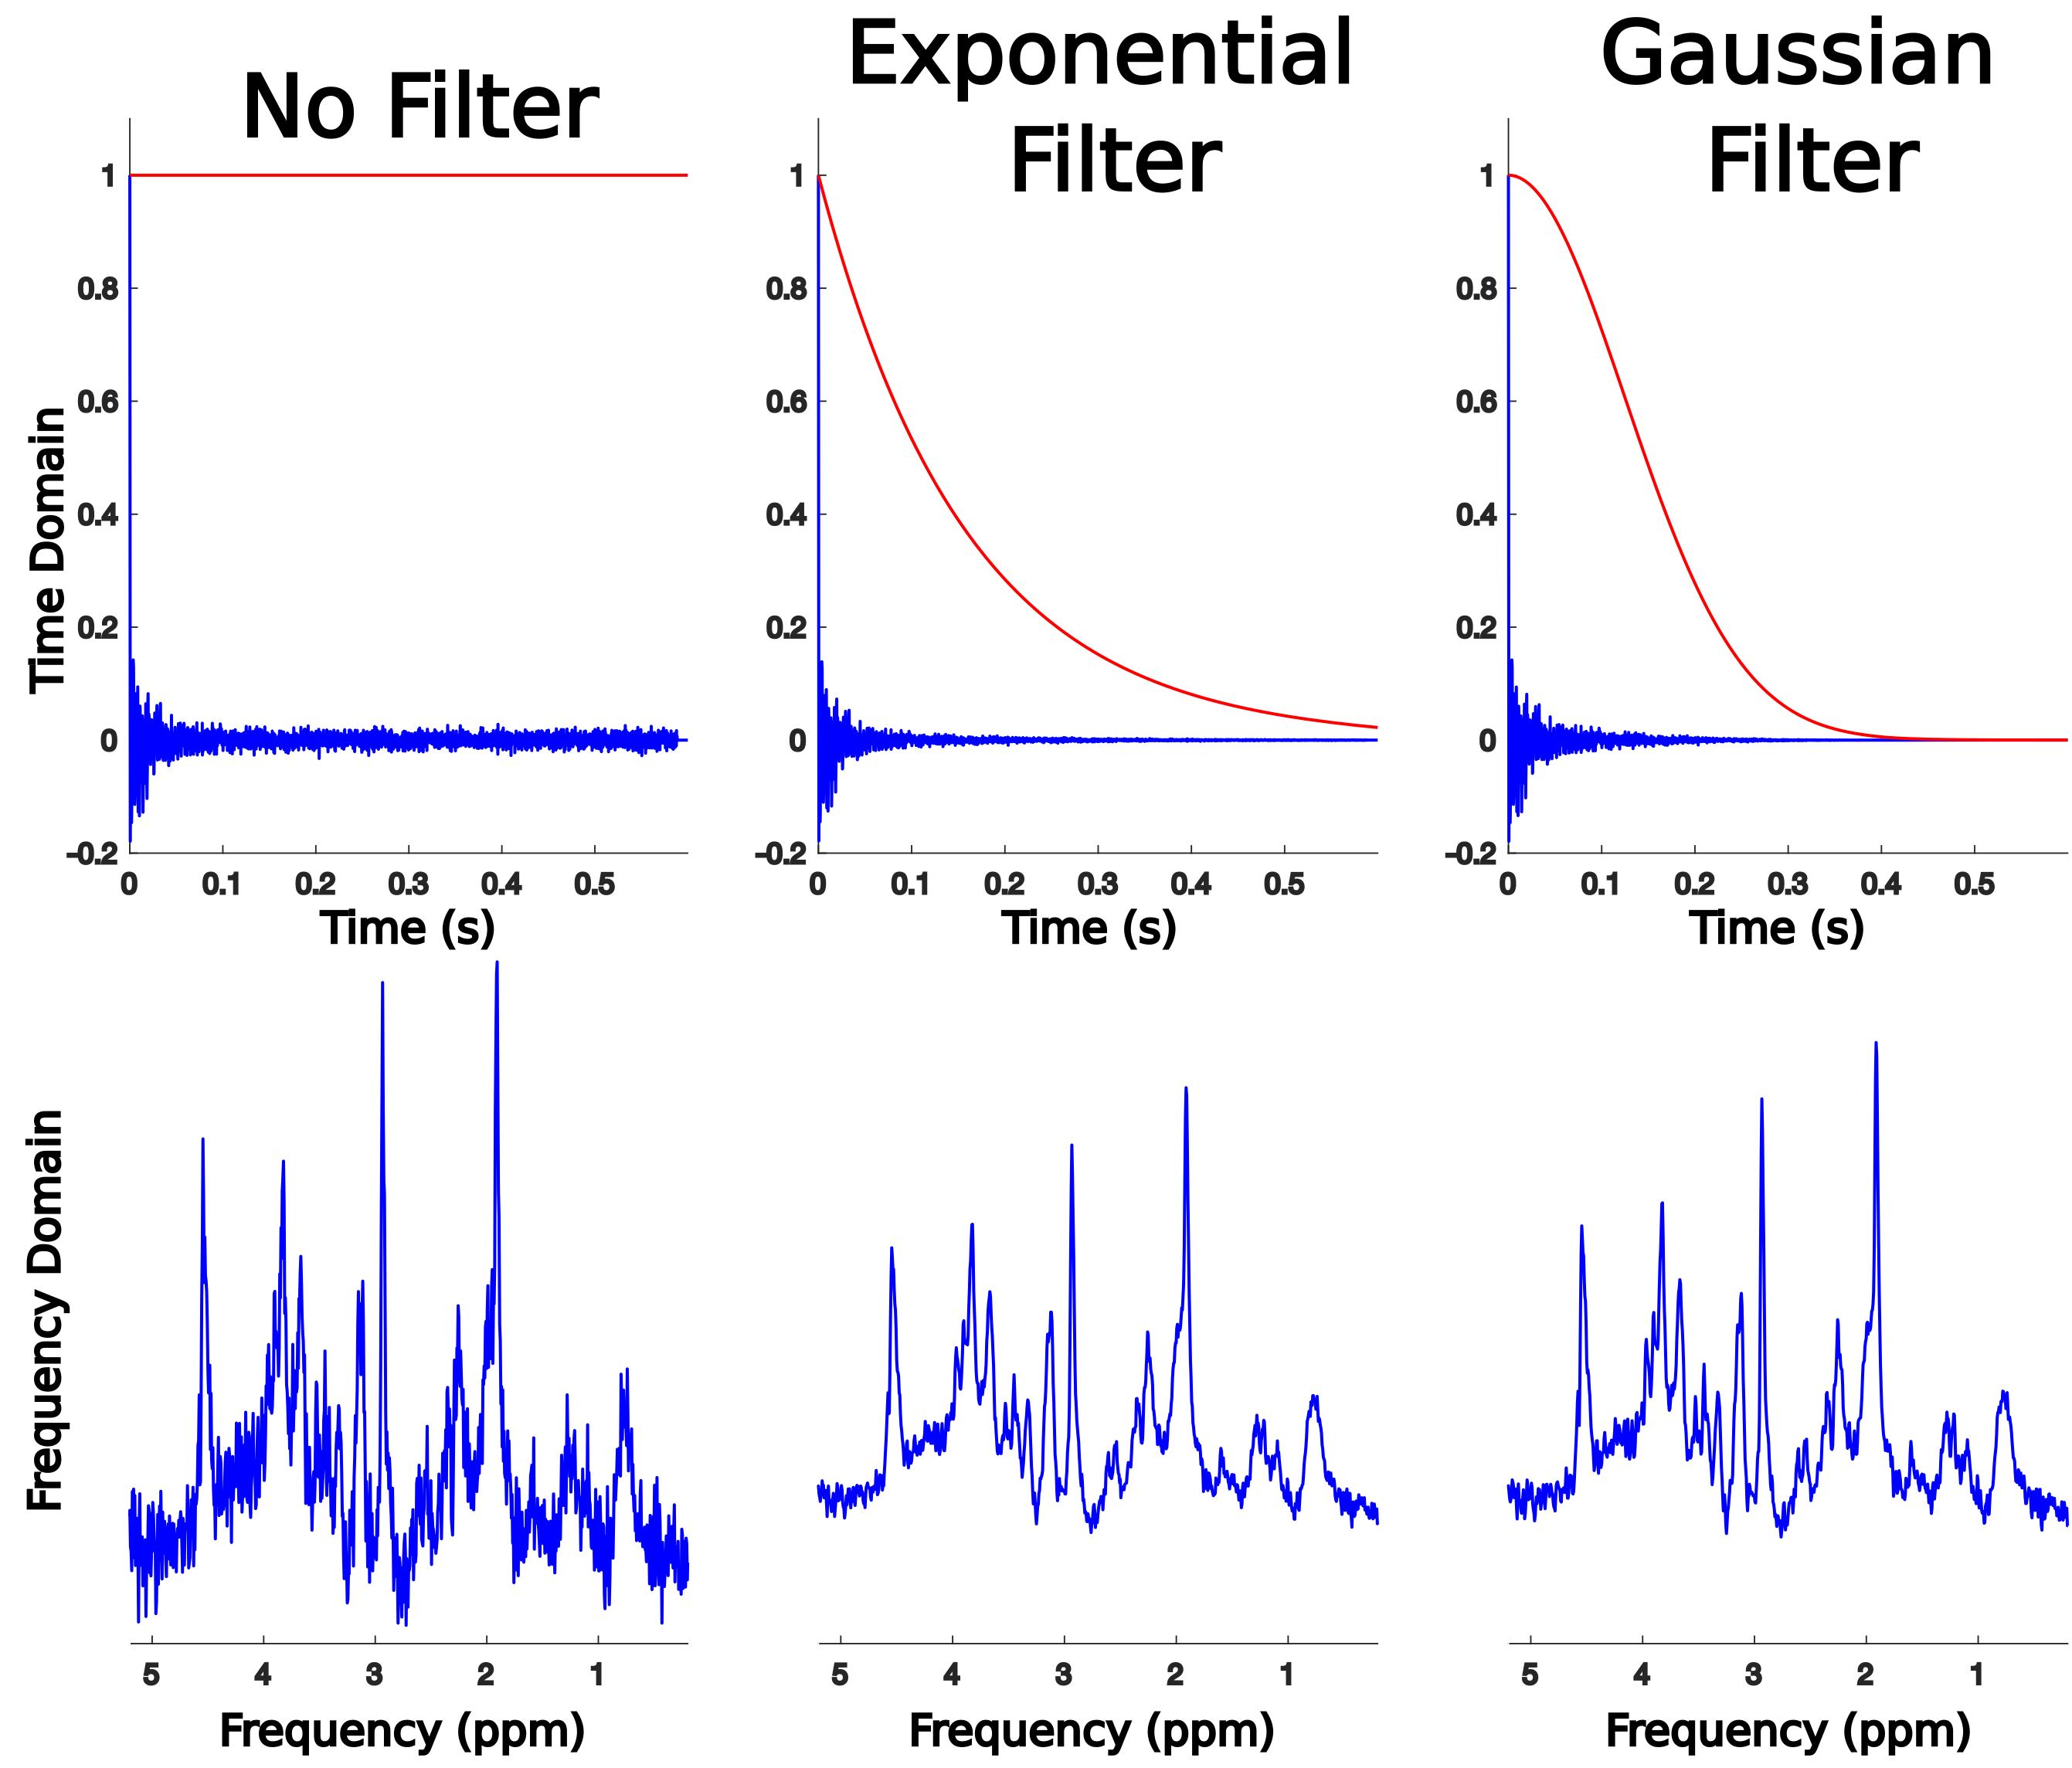
Solution: Filtering
Filtering takes advantage of the fact that in the time-domain, the signal amplitude decays relatively quickly, whereas the noise amplitude is constant in time. As a result, the later part of the fourier induction decay (FID) signal is mostly noise. Therefore, SNR can be improved by attenuating the later part of the FID. This is normally achieved by multiplying the FID by a smooth decay envelope that preserves the early part of the fid and attenuates the later part. Common implementations include exponential filters or Gaussian filters (Figure 1). Note that in addition to improving SNR, filtering also affects the spectral lineshape. Also note that some analysis tools (LCModel) recommend that you do not filter the data prior to analysis.
Problem: Zero-order phase errors
Zero order phase errors are very common, as spectral phase is influenced by sequence timing, RF pulse phases, ADC phase, RF coil orientation and even cable lengths. Zero-order phase errors can be identified by the appearance of singlet peaks that are not fully upright, as in Figure 1, left.
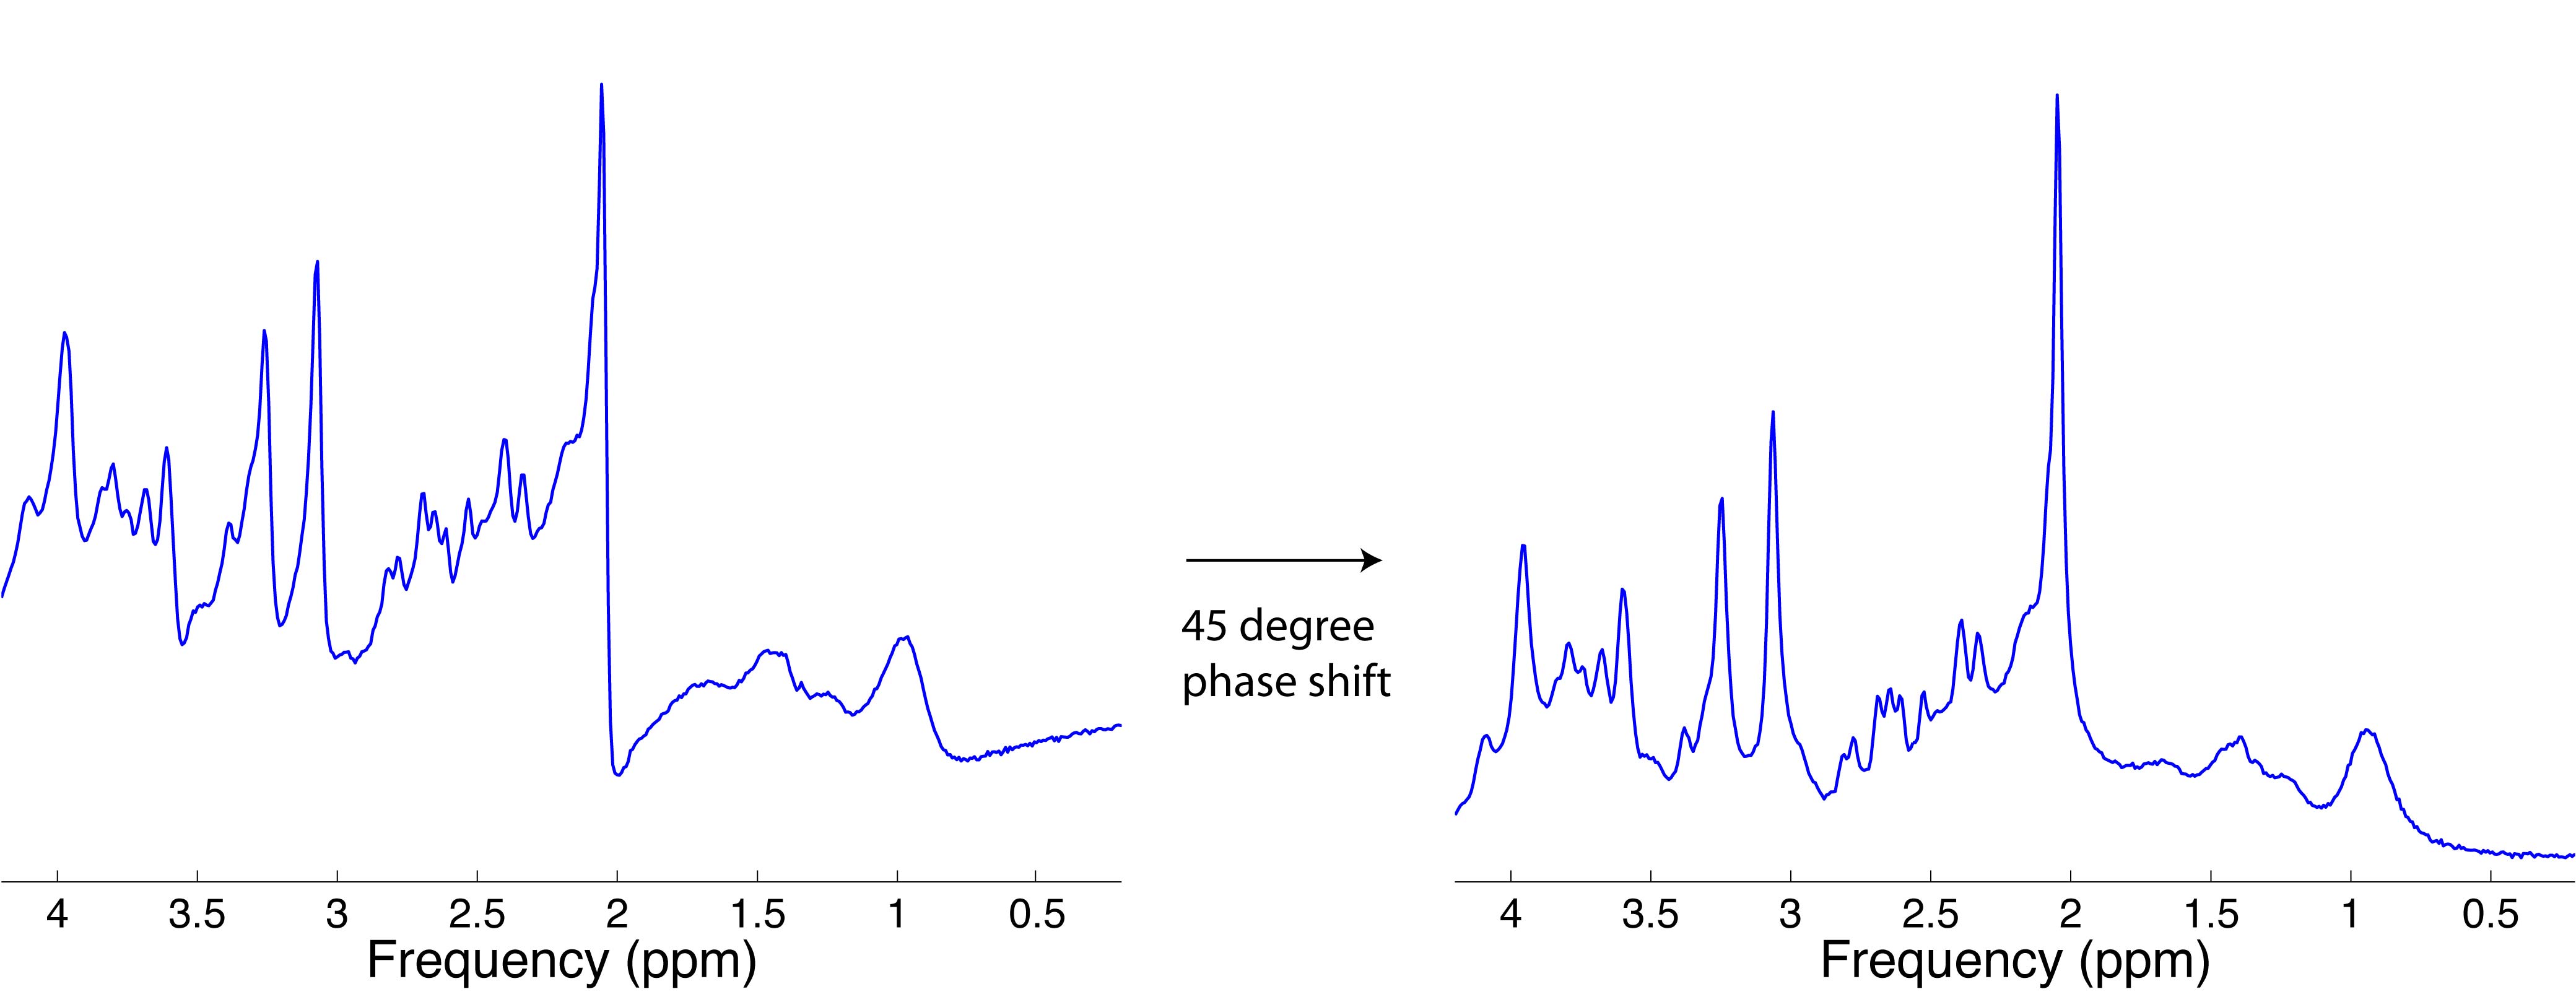
Solution: Zero-order phase correction
Zero-order phase correction is performed by phase shifting each complex point in the spectrum or FID by the same fixed amount (Figure 2). Phase correction can be done manually or automatically. Automatic correction can be performed using the phase of the first point in the FID as a correction factor (note this only works if the spectrum consists mostly of upright peaks). Alternatively, the correction factor can be determined automatically in the frequency domain by measuring the phase at the centre of an isolated singlet peak. Most MRS software packages allow manual or automatic zero-order phasing of MR spectra.
Problem: First-order phase errors
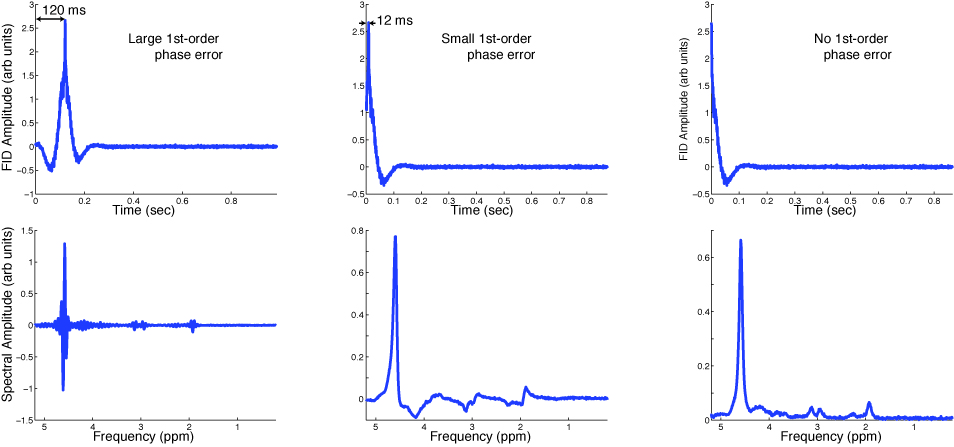
First order phase errors are caused by timing errors in the acquisition, such that the ADC onset does not coincide with the top of the signal echo. The result is a frequency dependent phase shift in the spectrum, causing some singlets to appear more out of phase than others (See Figure 3, middle), or in severe cases, prominent ringing throughout the spectrum (See Figure 2, left).
Solution: Temporal shifting of the FID
First-order phase correction is performed by temporally shifting the time domain data such that the first point in the time domain corresponds to the top of the signal echo. This is trickier than zero-order phasing, and may require going back to your acquisition to estimate the timing errors. Many MRS software packages also allow for first-order phasing of MR spectra.
Problem: Multiple channels of RF array
Highly parallel RF arrays have become the standard in in-vivo MRS data acquisition. Combination of RF channels is often performed online, but depending on system and data format, the combination of RF coils may need to be performed offline by the user. The challenge here is that the various channels will have different signal and noise amplitudes and different phases, and they need to be combined in a sensible way to preserve SNR and data quality.
Solution: Weighted coil reconstruction
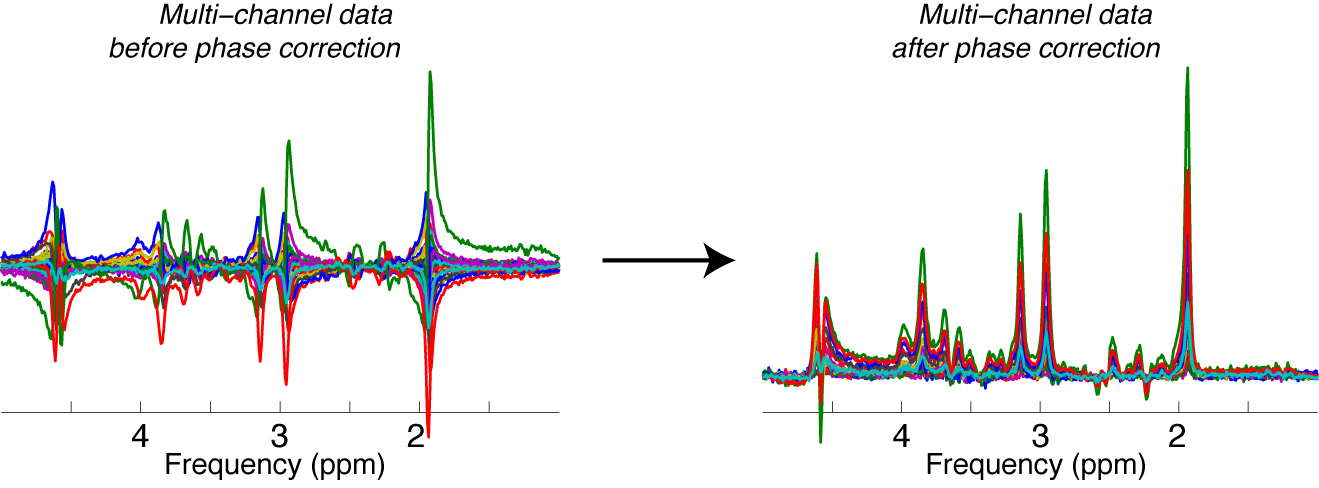
First, for coherent summation of RF channels, automatic zero-order phasing must be performed to ensure that all channels have the same phase prior to combination (Figure 4). Second, a weighted combination should be performed such that high-SNR channels weighted more strongly than noisy channels. As described by Hall et al. (1), the optimal SNR is achieved when each RF channel, i, is weighted by Si/Ni2, where S is the signal amplitude and N is the noise amplitude. For automated detection of coil phases and weights, it is recommended to use the water unsuppressed data for its high SNR.
Problem: Subject Motion
Minor subject motion, such as physiological motion or small movements, results in minor shifts in frequency and phase across averages in an MRS acquisition. Larger subject motion such as head tilting or nodding results in complete distortion of the signal, resulting in corruption of any averages acquired during motion. Subject motion also results in unwanted sampling of tissue outside the prescribed region of interest. Including motion-corrupted averages in an MRS dataset can significantly degrade spectral quality and impede accurate quantification.
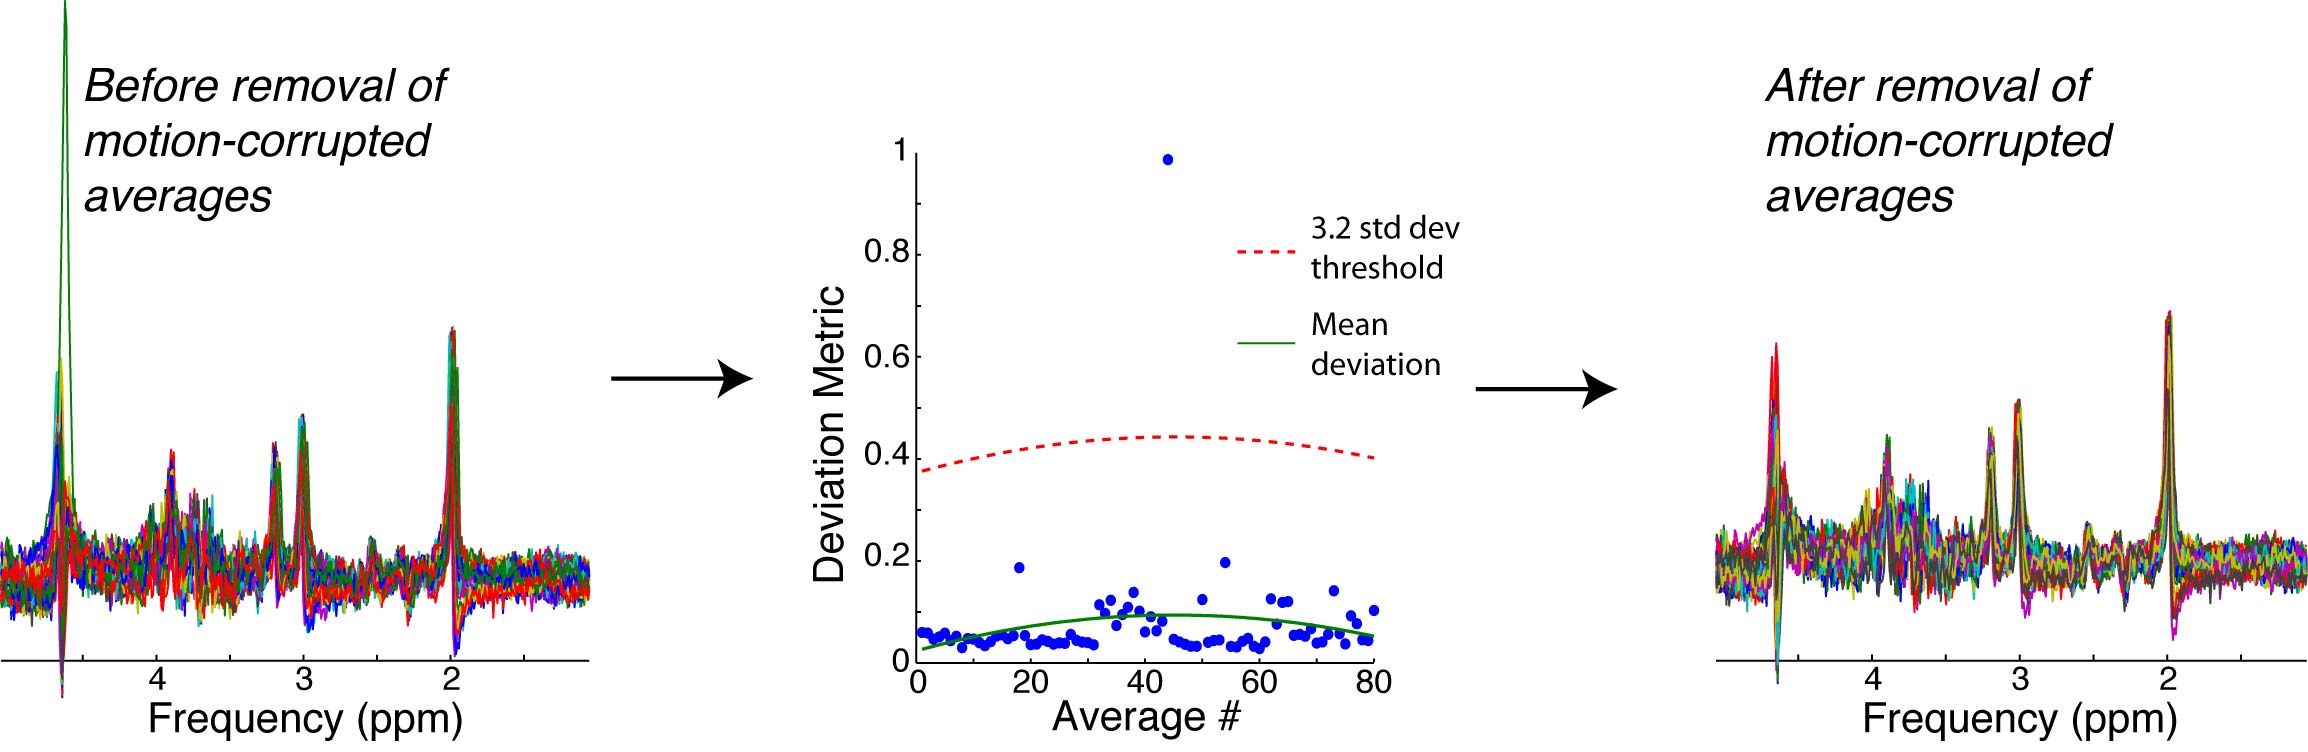
Solution: Removal of motion-corrupted averages
The negative effects of head motion can be mitigated by discarding of motion-corrupted averages from the dataset, though this carries an SNR penalty. Therefore, the removal of motion-corrupted averages presents a trade-off between signal fidelity and SNR. Identification of motion-corrupted averages can be performed automatically using outlier detection methods. One such method is to computing a “deviation metric” which describes how ‘unlike’ a given average is from the other averages (Figure 5). If the deviation metric falls above a certain threshold (usually about 3 standard deviations above the mean), then the average is considered to be corrupted by motion and it is discarded from the dataset (2).
Problem: Frequency and phase drift
Frequency drifts are caused by gradual changes in the main magnetic field strength due to heating and cooling of the passive shims. Phase drifts are caused by physiological motion and small bulk motion, as described in the section above. If not accounted for, frequency and phase drift will result in artefactual broadening of spectral peaks, lineshape distortions, and a reduction in signal-to-noise ratio.
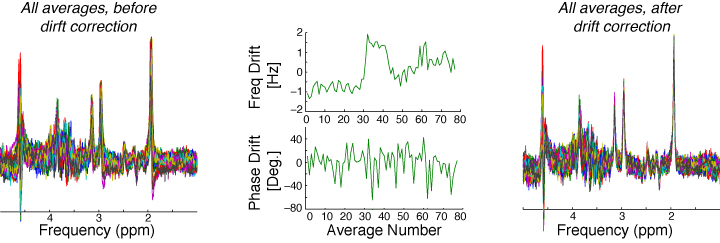
Solution: Frequency and phase drift correction
Frequency and phase drifts can be estimated and corrected in processing, to achieve near complete restoration of signal quality (Figure 6). Several methods of phase and frequency drift correction exist. The simplest method is to use the residual water peak to estimate frequency and phase across averages, however, this method relies on having a large residual water peak, which we generally aim to suppress. A second method is to use a metabolite singlet resonance, such as the creatine resonance (3), for frequency and phase estimation. Again, this method relies in identifying a particular peak of interest, which may be difficult in some applications. A third method is to use spectral registration, which involves aligning the averages to each other in the time domain. This method has been shown to perform better than the residual water method and the creatine fitting method, provided that SNR is moderate to high (4). In cases where the signal-to-noise ratio is very low and spectral registration may fail, it is possible to phase cycle the residual water reference so that it is available in individual averages for drift correction, but cancels to zero when the averages are combined (5).
Problem: Eddy currents
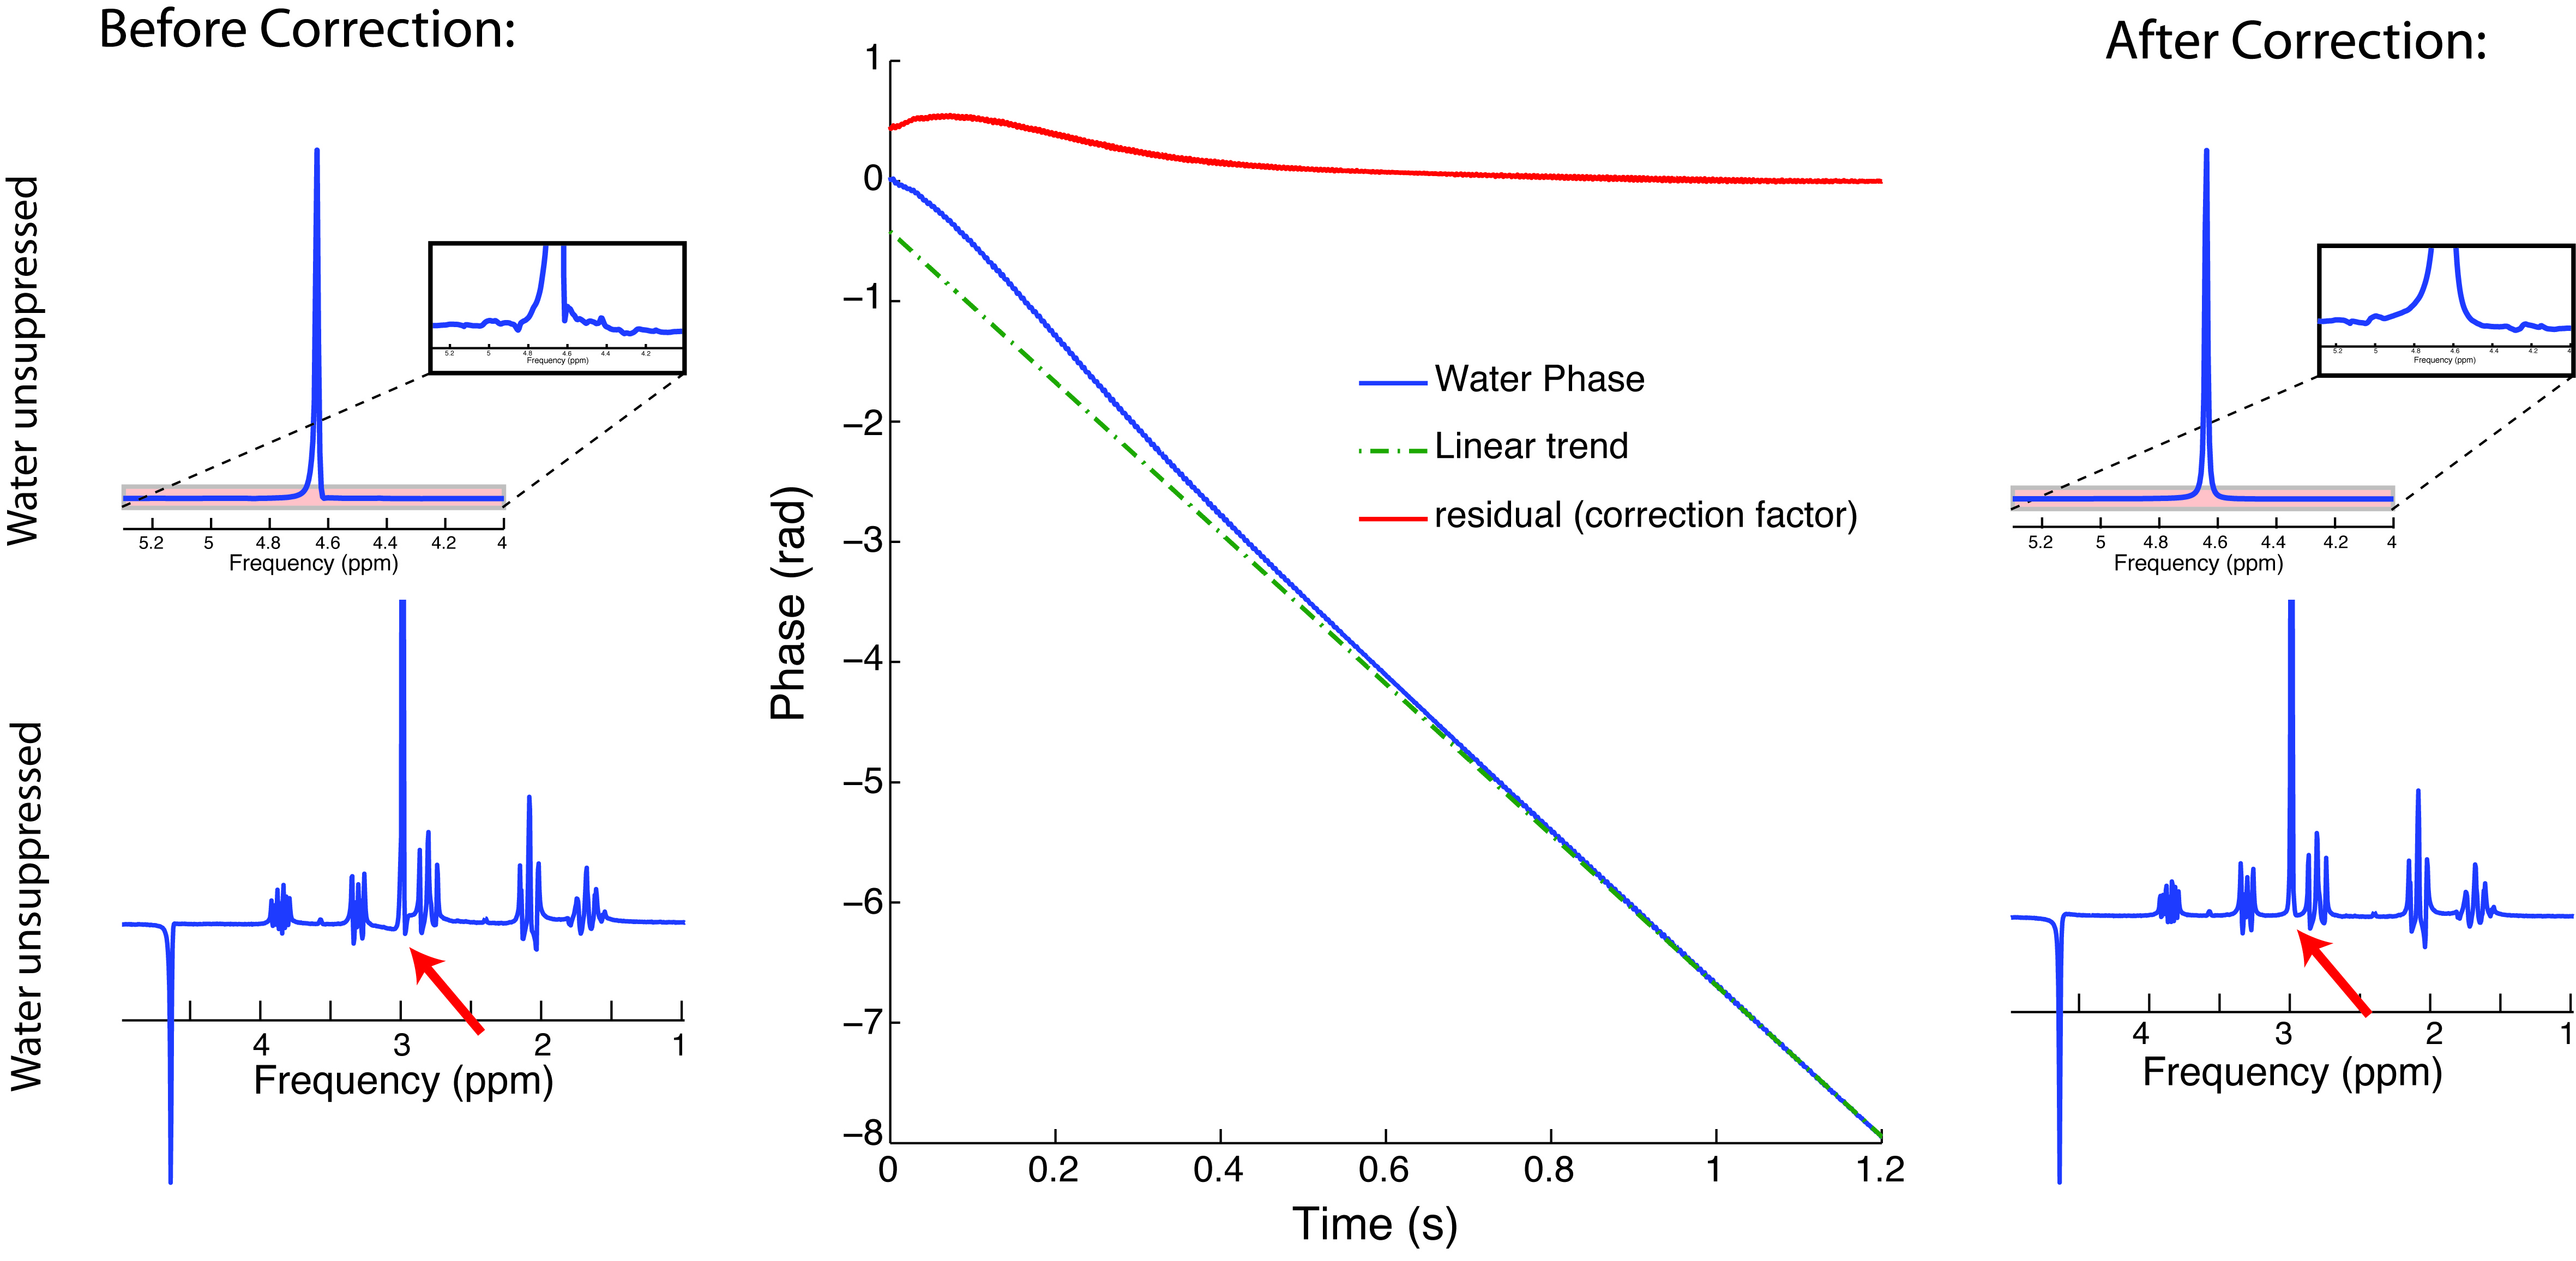
Rapid gradient switching induces eddy-currents in nearby conductive media, resulting in transient magnetic field offsets that can persist during signal acquisition. These transient magnetic field offsets manifest in transient frequency offsets in the early part of the acquired signal (Figure 7, middle). Eddy currents result in distorted spectral lineshapes (Figure 7, left), resulting in quantification errors.
Solution: Eddy-current correction
Eddy current artifacts can be effectively removed by measuring, and correcting the transient phase non-linearity in the FID, as described by Klose (6). The correction factor is typically estimated using the high-SNR water-unsuppressed reference signal, under the assumption that the water-unsuppressed signal will carry the same eddy current offsets as the water suppressed signal. For this reason, it is important to acquire the water unsuppressed reference scan with the water suppression gradients ON, to ensure that eddy currents are identical between water suppressed and water unsuppressed acquisitions. In the absence of eddy currents, the phase of the unsuppressed water FID should be perfectly linear in time. However, temporal frequency shifts induced by eddy currents result in non-linearity of the water phase function (Figure 7, centre). By measuring the non-linearity, a correction factor can be applied to the phase function of both the water suppressed and water unsuppressed signals, thus removing the unwanted eddy current effects. It should be noted that eddy-current correction can be performed automatically in some analysis software packages, such as LCModel, so it is not always necessary to do this yourself.
Problem: misalignment of subtraction sub-spectra
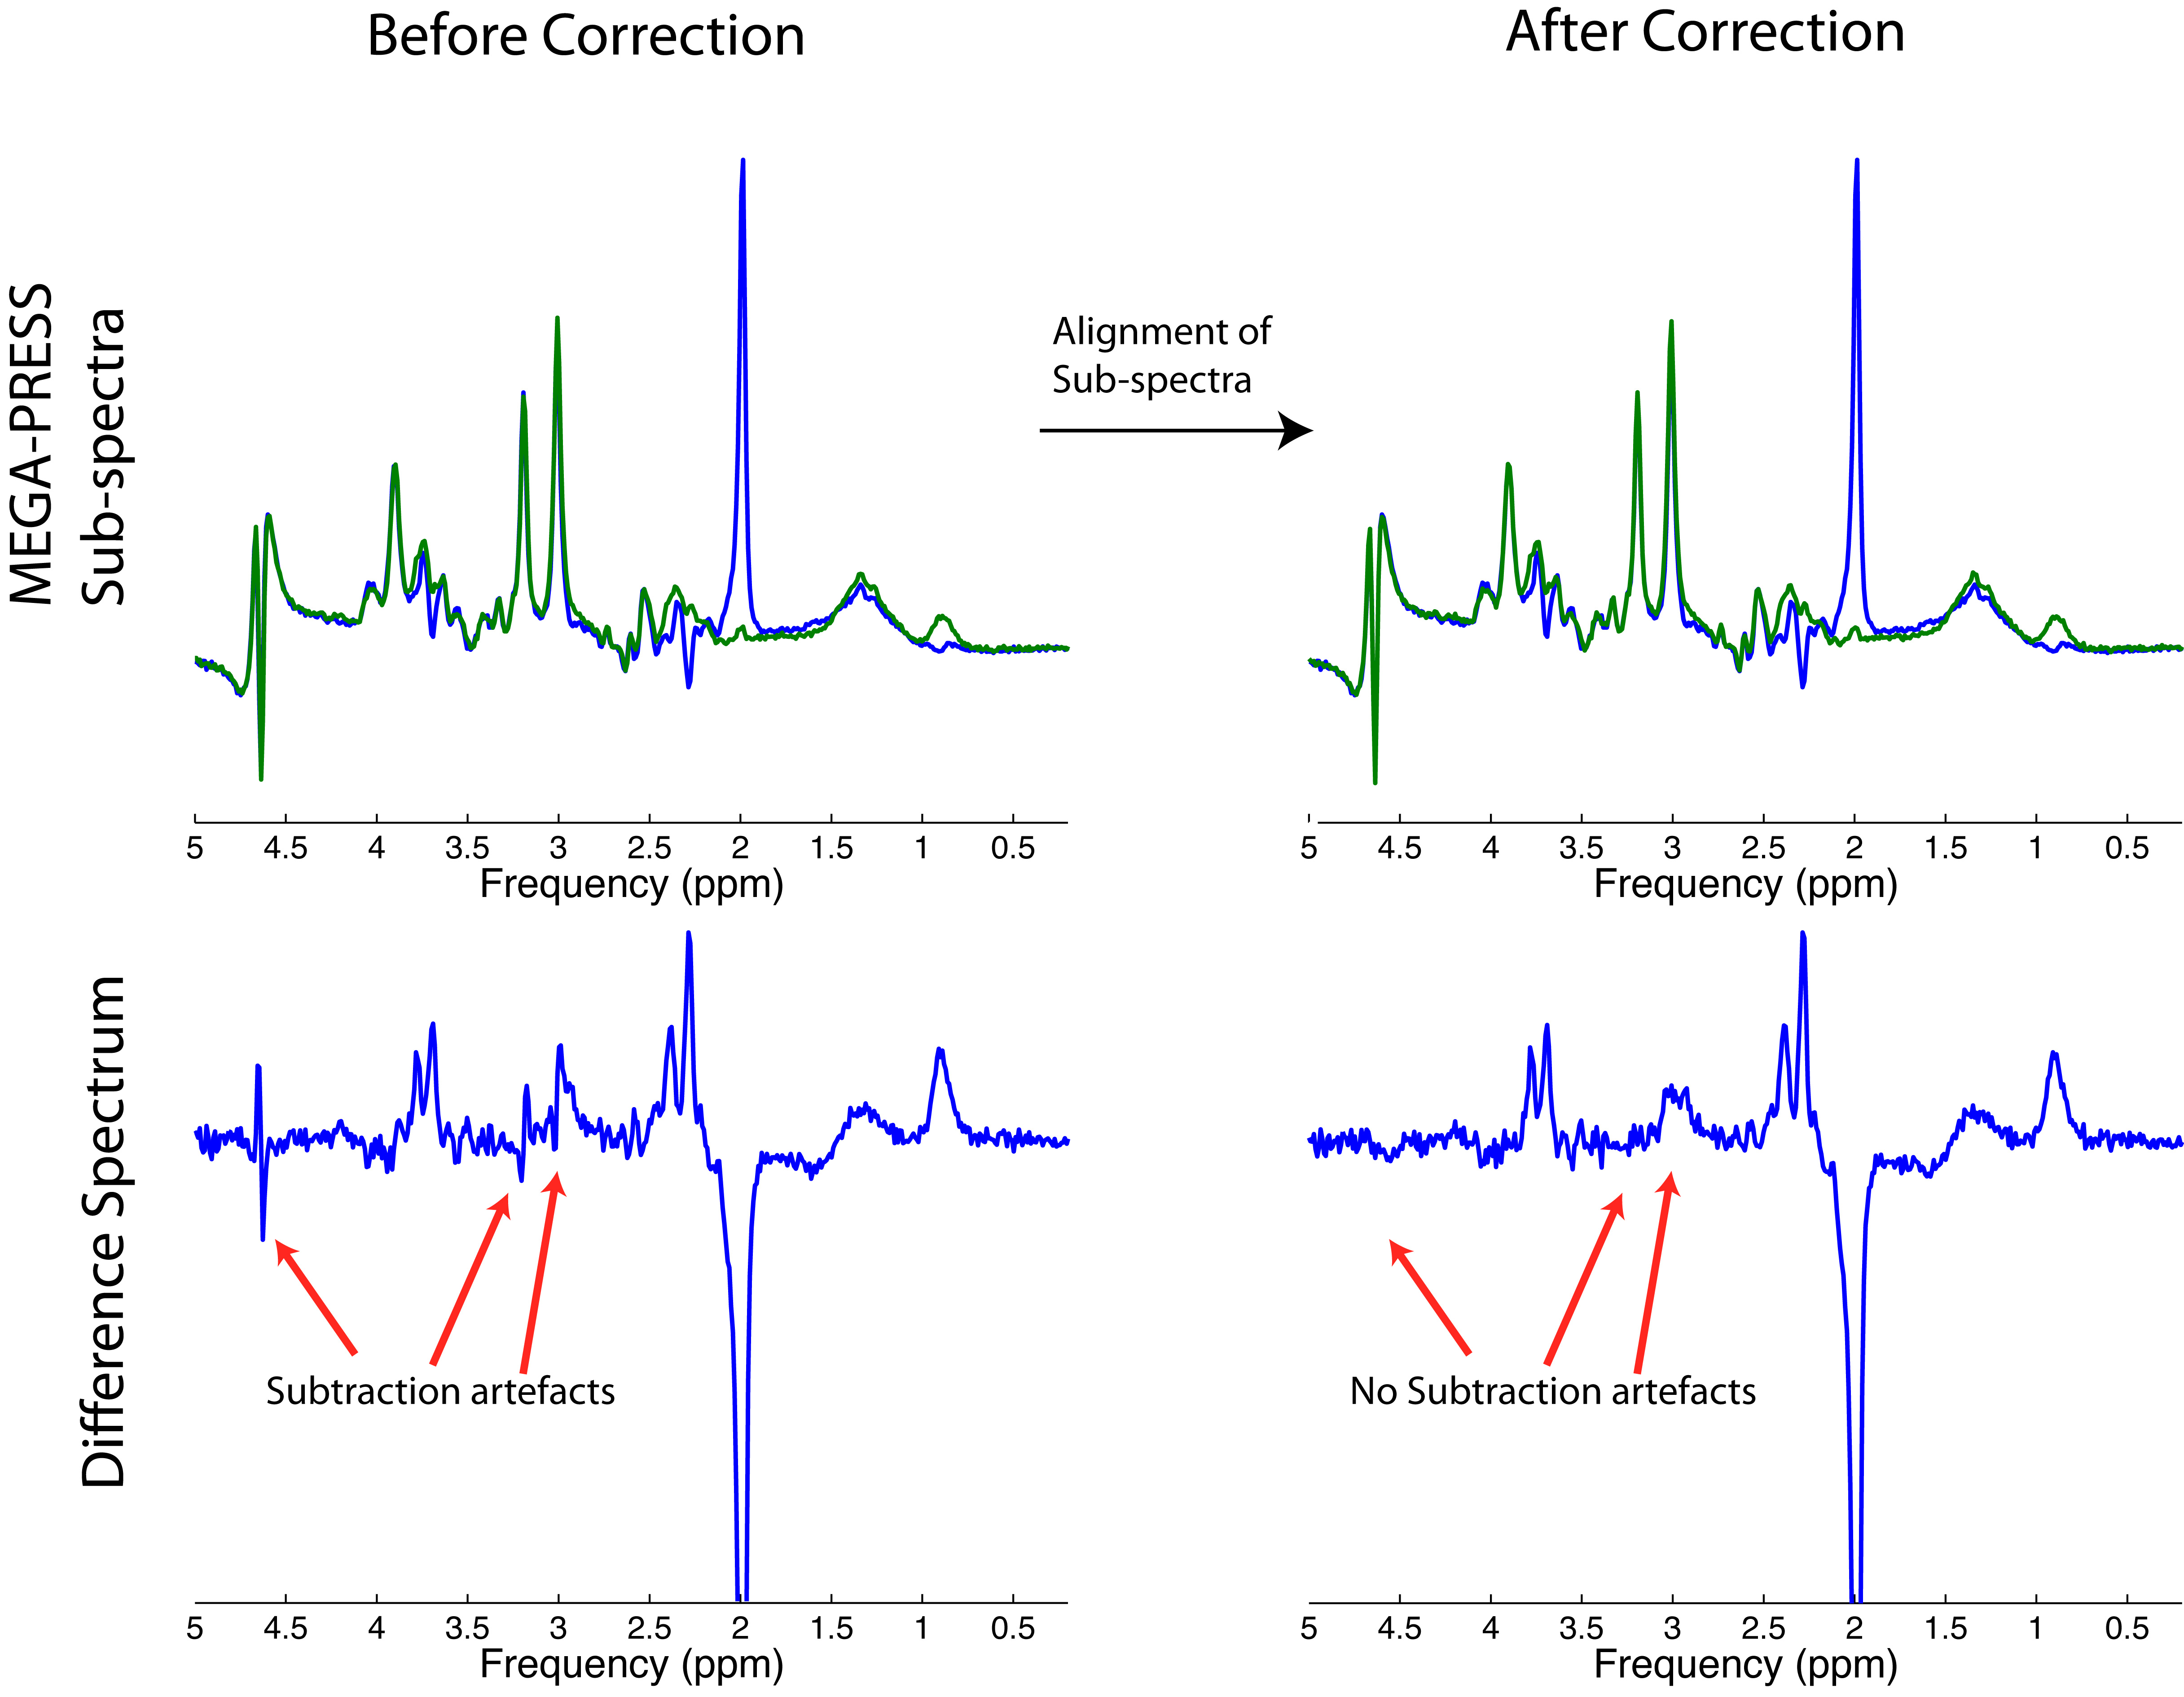
Some sequences involve the acquisition of different sub-spectra, which are then subtracted to yield a ‘difference signal’. Examples of subtraction techniques include J-difference editing techniques (MEGA-PRESS), and ISIS-based localization techniques (SPECIAL). Subtraction of even slightly misaligned subspectra gives rise to unwanted residual peaks in the difference spectrum (Figure 8, left).
Solution: Alignment of subspectra prior to subtraction
Alignment of sub-spectra can be performed either manually (7) or using spectral-registration (2). Proper alignment prior to subtraction minimizes the appearance of subtraction artefacts and improves difference signal quality (Figure 8, right).
Other preprocessing routines that are commonly used but not covered here include: zeropadding, and water removal.
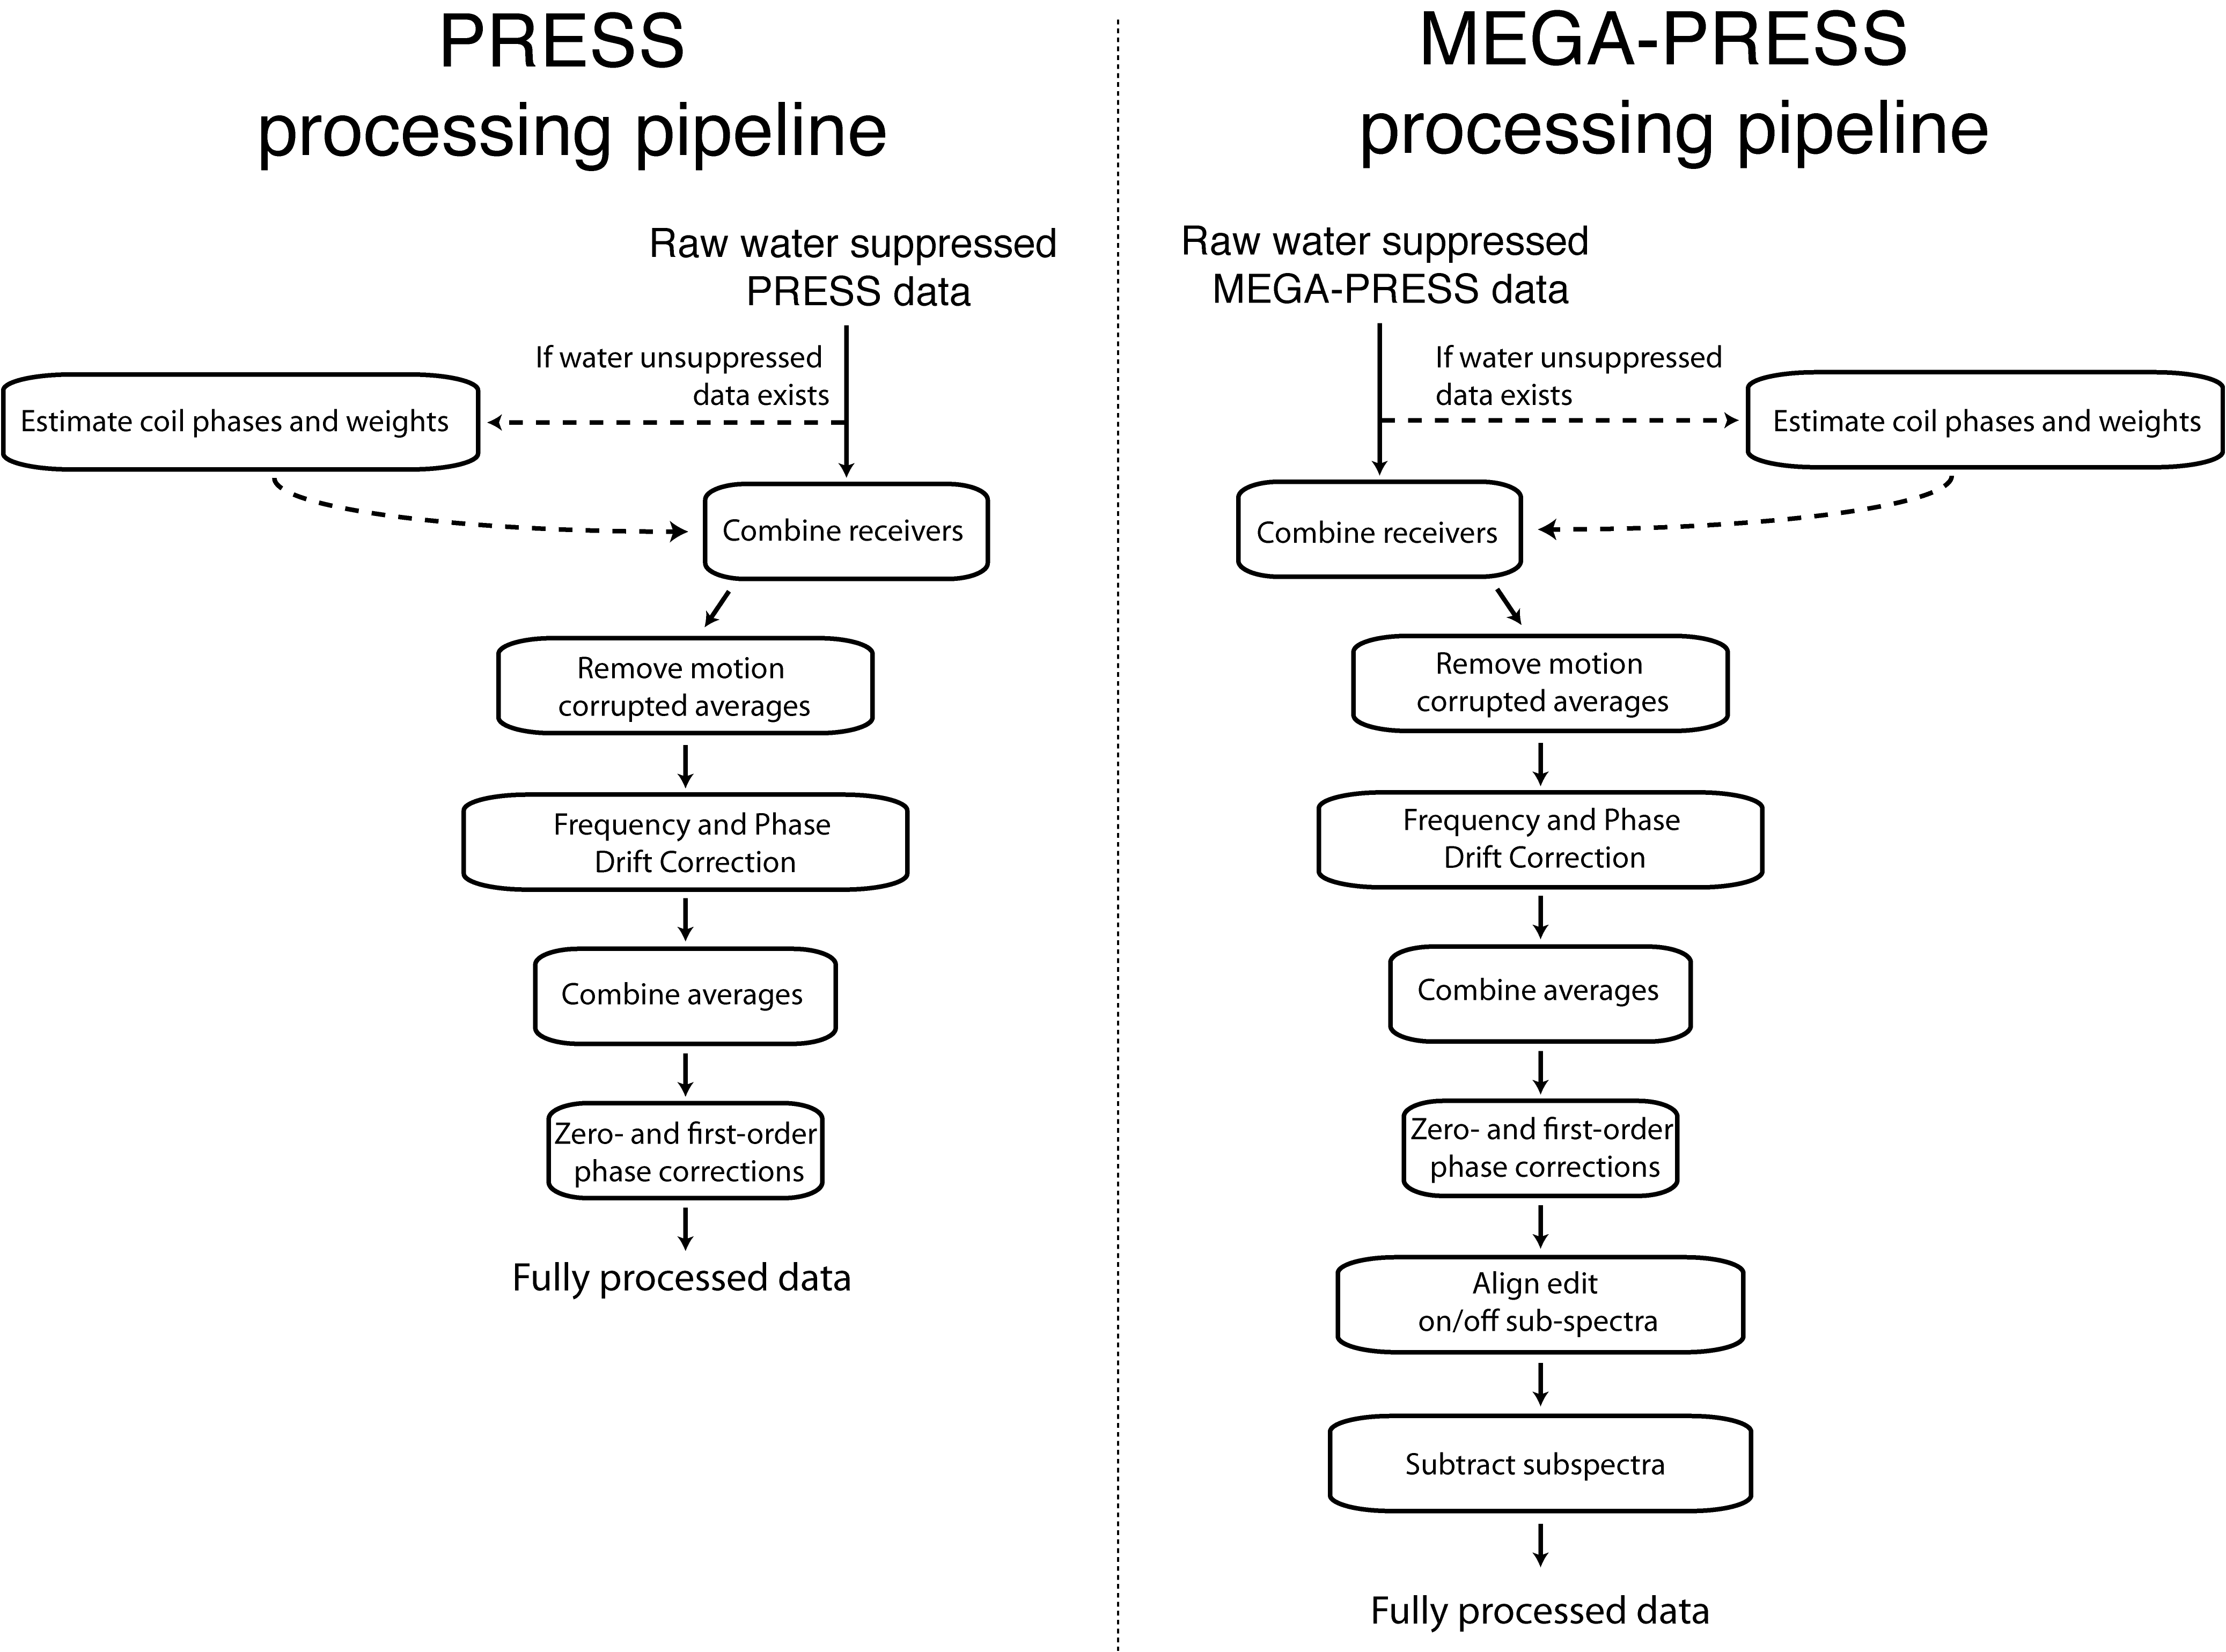
Processing Pipelines
Processing pipelines are a sequential chain of processing operations that are tailored for a specific acquisition. The order of operations should be chosen in a logical way. Figure 9 shows two processing pipelines: one for a standard PRESS sequence, and one for a GABA J-difference editing (MEGA-PRESS) sequence. Note the differences in the pipelines due to the specific processing requirements for each sequence.Conclusion
Spectral preprocessing is an indispensable part of the MRS workflow. It requires care, and can be tedious, but the benefits in terms of spectral quality and improved quantification are well worth the effort!Acknowledgements
I would like to acknowledge my sources of funding: NSERC, CIHR and the Oxford-Brain@McGill-ZNZ Tripartite Partnership in the Neurosciences.References
- Hall EL, Stephenson MC, Price D, Morris PG. Methodology for improved detection of low concentration metabolites in MRS: optimised combination of signals from multi-element coil arrays. Neuroimage 2014;86:35-42.
- Simpson R, Devenyi GA, Jezzard P, Hennessy TJ, Near J. Advanced processing and simulation of MRS data using the FID appliance (FID-A)-An open source, MATLAB-based toolkit. Magn Reson Med 2015.
- Waddell KW, Avison MJ, Joers JM, Gore JC. A practical guide to robust detection of GABA in human brain by J-difference spectroscopy at 3 T using a standard volume coil. Magn Reson Imaging 2007;25(7):1032-1038.
- Near J, Edden R, Evans CJ, Paquin R, Harris A, Jezzard P. Frequency and phase drift correction of magnetic resonance spectroscopy data by spectral registration in the time domain. Magn Reson Med 2015;73(1):44-50.
- Hock A, MacMillan EL, Fuchs A, Kreis R, Boesiger P, Kollias SS, Henning A. Non-water-suppressed proton MR spectroscopy improves spectral quality in the human spinal cord. Magn Reson Med 2013;69(5):1253-1260.
- Klose U. In vivo proton spectroscopy in presence of eddy currents. Magn Reson Med 1990;14(1):26-30.
- Near J, Ho YC, Sandberg K, Kumaragamage C, Blicher JU. Long-term reproducibility of GABA magnetic resonance spectroscopy. Neuroimage 2014;99:191-196.
Figures