FMRI - Ecog Correlates
1Neurosurgery, Washington University School of Medicine, Saint Louis, MO, United States, 2Neurology, Washington University School of Medicine, Saint Louis, MO, United States, 3Radiology, Washington University School of Medicine, Saint Louis, MO, United States
Synopsis
This talk will focus on recent developments in studying the electrophysiologic basis of functional MRI correlations. We will examine methods to measure the spatial correspondence between electrophysiologic band-limited power (BLP) and fMRI correlation patterns in human subjects. We will then discuss the available evidence that correlated, spontaneous activity of the brain exhibits frequency specificity, and outline a hypothesis that the spectral structure of task responses is reflected in the hierarchical organization of RSNs.
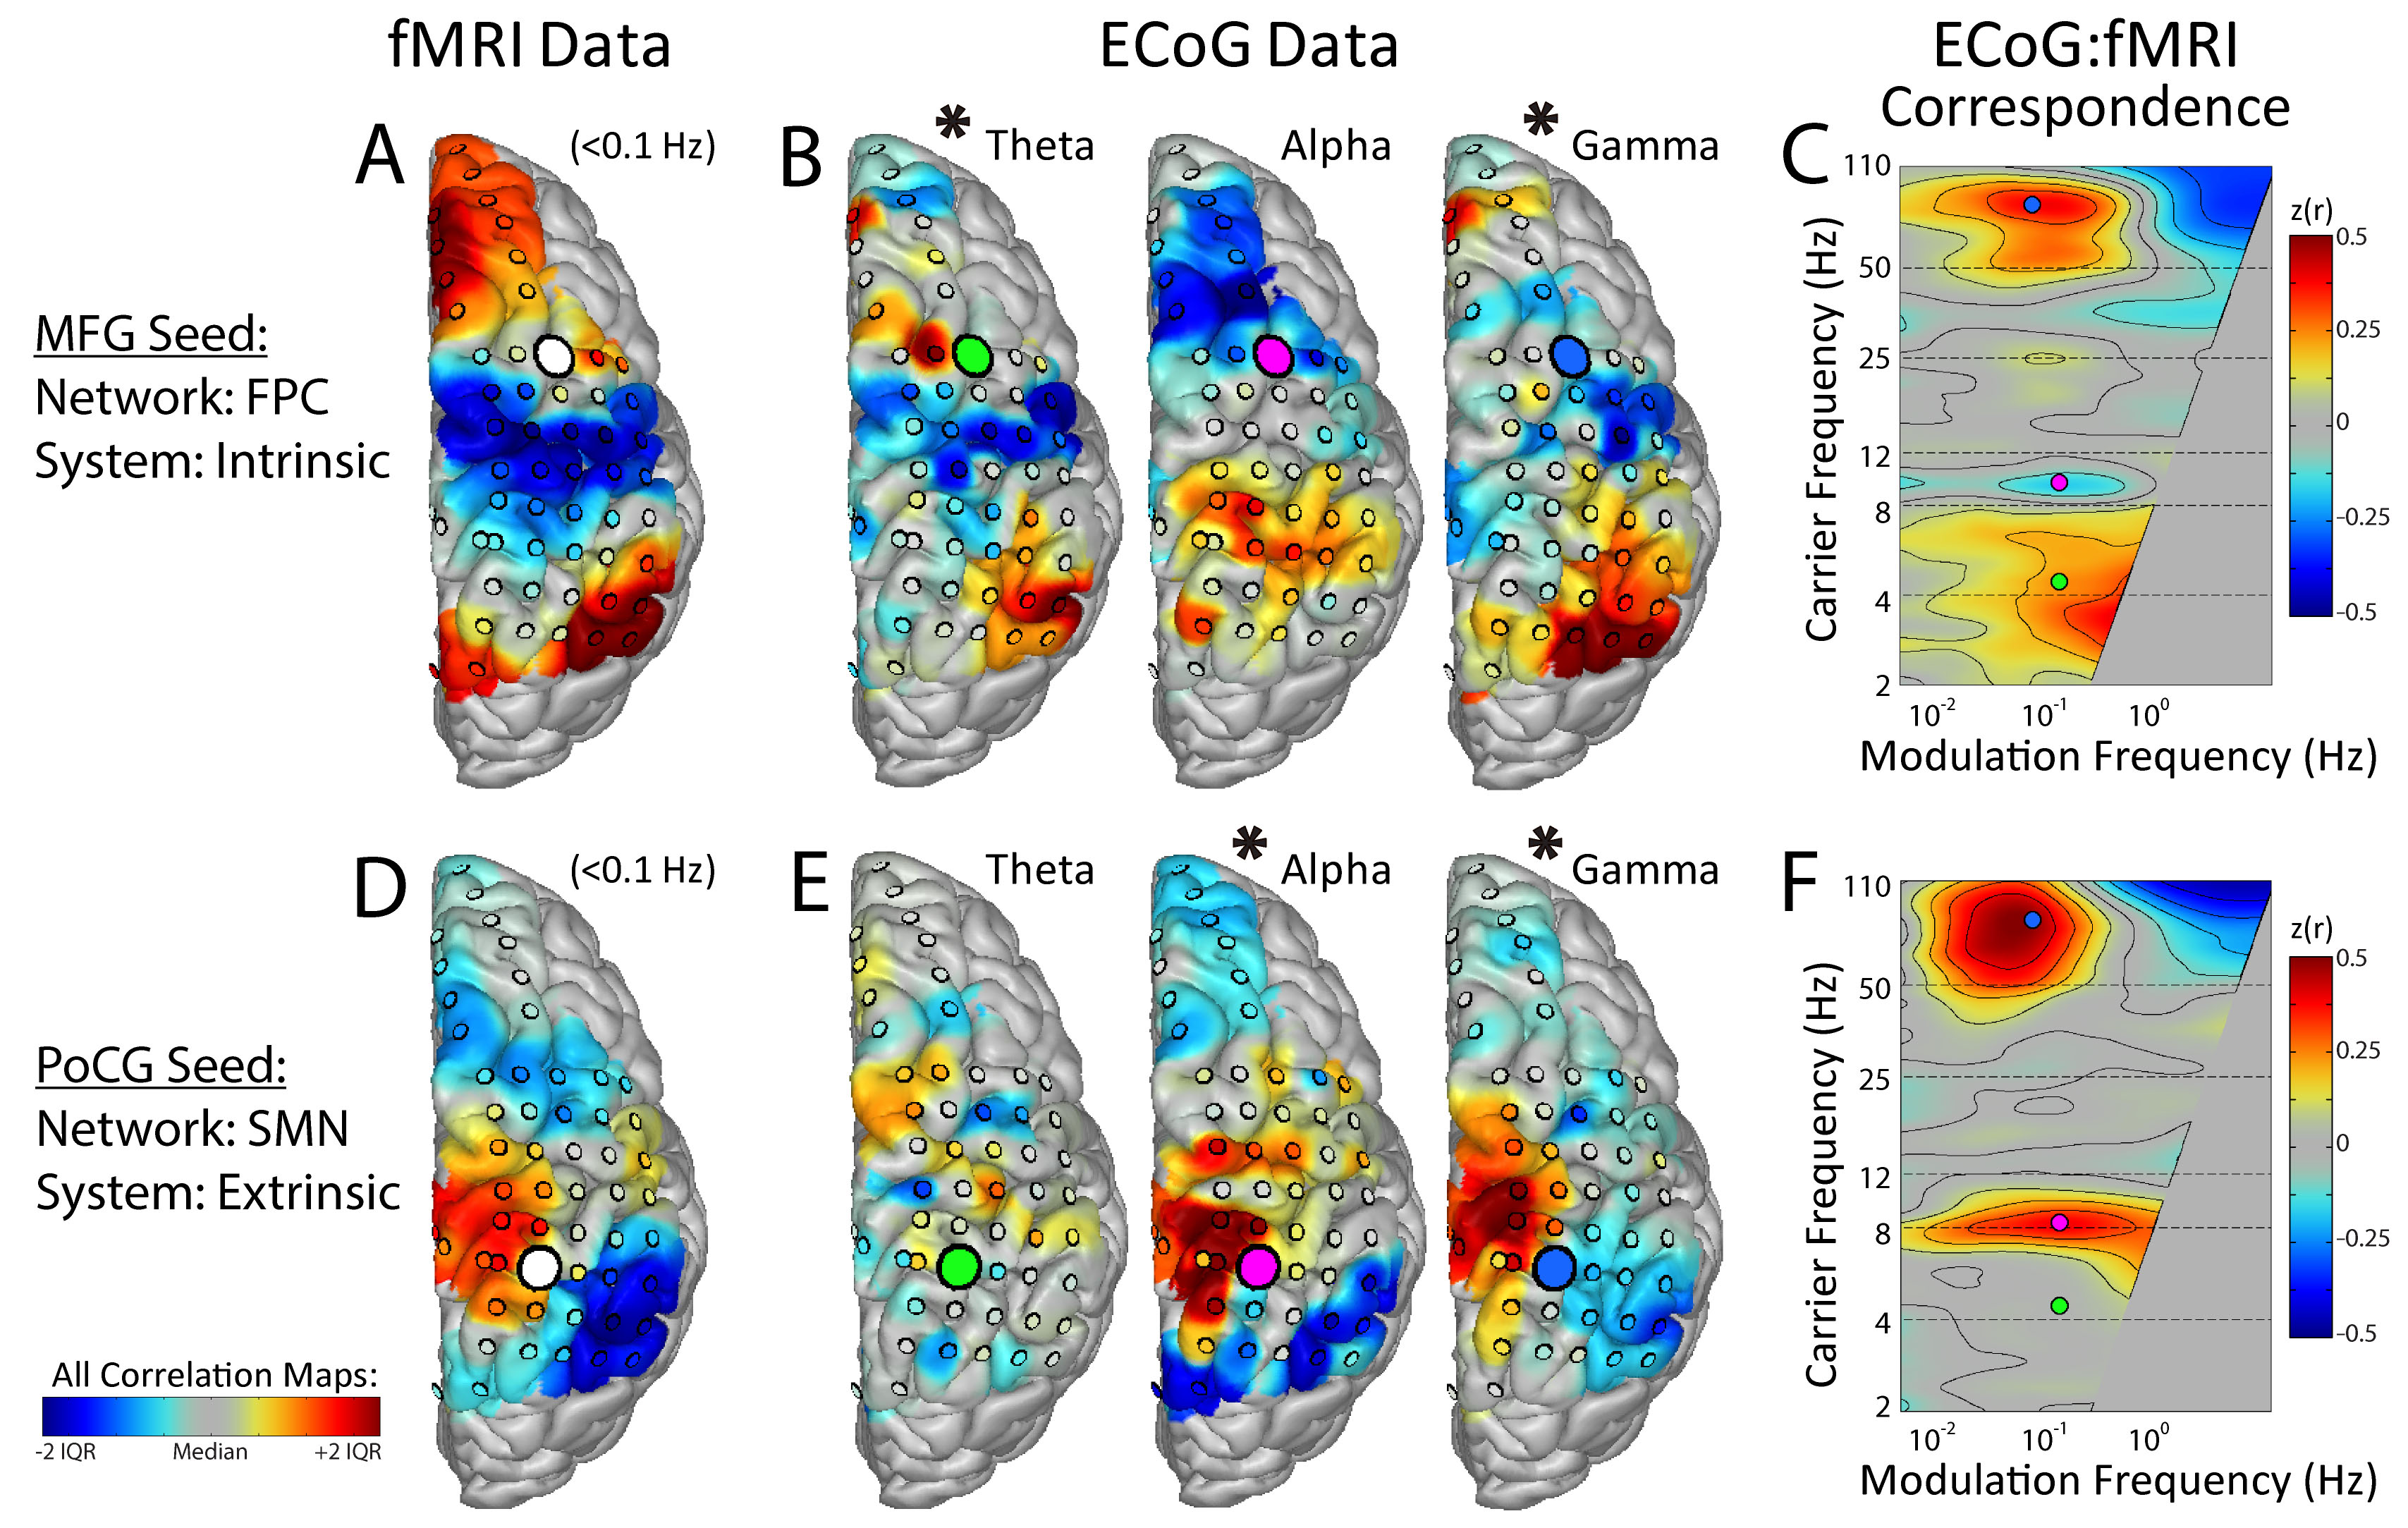
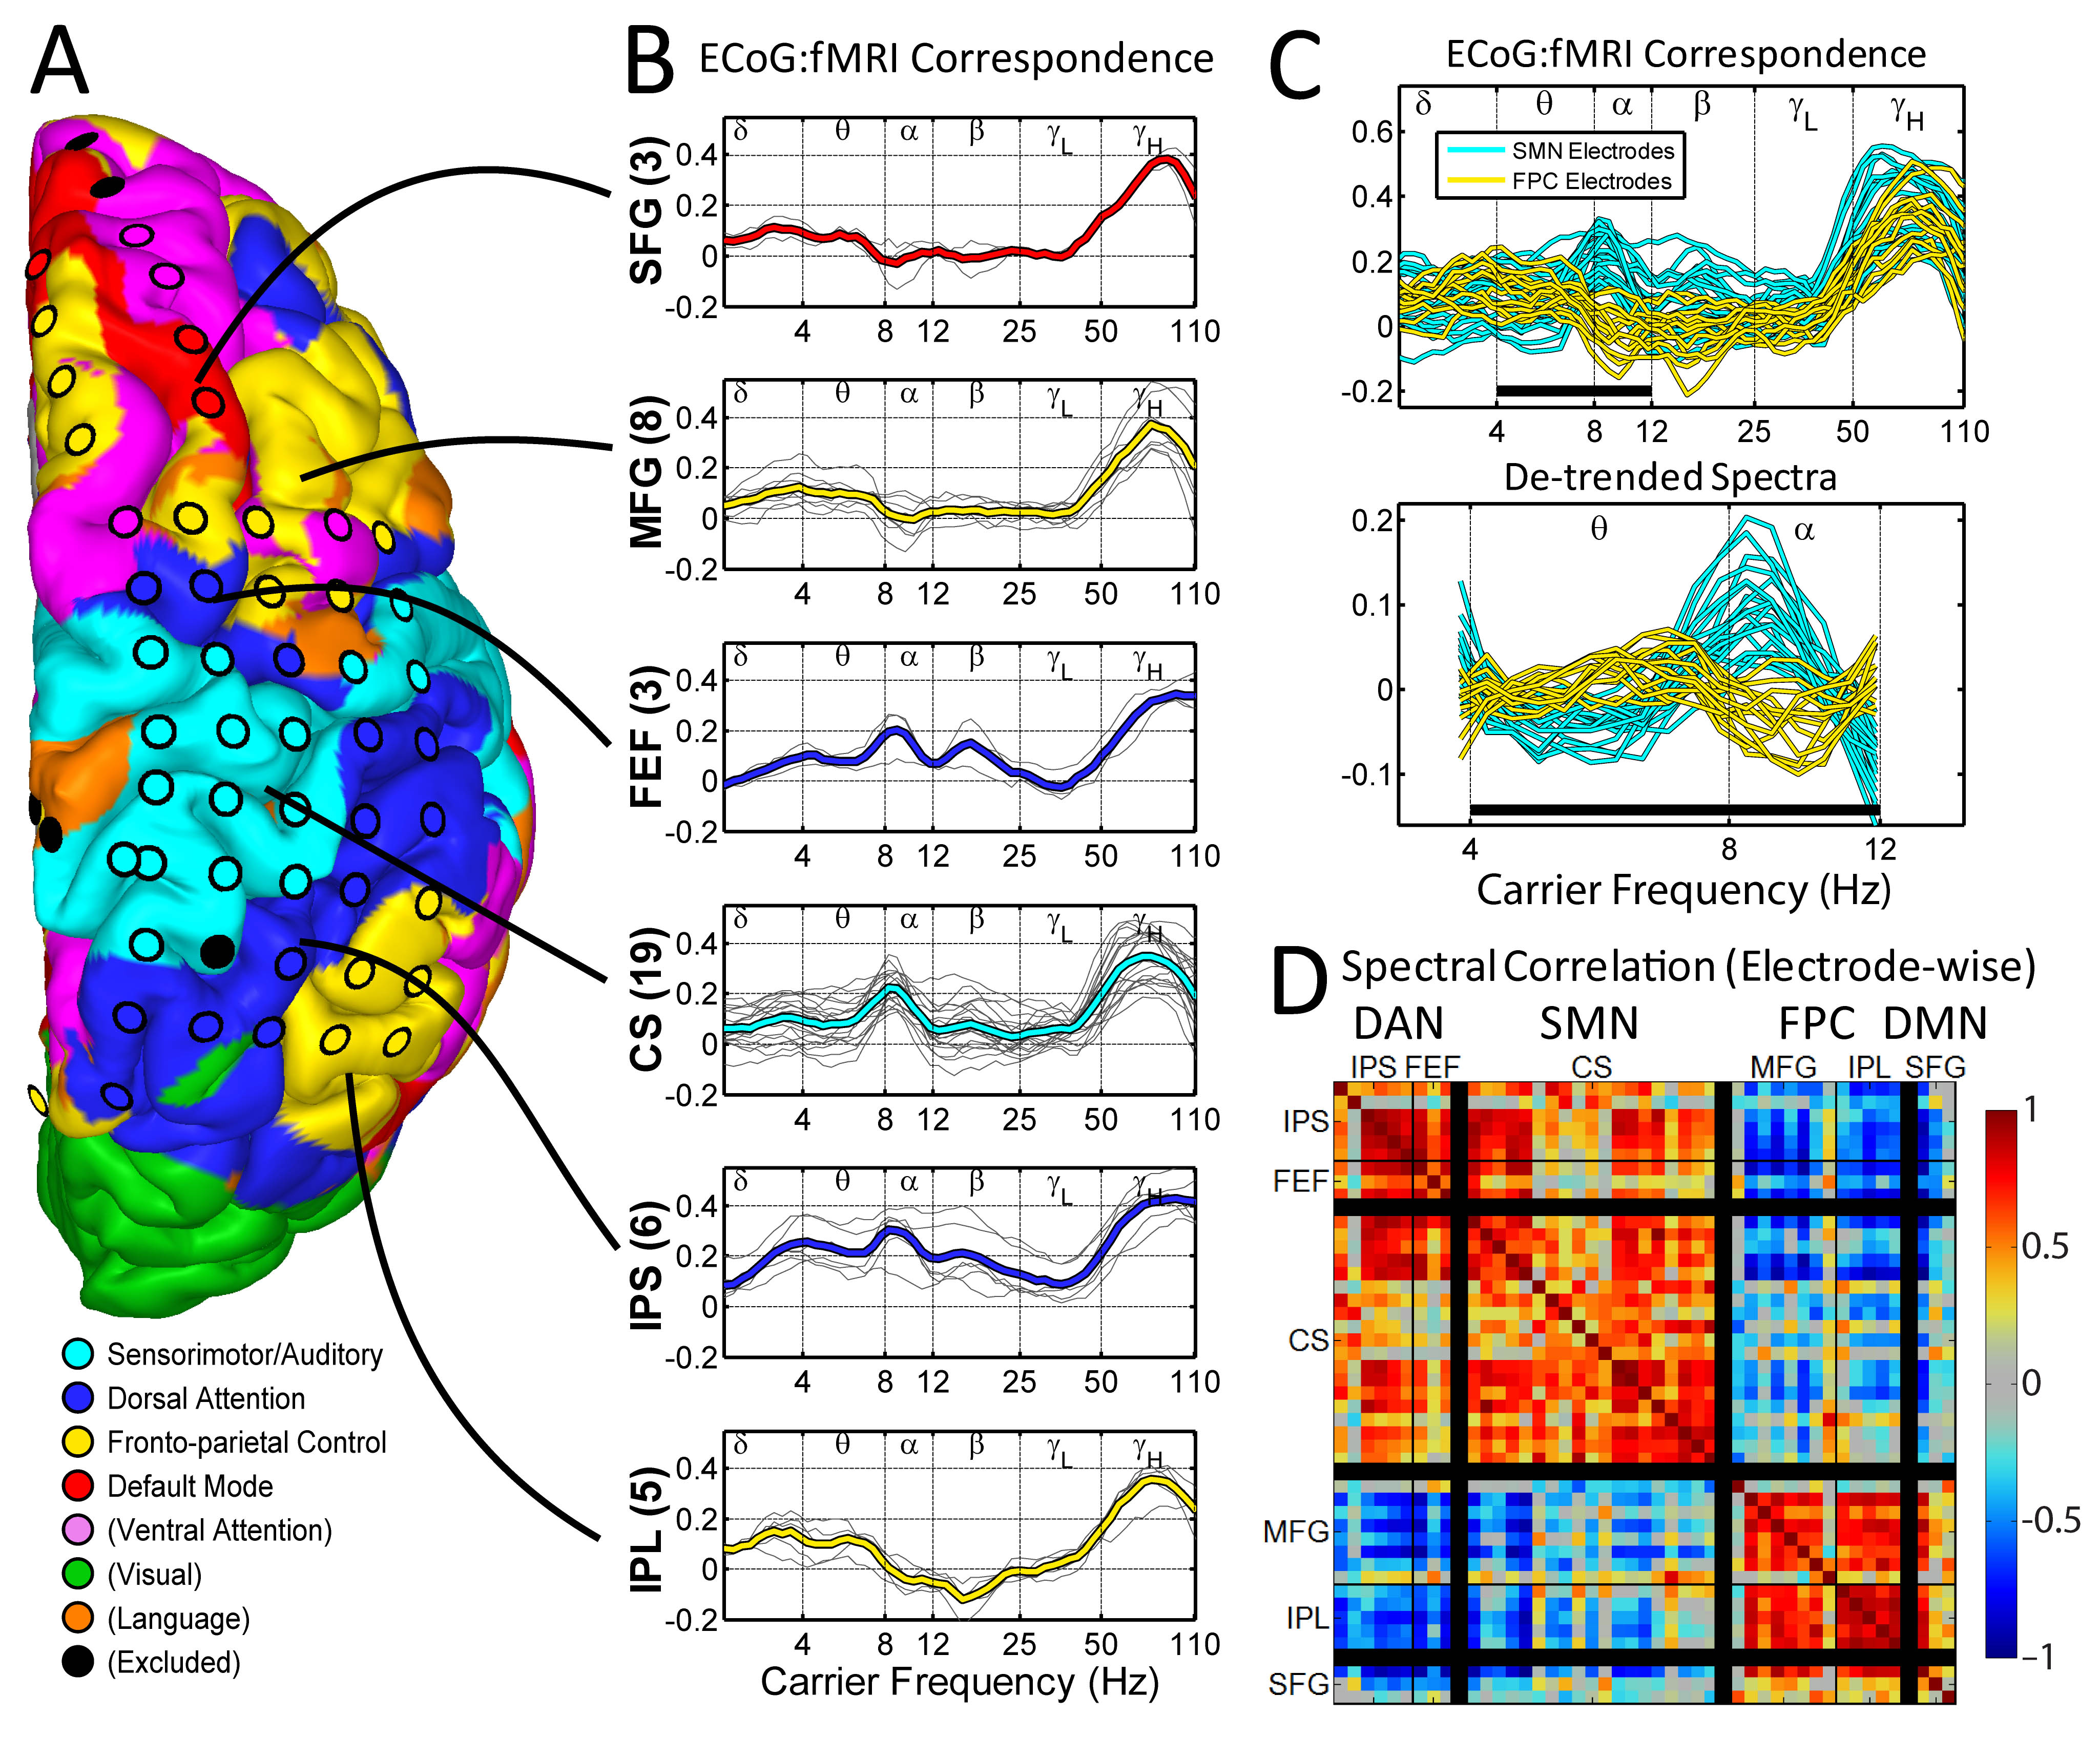
Resting state functional MRI (R-fMRI) studies have shown that slow (<0.1 Hz), intrinsic fluctuations of the blood oxygen level dependent (BOLD) signal are temporally correlated within hierarchically organized functional systems known as resting state networks (RSNs) (Doucet et al., 2011). Most broadly, this hierarchy exhibits a dichotomy between two opposed systems (Fox et al., 2005). One system engages with the environment and includes the visual, auditory, and sensorimotor (SMN) networks as well as the dorsal attention network (DAN), which controls spatial attention. The other system includes the default mode network (DMN) and the fronto-parietal control system (FPC), RSNs that instantiate episodic memory and executive control, respectively. These large-scale neural systems are known to produce spectrally specific electrophysiologic responses to perceptual vs. memory tasks (Klimesch, 1999; Pfurtscheller and Lopes da Silva, 1999).
We will examine methods to measure the spatial correspondence between electrophysiologic (ECoG) band-limited power (BLP) and R-fMRI correlation patterns in human subjects. Some frequencies, such as gamma BLP, correspond to fMRI correlations throughout the brain. However, theta (4–8 Hz) BLP correspondence is stronger in the DMN and FPC, whereas alpha (8–12 Hz) correspondence is stronger in the SMN and DAN. Thus, we will conclude by discussing evidence that the resting human brain, exhibits frequency specific activity that respects both the spectral structure of task responses and the hierarchical organization of RSNs.
Acknowledgements
This work was supported by NIH grants P30NS048056 (to A.Z.S.), R01MH096482-01 (to M.C. and E.C.L.), and F30 MH099877-02 (to C.D.H.), and the The McDonnell Center for Systems Neuroscience.
References
Doucet, G., et al., 2011. Brain activity at rest: a multiscale hierarchical functional organization. J Neurophysiol 105, 2753-2763.
Fox, M.D., et al., 2005. The human brain is intrinsically organized into dynamic, anticorrelated functional networks. Proc Natl Acad Sci U S A 102, 9673-9678.
Klimesch, W., 1999. EEG alpha and theta oscillations reflect cognitive and memory performance: a review and analysis. Brain Res Brain Res Rev 29, 169-195.
Pfurtscheller, G., Lopes da Silva, F.H., 1999. Event-related EEG/MEG synchronization and desynchronization: basic principles. Clinical neurophysiology : official journal of the International Federation of Clinical Neurophysiology 110, 1842-1857.
Figures