The Physiology of Perfusion & Permeability
1Radiology, APHP INSERM PARIS DESCARTES, Paris, France
Synopsis
This presentation will describe the mechanisms of microcirculation within the capillary network, as well as the microvascular parameters.
This knowledge is useful the understand dynamic contrast enhanced MRI (DCE-MRI), design acquisition protocols and analyze the data.
Summary
The terms "hypervascular" and "hypovascular" are often used to describe lesions, although the tissue enhancement after contrast agent injection is the result of different processes occurring at the capillary level, including not only perfusion but also extravascular leakage. The microvascular network formed by the capillaries supplies each of the tissues within the body and permits their development and function, by providing them nutriments and information, as well as allowing the evacuation of there wastes. This capillary network forms a considerable surface area for exchanges between blood and tissues. Each tissue has its own and specific capillary network providing a specific microcirculation regimen (that can vary over time in response to needs, challenges and stresses). The characteristics and performances of each microvascular network can be described by physiological parameters such as tissue blood flow (TBF), tissue blood volume (TBV), permeability x surface (PS), that can be access by DCE-MRI… Since pathological conditions induce changes in the microcirculation, the recording of the microvascular parameters using imaging techniques such as DCE-MRI can be useful for non-invasive diagnosis, prognosis and for treatment strategies.I - Introduction
The purpose of Dynamic Contrast Enhanced MRI (DCE-MRI) is to study no only the blood flow within the capillary networks of the tissues but also the exchanges between the blood and the extravascular space. Functional changes of the microcirculation occur usually before morphological changes that are usually observed, such as tumor growth for example. DCE-MRI may be used at all stages of disease management, for the early detection and characterization of a lesion and to provide a prognosis by providing biomarkers of severity. Recently, this approach has been further developed in order to optimise treatments and monitor the clinical course of lesions during treatment.II - Characteristics and importance of the microcirculation
II-1 Overview
Contrary to the high speed circulation of blood within the large vessels (arteries and veins) that does allow exchanges with the tissues, the circulation within the capillary network is very slow in order to permit vital exchanges between the blood and the tissues. The capillary wall, made of one layer of endothelial cells, is the interface controlling the exchange of nutrients and drugs between the blood and the tissues. These exchanges include supply of oxygen, nutrients, heat, hormones mediators and drugs, as well as removal of by-products including CO2, catabolites, toxins, and other wastes, as well as heat, hormones and mediators etc.. The term "blood perfusion" in the general use, refers to the transit of blood through the microcirculatory network of an organ or tissue. The terms "capillary permeability" and "capillary leakage" refer to the passing through the capillary wall (considered to be a semi-permeable membrane), of a compound which can diffuse into the interstitial space. Each tissue has a specific microcirculatory network with its own characteristics, which are adapted to the specific function of this organ: e.g. continuous brain capillaries are almost impermeable to many substances, including iodinated and gadolinium-based contrast agents (blood-brain barrier), whereas in contrast, hepatic sinusoidal capillaries, with their large fenestrae (pores) are highly permeable to chemical substances up to macromolecules and nanoparticles. Interestingly, pathological tissues have different microcirculatory networks than healthy tissues, allowing to identify and characterize them. For example, cancer tissues have new capillary networks formed by "neoangiogenesis" in response to growth factors, such as the vascular endothelial growth factor (VEGF), secreted by tumor cells. The new and immature capillary networks created by tumor neoangiogenesis have very different morphological and functional characteristics to those of the healthy tissue from which originates the tumor.
II-2 Characteristics of the microcirculation
The microcirculatory network comprises vessels with a diameter of less than 200μm. These are the arterioles, blood capillaries and venules as well as lymphatic capillaries and lymphatic collectors. Capillaries are about 5-8 μm in diameter, when red blood cells have a mean diameter of 7 μm. Red blood cells circulate in single file through the capillaries and must sometimes be deformed in order to pass through smaller capillaries. An adult has about 100,000 km of capillaries, with an estimated total surface area of 1,000 m2 over which exchanges take place. On leaving the capillary, the blood is collected by venules with a diameter of 10 to 200 μm. The microvascular vessel wall consists of a single layer of flattened endothelial cells. Exchanges of elements contained in the blood and the extravascular space of tissues are governed by the endothelial wall. A few contractile smooth muscle cells, called pericytes, surround the endothelial cells. These smooth muscle cells can contract, reducing the diameter of the feeding arterioles and capillaries, in order to regulate blood flow within this microcirculatory network. Depending on their physicochemical characteristics (size, shape, polarity etc.) blood components may cross the capillary wall by convection or transmembrane diffusion through pores and channels in endothelial cells, or via the junctions between endothelial cells. The junction between endothelial cells may be tight or loose, depending on the type of capillary network. The impermeability of the Blood Brain Barrier to most molecules is due to the presence of tight junctions sealing adjacent endothelial cells of brain capillaries. In such capillaries specific molecules like insulin, leptin and transferring, for example, may be allowed to cross the capillary wall via receptor mediated transcytosis through the endothelial cell.
II-3 Physiological parameters of microcirculation
Microcirculatory parameters are generally expressed for a given mass or volume of tissue so that different tissues can be compared. As in cross-sectional imaging a voxel represents one volume element of tissue, therefore the parameters of the microcirculation are expressed per unit of volume (often 100ml of tissue). Table 1 ·
The tissue blood flow (FT) corresponds to the blood flow entering (and exiting) a volume of tissue (expressed in ml of blood/min/100ml of tissue). For brain we use the term Cerebral Blood Flow (CBF). Tissue blood flow is often referred to by the short and ambiguous term ' tissue perfusion'. ·
The tissue blood volume (BVT) or blood volume fraction (νb) corresponds to the volume of capillary blood contained in a certain volume of tissue. This ratio is expressed in ml of blood/100 ml of tissue or in %. For the brain we use the term Cerebral Blood Volume (CBV). The tissue blood volume is often referred to by the misnomer "blood volume". ·
The mean transit time (MTT) is the mean time taken by blood to pass through the capillary network ie the transit time between the arterial inflow and venous outflow (expressed in s). MTT can be calculated as the ratio between the tissue blood (or plasma) volume and the tissue blood (or plasma) perfusion rate: MTT = νs/FT according to the “central volume theorem” of Stewart and Hamilton. ·
The permeability–surface area product (PxS often written PS) is the flow of molecules through the capillary membranes in a certain volume of tissue (expressed in ml/min/100ml tissue). While the tissue blood flow and blood volume parameters are constant for a capillary network at any given time and are not influenced by the type of contrast agent used, there is a specific value of PS for each type of molecule (including the contrast agent used for functional imaging) because each type of molecule behaves specifically. PS is sometimes mistaken with Ktrans, but in fact the PS only corresponds to Ktrans under very specific conditions. ·
The transfer constant Ktrans is a complex combination of tissue blood flow and PS in varying proportions depending on the circulatory system and measurement conditions ·
The tissue interstitial volume or extravascular and extracellular volume fraction (νe) is the extravascular volume contained in a volume of tissue, in which extracellular contrast agents may accumulate (expressed in ml of extravascular extracellular volume/100 ml of tissue or %). The distribution volume is often called the "Extravascular Extracellular Space” (EES).
III Mechanisms involved in tissue enhancement kinetics after injection of contrast agent
In order to master the principles of DCE-Imaging and not to be misled by the often complex literature, it is necessary to understand the basic phenomena involved in the kinetics of tissue enhancement. Two essential phenomena occur simultaneously: perfusion in the microcirculatory network and accumulation of contrast media molecules within the interstitium due to capillary leakage, and followed by their release from the interstitium back into the general circulation. These two phenomena have different time courses and kinetics, but they overlap, leading to a potential source of confusion.
III.1 Pure tissue perfusion
During pure tissue perfusion (without leakage to the interstitial space) the behaviour of a molecule of contrast agent can be artificially divided into three phases :1) entry into the capillary network from the arterial imput, 2) followed by circulation in capillary network and 3) and finally exit to the venous collectors back to the general circulation. As all the molecules of contrast agent do not enter the capillary network at the exact same time, the enhancement slope tells us about the tissue perfusion flow. This phenomenon is very fast and can only be reliably recorded if the image acquisition speed itself is very fast (high temporal resolution of less than 3-5 s per image). When the capillaries are filled with blood containing the maximum concentration of contrast agent, and before they start to empty, the maximum (peak) enhancement informs us about the blood volume fraction (provided there is no interstitial leakage). After reaching a peak, the enhancement rapidly decreases during the evacuation of molecules of contrast agent derived from the bolus: the contrast agent re-circulates through the entire body,and is slowly eliminated mostly by renal filtration.
III.2 Leakage of the contrast agent into the extra-vascular space
If the capillary wall is permeable to the contrast agent the leakage of the contrast agent into the extra-vascular extra-cellular space (EES) is proportional to the difference in concentration of contrast agent between the blood plasma and interstitium on both sides of the capillary wall (according to Fick's first law). In other words, as long as the concentration is higher in the plasma than in the interstitium, there are more contrast agent molecules which penetrate into the interstitium across the endothelial wall than contrast agent molecules contained in the interstitium that return to the plasma: the net result is an accumulation of contrast agent molecules in the interstitial space. The accumulation rate is proportional to the difference in concentration of contrast agent across the capillary wall (or concentration gradient), the permeability (P) of this wall to the agent and the total surface area (S) of capillary walls contained in the tissue. In the presence of leakage of contrast media within the intersitial space, the rapid initial slope of enhancement induced by the perfusion is therefore combined with a slower slope induced by the interstitial accumulation of contrast agent. When over time the plasma concentration becomes lower than the interstitial concentration, the balance of flow of contrast agent across the capillary membrane changes direction and the interstitium is gradually emptied of contrast agent molecules. The decrease in signal corresponding to this release is then combined with the purely vascular declining slope. Its kinetic provides information about the tissue interstitial volume fraction. The phenomenon known as "late enhancement" conventionally used to identify fibrotic lesions (cardiac infarction scar, cholangiocarcinoma, ovarian fibroma etc) corresponds to a progressive and significant accumulation of contrast agent in the large interstitial spaces contained within the fibrostic tissue.
III.3 Combination of blood flow and leakage
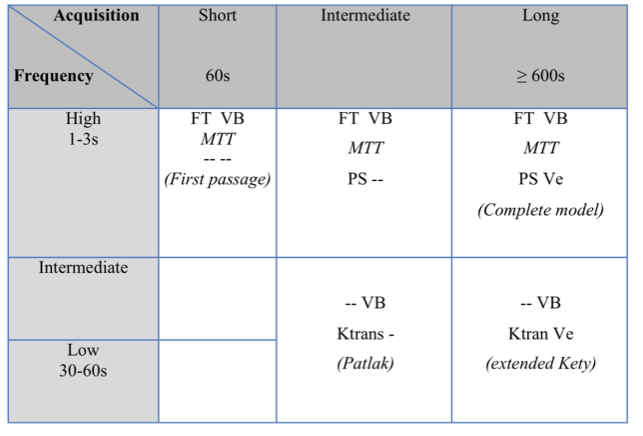
Finally, the net tissue enhancement visible on the images is the sum of the two phenomena of 1-tissue perfusion and 2- interstitium accumulation/release. However, as the chronology and kinetics of tissue perfusion and leakage are different, it is possible to separate and analyze them individually by appropriate mathematical modeling. The parameters of the microvascalar network can be access and measure with DCE-MRI depending on the design of the acquisition and depend on the temporal resolution of the sequence use for dynamic acquisition and the total duration of the acquisition (Table 2).
Conclusion
Imaging can provide functional information about the microcirculation in the healthy and diseased tissues (ischemia, tumors, inflammation etc.) by analyzing the enhancement kinetics induced by injection of a contrast agent. Analysis of these kinetics can provide the microcirculation parameters (Table 1) that can be used as biomarkers.
This analysis requires dedicated software that must be adapted to the type of data collected. A sound understanding of the phenomena involved in microcirculation and of the measurable physiological parameters is important to design and analyze DCE-MRI acquisition (Table 2).
Keywords
microcirculation, perfusion, capillary permeability, capillaries, network, blood flow, DCE-MRI.Acknowledgements
No acknowledgement found.References
• Cuenod CA, Balvay D. Perfusion and vascular permeability: basic concepts and measurement in DCE-CT and DCE-MRI. Diagnostic and Interventional Imaging 2013; 94:1187–1204
• Tofts PS, Kermode AG. Blood brain barrier permeability in multiple sclerosis using labelled DTPA with PET, CT and MRI. J Neurol Neurosurg Psychiatry 1989;52:1019-20.
• Tofts PS, Brix G, Buckley DL et al. Estimating kinetic parameters from dynamic contrast-enhanced T(1)-weighted MRI of a diffusable tracer: standardized quantities and symbols. J Magn Reson Imaging 1999;10:223-32.
• Shames DM, Kuwatsuru R, Vexler V, Muhler A, Brasch RC. Measurement of capillary permeability to macromolecules by dynamic magnetic resonance imaging: a quantitative noninvasive technique. Magn Reson Med 1993;29:616-22.
• Folkman J. Tumor angiogenesis: therapeutic implications. N Engl J Med 1971;285:1182-6.
• Cuenod CA, Fournier L, Balvay D, Guinebretiere JM. Tumor angiogenesis: pathophysiology and implications for contrast-enhanced MRI and CT assessment. Abdom Imaging 2006;31:188-93.
• Sourbron SP, Buckley DL. On the scope and interpretation of the Tofts models for DCE-MRI. Magn Reson Med 2011;66:735-45.
• Thomassin-Naggara I, Darai E, Nassar-Slaba J, Cortez A, Marsault C, Bazot M. Value of dynamic enhanced magnetic resonance imaging for distinguishing between ovarian fibroma and subserous uterine leiomyoma. J Comput Assist Tomogr 2007;31:236-42.
• Sourbron SP, Buckley DL. Tracer kinetic modelling in MRI: estimating perfusion and capillary permeability. Phys Med Biol 2012;57:R1-33.
• Brix G, Zwick S, Kiessling F, Griebel J. Pharmacokinetic analysis of tissue microcirculation using nested models: multimodel inference and parameter identifiability. Med Phys 2009;36:2923-33.
Figures