BOLD Signal/Physiology
1Sir Peter Mansfield Imaging Centre, School of Medicine, University of Nottingham, Nottingham, United Kingdom, 2Division of Clinical Neurosciences, School of Medicine, University of Nottingham, Nottingham, United Kingdom
Synopsis
Functional MRI has become a standard technique for exploring brain function, however this imaging modality is not a direct measure of neural activity. This course introduces the source of Blood Oxygenation Level Dependent (BOLD) contrast and the physiological mechanisms that drive the haemodynamic response to neural activity. The limitations and challenges of using blood as a surrogate for brain function are discussed, particularly in cohorts with differing cerebrovascular physiology. Potential solutions involving additional imaging modalities and complementary MRI contrast mechanisms may enable accurate understanding of the neuro-vascular processes underlying BOLD fMRI.
Highlights
- BOLD contrast results from changes in T2* linked to deoxyhemoglobin in blood
- The BOLD signal is an indirect surrogate for neural activity, reflecting the increase in blood flow to “activated” brain tissue
- BOLD contrast is inherently ambiguous: both neural and physiological mechanisms can drive local signal changes
- Combining BOLD fMRI with complementary imaging modalities and additional MRI contrast weightings enables understanding of underlying neuro-vascular processes
Target Audience
Researchers who wish to understand the physiology underlying the BOLD fMRI time-series, and how this impacts our interpretation of BOLD "activation."Purpose
Functional MRI has become a standard technique for exploring brain function. Although it provides excellent spatial resolution and brain coverage, this imaging modality is not a direct measure of neural activity. This course introduces the source of BOLD contrast, the physiological mechanisms that drive the haemodynamic response to neural activity, and the limitations and challenges of using blood as a surrogate for brain function, particularly in cohorts with differing cerebrovascular physiology.Blood Oxygenation Level Dependent (BOLD) contrast
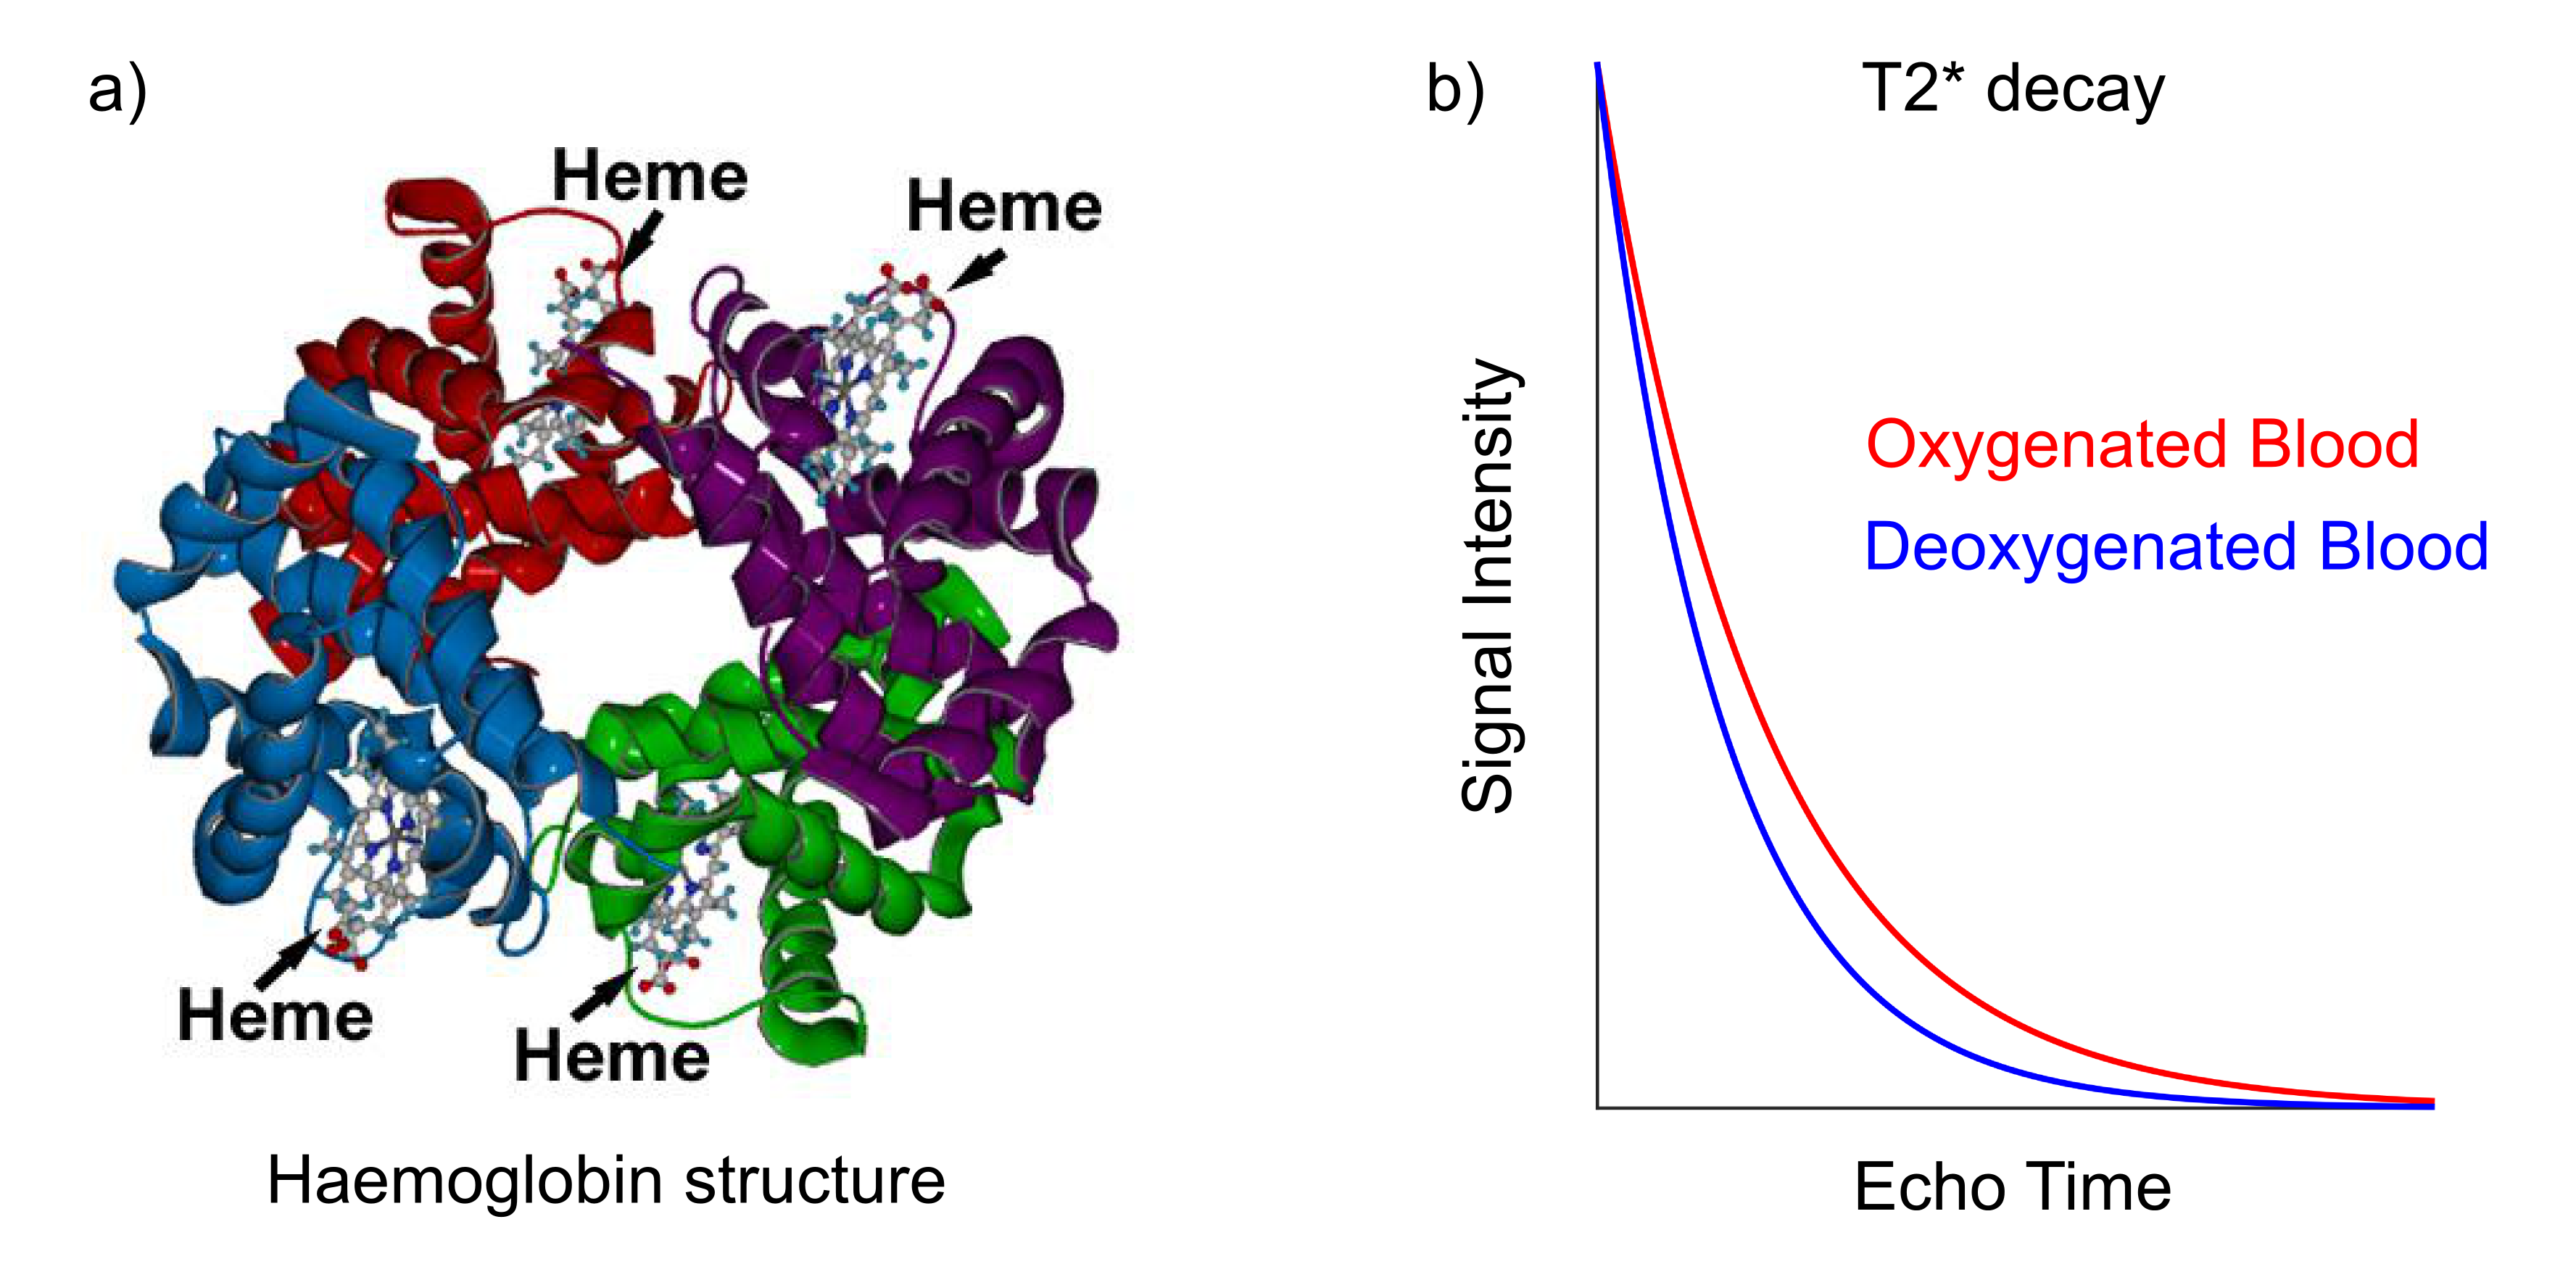
BOLD contrast in MRI arises from the magnetic properties of haemoglobin, the molecules responsible for carrying oxygen in red blood cells. In its fully deoxygenated state, the iron “haeme” groups in haemoglobin exhibit paramagnetic characteristics, disrupting the local magnetic field homogeneity. As oxygen molecules are loaded onto the haemoglobin, they shield the haeme groups and reduce the paramagnetic nature of the total molecule. Large concentrations of deoxyhaemoglobin induce magnetic field gradients that affect the proximal extravascular tissue. These localized field inhomogeneities serve to shorten the T2* of the nearby tissue, and this can be measured using T2*-weighted MRI.
Models for quantifying BOLD contrast have been developed, allowing variations in T2* to be interpreted as changes in blood volume and deoxyhaemoglobin concentrations [dHb]. Yablonskiy and Haacke modeled the diffusion of protons around randomly oriented magnetized cylinders, meant to represent the microvasculature in brain tissue, showing that T2* was inversely proportional to blood volume, the difference in susceptibility between fully oxygenated and fully deoxygenated blood (Δχ), and the fractional amount of deoxyhaemoglobin present1.
The baseline T2* contrast generated by BOLD mechanisms will thus vary across the brain due to the underlying vascular anatomy. Arterial blood is nearly entirely oxygenated, whereas venous blood is approximately 60% oxygenated; this results in voxels with large venous contributions having a shorter T2* and much darker signal intensities.2 Greater blood volumes result in a greater impact of oxygenation on T2*, and the diameter of individual blood vessels will also influence the dephasing effects.3
Functional changes in BOLD contrast
In functional imaging, we are interested in changes in BOLD contrast over time, and numerous physiological factors, including tissue metabolism, blood flow, and blood volume can drive a change in local T2*.4 It is important to understand cerebrovascular physiology in order to link BOLD contrast changes to specific neural or non-neural mechanisms.
The cerebrovasculature is constantly regulating the blood supply to ensure appropriate delivery of oxygen to the downstream tissue, which relies on aerobic metabolism to maintain healthy function. Regulation of blood flow typically occurs in the arterioles, known as resistance vessels, and smaller capillaries. These vessels are surrounded by numerous other cell types, forming the neurovascular unit, which allows sensitive and adaptive regulation of the vessel diameter and blood flow. Endothelial cells, smooth muscle cells, pericytes, neurons, and astrocytes all work in harmony5 to respond to metabolic, neurogenic, circulatory, myogenic and flow-mediated inputs.
The link specifically between neural activity and local blood flow is known as neurovascular coupling. There is minimal excess storage of oxygen in the brain, and small increases in cellular demand for oxygen must be met with increases in the supply via enhanced blood flow. The precise mechanisms of neurovascular coupling are still the focus of immense research interest; vasodilatory chemical factors including adenosine, nitric oxide, H+, K+, Ca2+, and lactate have been implicated, potentially acting in anticipation of or in parallel with neural activity.6 Astrocytes and pericytes have also been implicated.6,7
This coupling results in functional hyperaemia, an increase in blood flow to a region that becomes metabolically "activated." This increase in blood flow exceeds the oxygen delivery needed by the active tissue, resulting in extra oxygen in the venous blood. In turn, this generates a local BOLD signal increase.
Haemodynamic response function
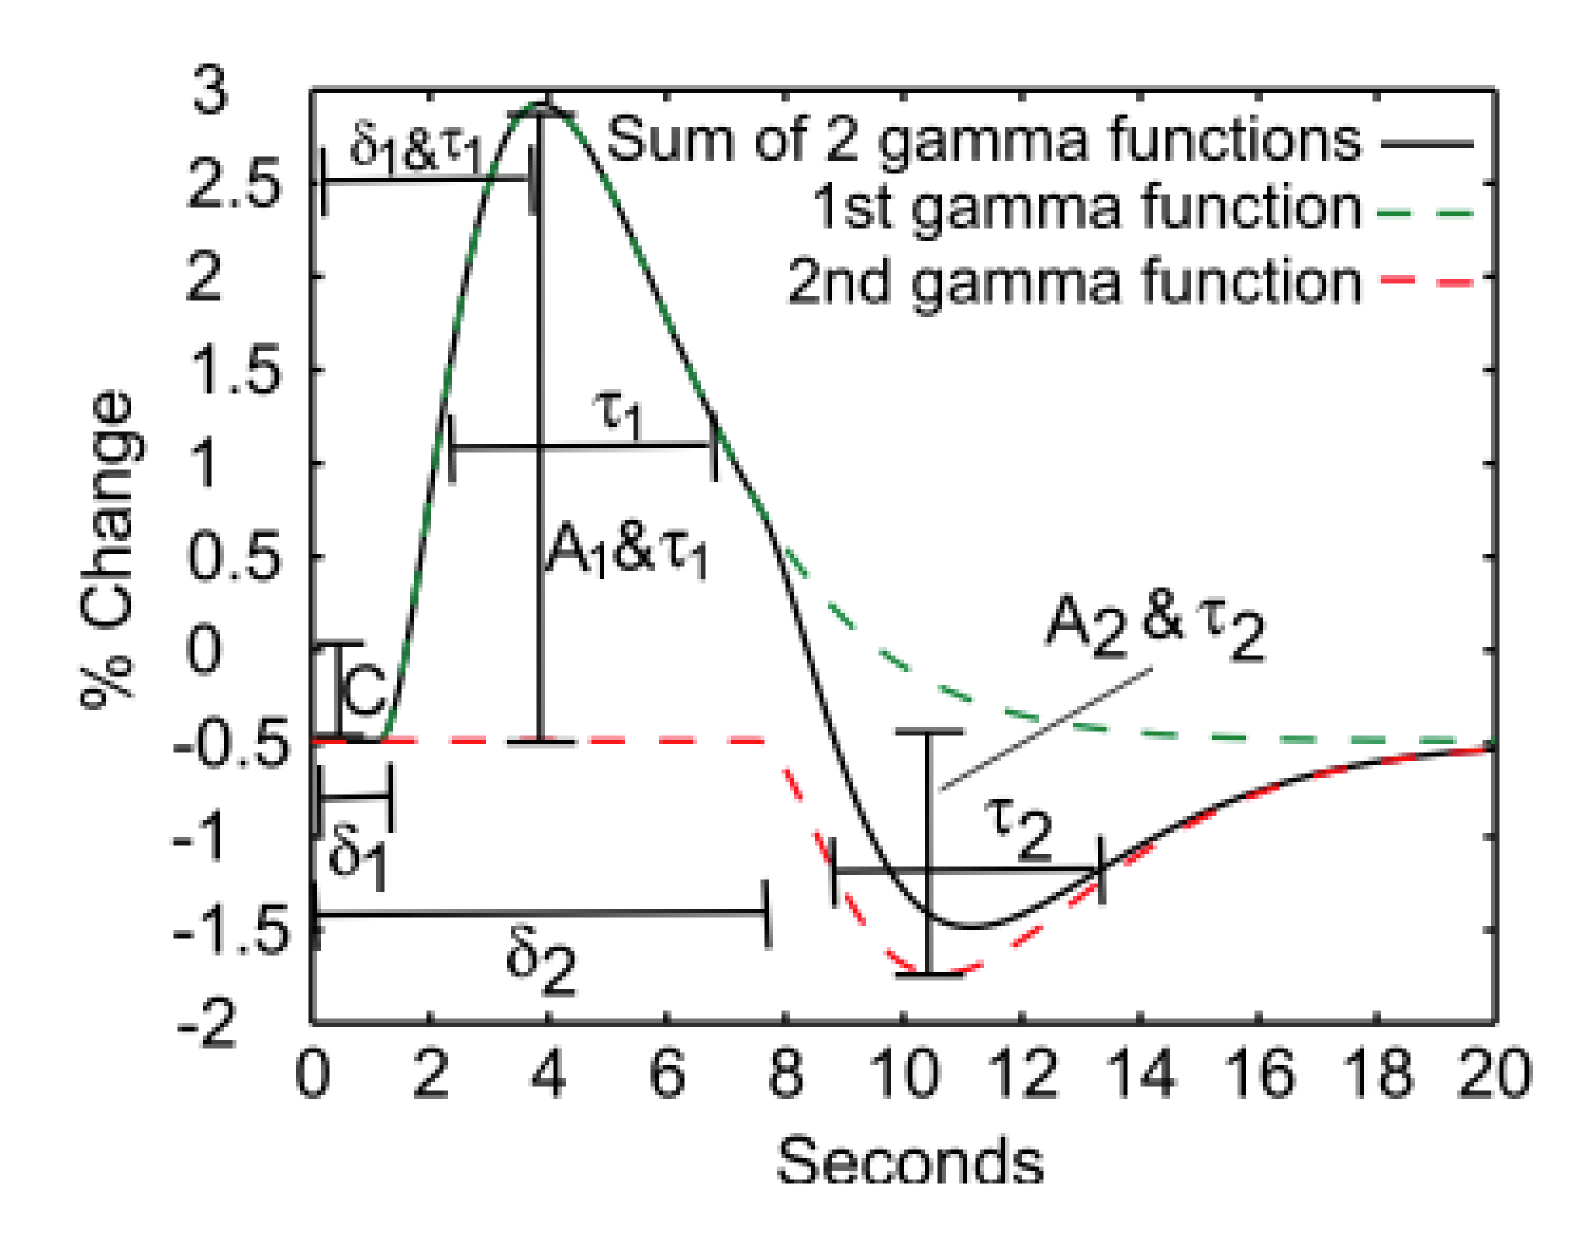
Using fast T2*-weighted scans, it is possible
to assess the transient physiological response of the vasculature to neural
activation. The shape of this haemodynamic
response, typically modeled as a double gamma variate function, reflects
the sluggish vascular response to fast neural activation and the changing local
relationships between blood flow, volume, and oxygenation. Controversy remains
over the metabolic or vascular origins of key features of the BOLD response
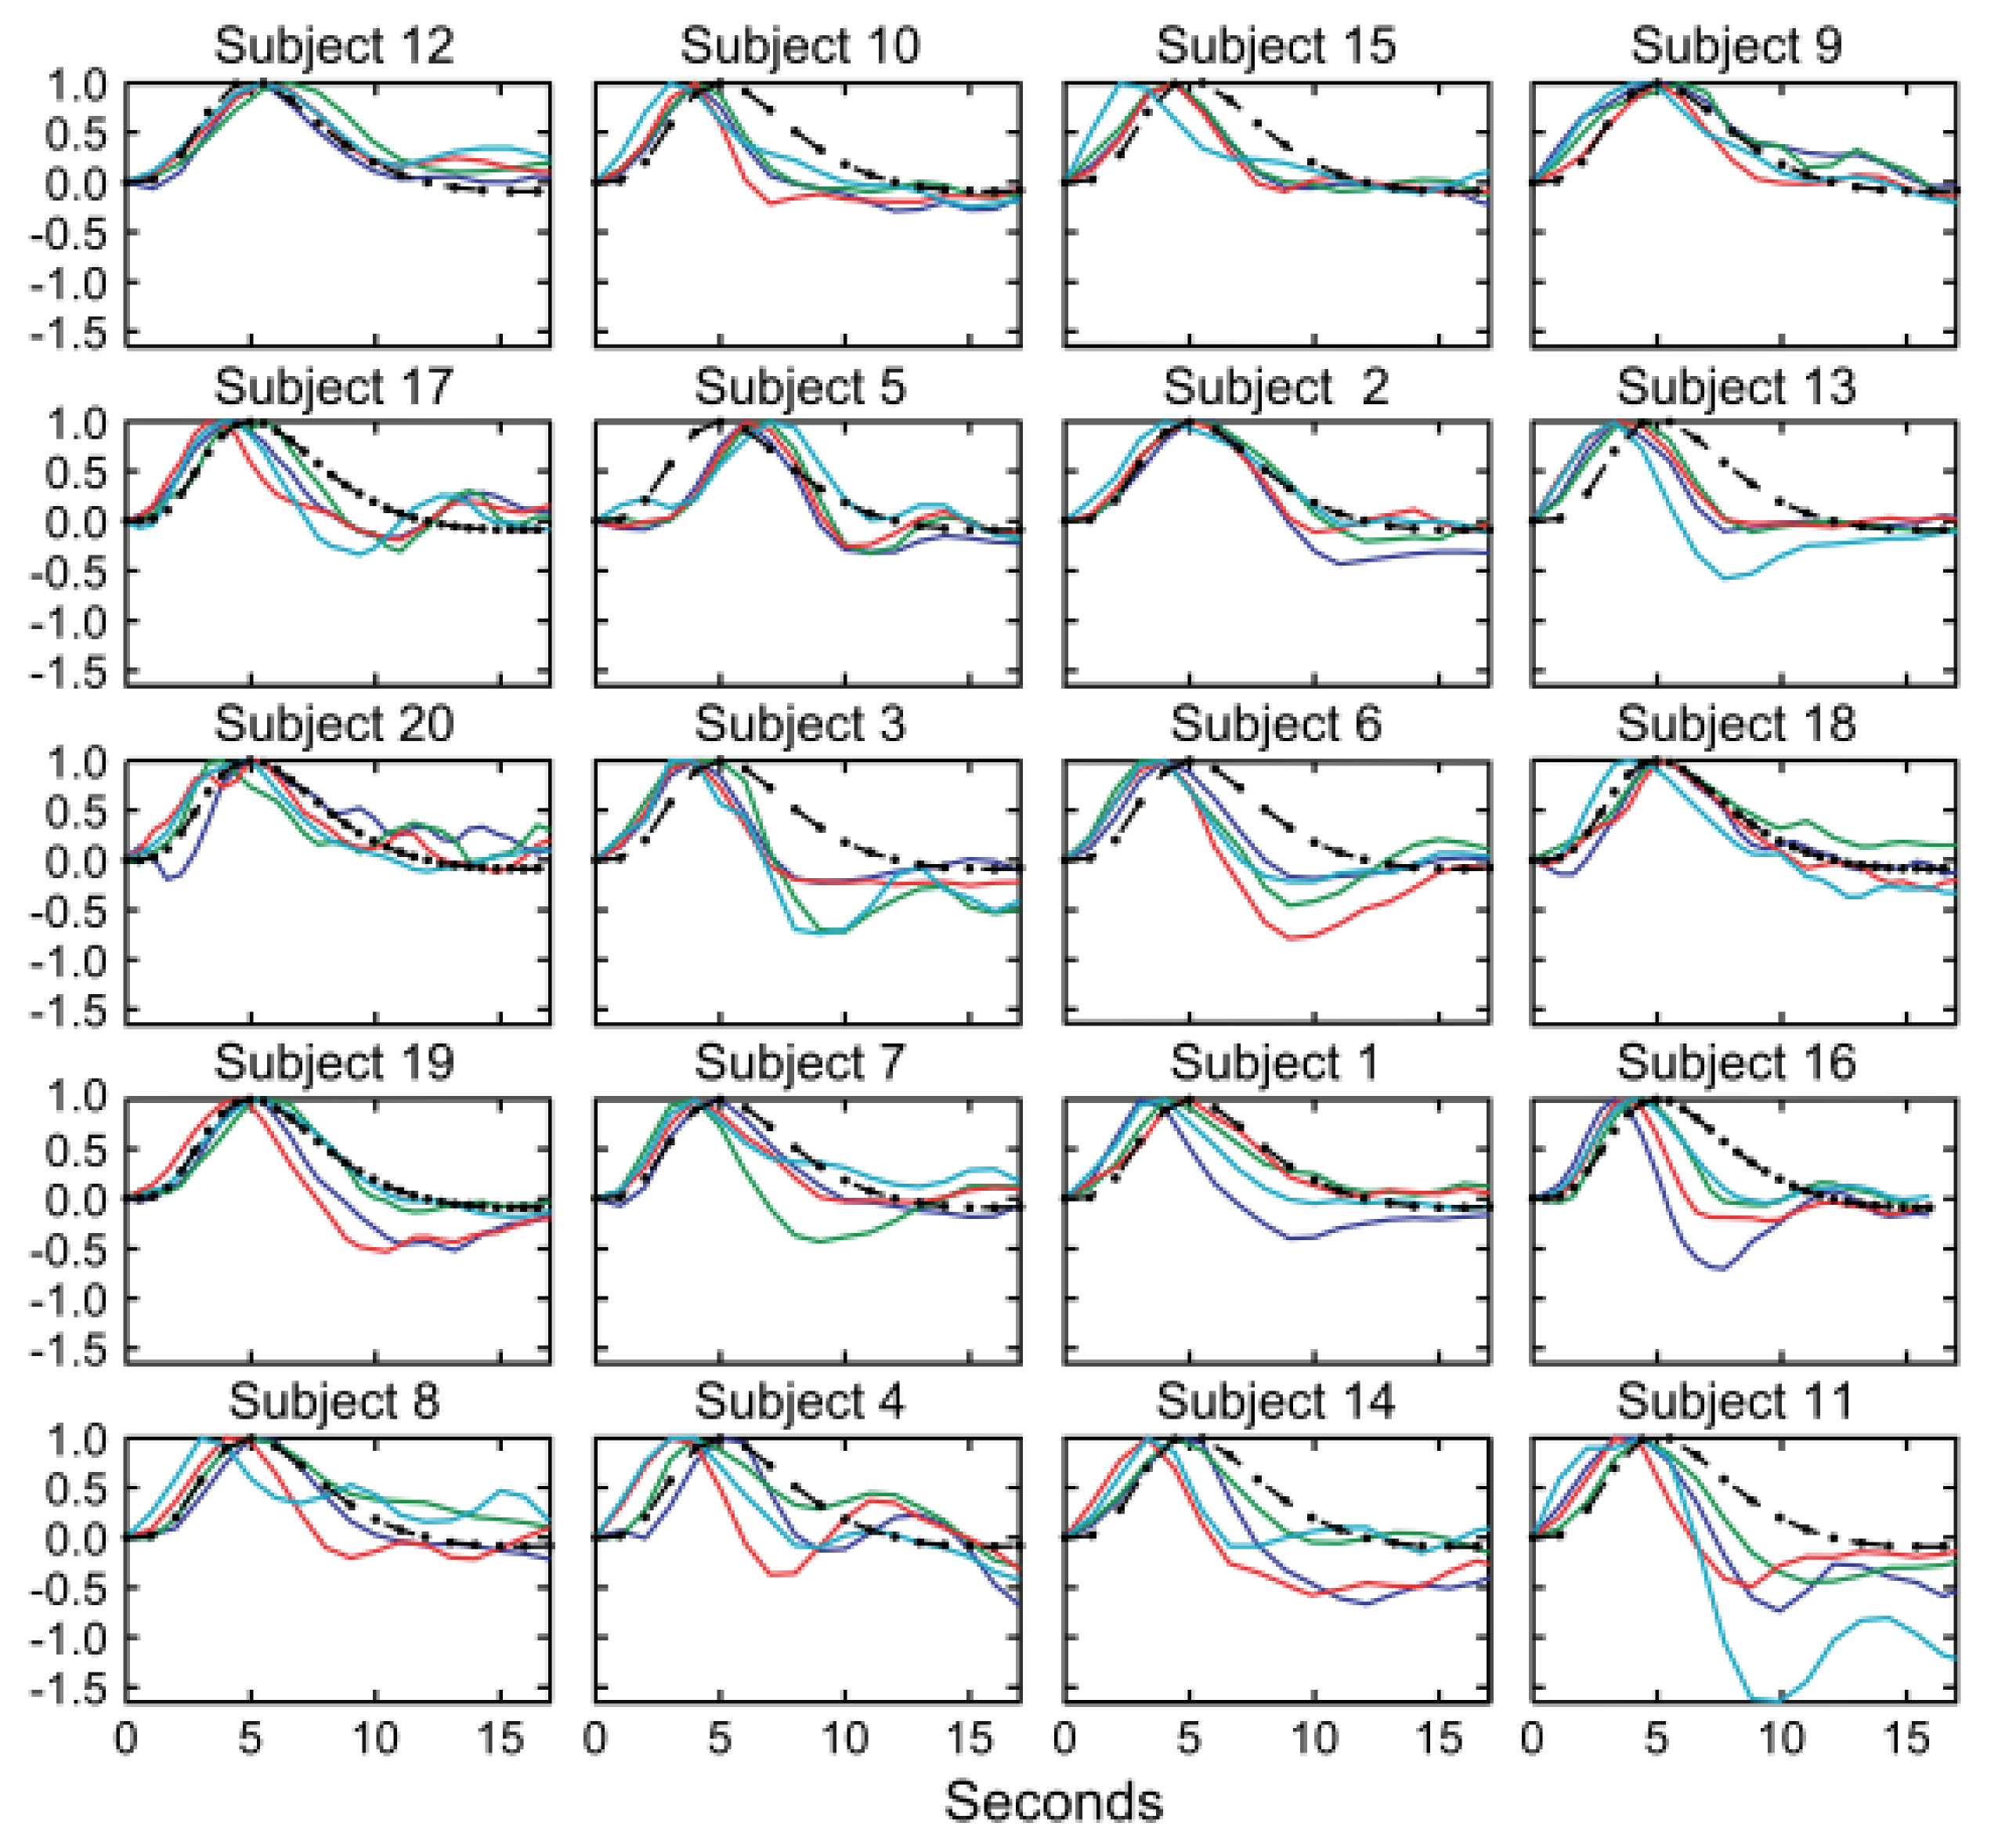
(e.g., post-stimulus undershoot).8-10 The latency and other temporal features of the neurovascular coupling
response are known to vary across the cortex, and the response amplitude can be
non-linear.11,12Interpreting changes in BOLD contrast
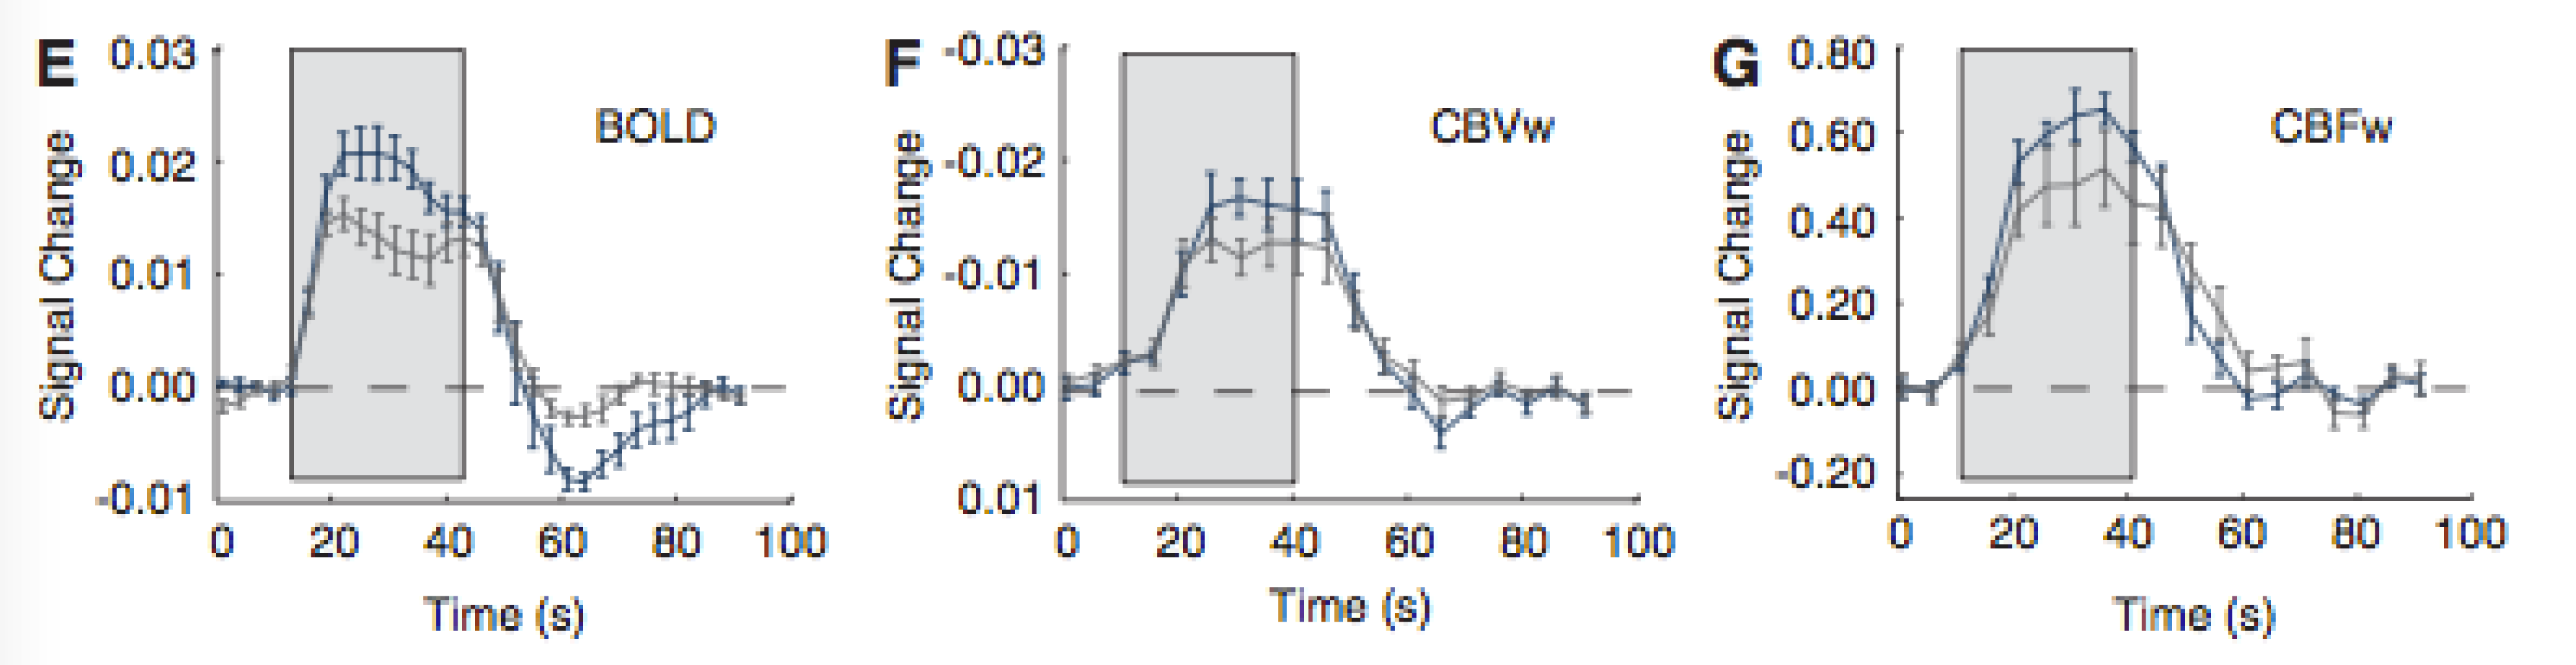
As described above, there are numerous physiological scenarios that can result in positive (or negative) signal changes in BOLD-weighted data. Non-neural changes in blood flow and volume related to arterial blood gas tensions (carbon dioxide is a potent vasodilator that fluctuates with respiration) can confound fMRI scans13,14, as can low frequency vasomotive or autoregulatory fluctuations in vascular tone.15 The complex processes involved in neurovascular coupling can vary across the brain, change with age, and become dysfunctional in disease.16-18 Pharmacological agents such as medications or anesthetics can impact baseline physiology as well as coupling mechanisms.19
Despite this inherent ambiguity, BOLD contrast fMRI has proven to be immensely powerful and popular for mapping and characterising brain activation. It is therefore important to consider the physiological changes in the cohorts being scanned, and to ascertain whether neural or vascular factors are driving any observed difference in BOLD activations. Calibrated BOLD20 and qBOLD21 techniques attempt to quantify oxygen metabolism, a more direct estimate of neural activity. Monitoring of physiology or administering hypercapnia challenges can test for and potentially account for vascular impairment.22 Additional MR contrast mechanisms (ASL, VASO, MRS) and complementary imaging modalities (EEG, MEG, NIRS) can be combined with BOLD fMRI data to gain improved insight into the true neuro-vascular processes taking place in the human brain.
Acknowledgements
Dr. Bright is funded through the Anne McLaren Fellowship programme.References
1. Yablonskiy, D. A. & Haacke, E. M. Theory of NMR signal behavior in magnetically inhomogeneous tissues: the static dephasing regime. Magn. Reson. Med. 32, 749–763 (1994).
2. Ogawa, S., Lee, T. M., Kay, A. R. & Tank, D. W. Brain magnetic resonance imaging with contrast dependent on blood oxygenation. Proceedings of the National Academy of Sciences 87, 9868–9872 (1990).
3. Boxerman, J. L., Hamberg, L. M., Rosen, B. R. & Weisskoff, R. M. MR contrast due to intravascular magnetic susceptibility perturbations. Magn. Reson. Med. 34, 555–566 (1995).
4. Buxton, R. B., Wong, E. C. & Frank, L. R. Dynamics of blood flow and oxygenation changes during brain activation: the balloon model. Magn. Reson. Med. 39, 855–864 (1998).
5. Lecrux, C. & Hamel, E. The neurovascular unit in brain function and disease. Acta Physiologica 203, 47–59 (2011).
6. Venkat, P., Chopp, M. & Chen, J. New insights into coupling and uncoupling of cerebral blood flow and metabolism in the brain. Croat Med J 57, 223–228 (2016).
7. Huneau, C., Benali, H. & Chabriat, H. Investigating Human Neurovascular Coupling Using Functional Neuroimaging: A Critical Review of Dynamic Models. Front Neurosci 9, e1002435 (2015).
8. Donahue, M. J. et al. Cerebral blood flow, blood volume, and oxygen metabolism dynamics in human visual and motor cortex as measured by whole-brain multi-modal magnetic resonance imaging. Journal of Cerebral Blood Flow & Metabolism 1–11 (2009). doi:10.1038/jcbfm.2009.107
9. Chen, J. J. & Pike, G. B. Origins of the BOLD post-stimulus undershoot. NeuroImage 46, 559–568 (2009).
10. Simon, A. B. & Buxton, R. B. Understanding the dynamic relationship between cerebral blood flow and the BOLD signal: Implications for quantitative functional MRI. NeuroImage 116, 158–167 (2015).
11. de Zwart, J. A. et al. Hemodynamic nonlinearities affect BOLD fMRI response timing and amplitude. NeuroImage 47, 1649–1658 (2009).
12. de Zwart, J. A. et al. Temporal dynamics of the BOLD fMRI impulse response. NeuroImage 24, 667–677 (2005).
13. Abbott, D. F., Opdam, H. I., Briellmann, R. S. & Jackson, G. D. Brief breath holding may confound functional magnetic resonance imaging studies. Hum. Brain Mapp. 24, 284–290 (2005).
14. Birn, R. M., Murphy, K., Handwerker, D. A. & Bandettini, P. A. fMRI in the presence of task-correlated breathing variations. NeuroImage 47, 1092–1104 (2009).
15. Murphy, K., Birn, R. M. & Bandettini, P. A. Resting-state fMRI confounds and cleanup. NeuroImage 80, 349–359 (2013).
16. Devonshire, I. M. et al. Neurovascular coupling is brain region-dependent. NeuroImage 59, 1997–2006 (2012).
17. Kisler, K. et al. Pericyte degeneration leads to neurovascular uncoupling and limits oxygen supply to brain. Nat. Neurosci. (2017). doi:10.1038/nn.4489
18. Schmithorst, V. J., Vannest, J. & Lee, G. Evidence that neurovascular coupling underlying the BOLD effect increases with age during childhood. Human brain … (2015).
19. Masamoto, K. & Kanno, I. Anesthesia and the quantitative evaluation of neurovascular coupling. J Cereb Blood Flow Metab 32, 1233–1247 (2012).
20. Merola, A. et al. Measurement of oxygen extraction fraction (OEF): An optimized BOLD signal model for use with hypercapnic and hyperoxic calibration. NeuroImage 129, 159–174 (2016).
21. He, X. & Yablonskiy, D. A. Quantitative BOLD: Mapping of human cerebral deoxygenated blood volume and oxygen extraction fraction: Default state. Magn. Reson. Med. 57, 115–126 (2006).
22. Geranmayeh, F., Wise, R. J. S., Leech, R. & Murphy, K. Measuring vascular reactivity with breath-holds after stroke: a method to aid interpretation of group-level BOLD signal changes in longitudinal fMRI studies. Hum. Brain Mapp. 36, 1755–1771 (2015).
23. Casiday R and Frey R. Hemoglobin and the Heme Group:
Metal Complexes in the Blood for Oxygen
Transport. http://www.chemistry.wustl.edu/~edudev/LabTutorials/Hemoglobin/MetalComplexinBlood.html
24. Handwerker, D. A., Ollinger, J. M. & D'Esposito, M. Variation of BOLD hemodynamic responses across subjects and brain regions and their effects on statistical analyses. NeuroImage 21, 1639–1651 (2004).
Figures