Atlas-Based Analysis for Neuroimaging Informatics
Synopsis
Neuroimaging by MRI is one of the most active areas of research, producing a large body of descriptive results. In the conventional research model, the morphological heterogeneity of a given group is often reduced to the mean, diluting some of the individual variability. We will discuss how quantitative structure-based analysis can reduce images to a standardized and quantitative vector (or matrix) that captures features appropriately without erasing the individual variability. We will illustrate dimension reduction and integration of T1-WI, DTI, resting state fMRI, and other contrasts through multi-atlas segmentation in research and personalized medicine
The big dimensions of neuroimaging “Big Data”
Neuroimaging by MRI has been one of the most active areas of the psychiatric research, producing a large body of descriptive results, usually focused on a small number of pre-defined anatomical structures or hypothesis-generating voxel-based analysis. In the “conventional research model”, the population is homogenized by inclusion and exclusion criteria, and in general, differences in means are reported. This contraction of personal information dilutes the intrinsic group variability and, although these studies have been a great source for studying the physiopathology of multiple diseases, they, in general, fail to identify single strong discriminating factors that quantitatively represent the underlying pathology and have not been adopted in routine clinical practices. Using multiple observables – one being neuroimaging - would increase the discriminating power. However, increasing features leads to increasing noise (the “Big Data” problem) and, again, the information has to be contracted at certain level. Here, we discuss a possible strategy for reducing the neuroimaging information to a standardized and quantitative “feature” vector (or matrix) that captures features appropriate for the disease without erasing the individual variability.Structural Atlas-based Analysis
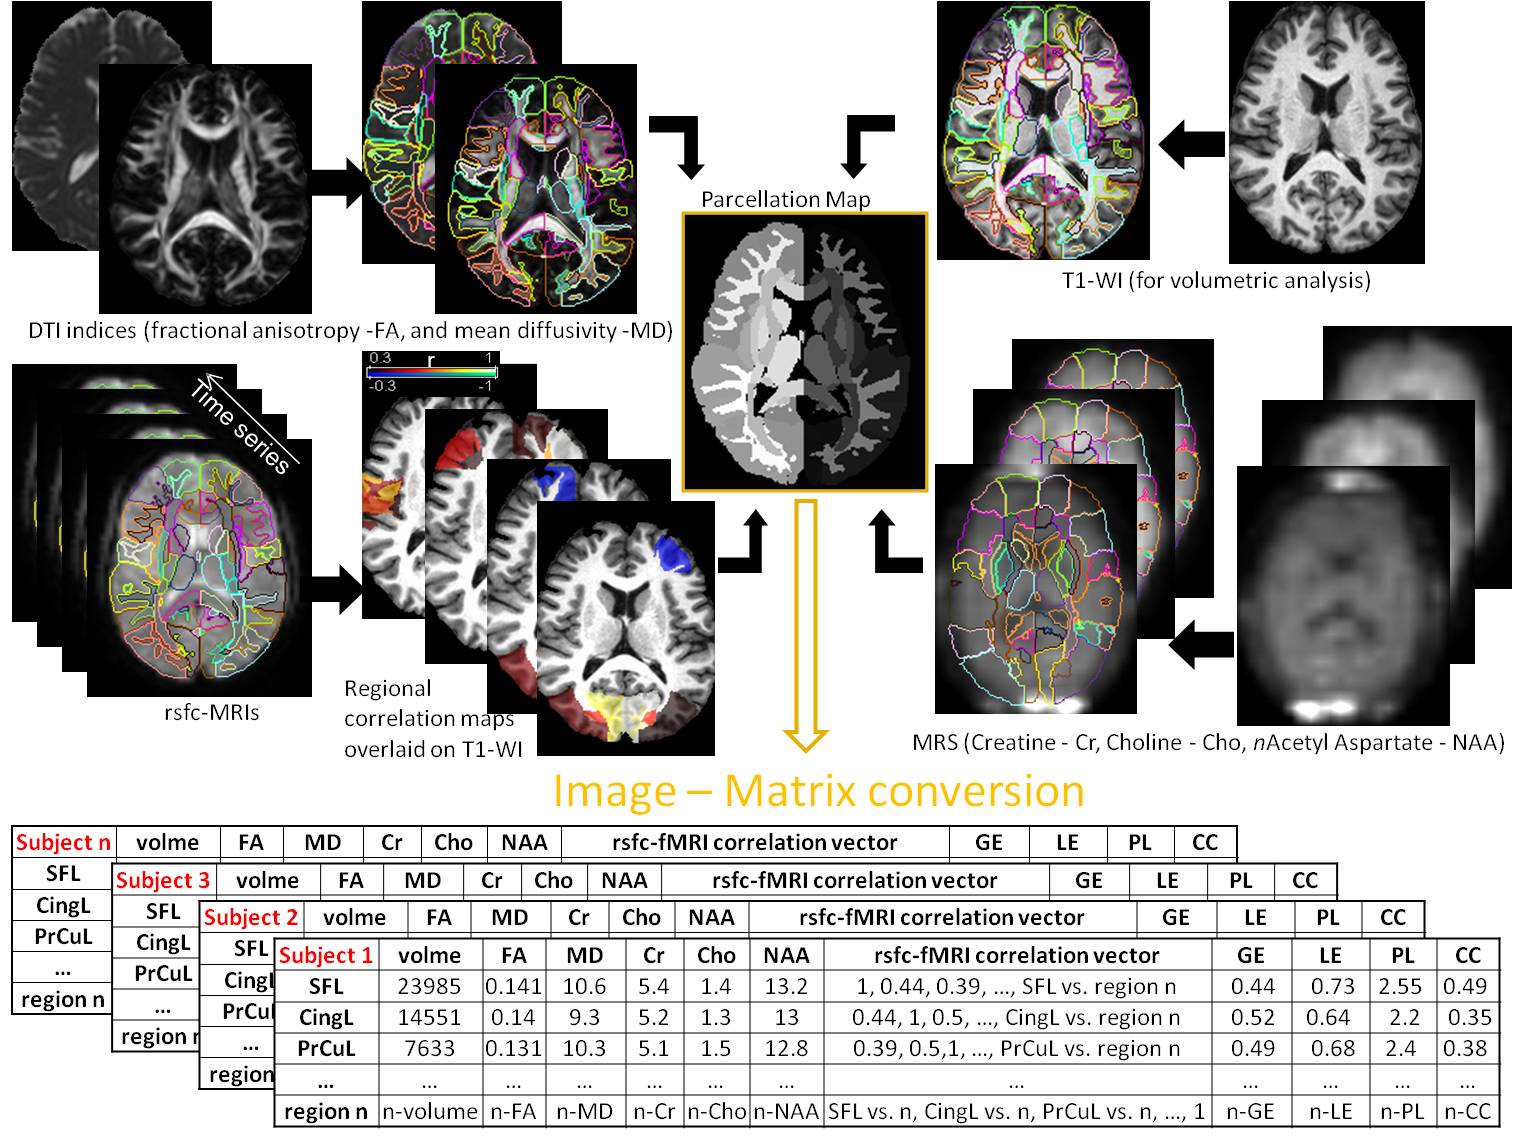
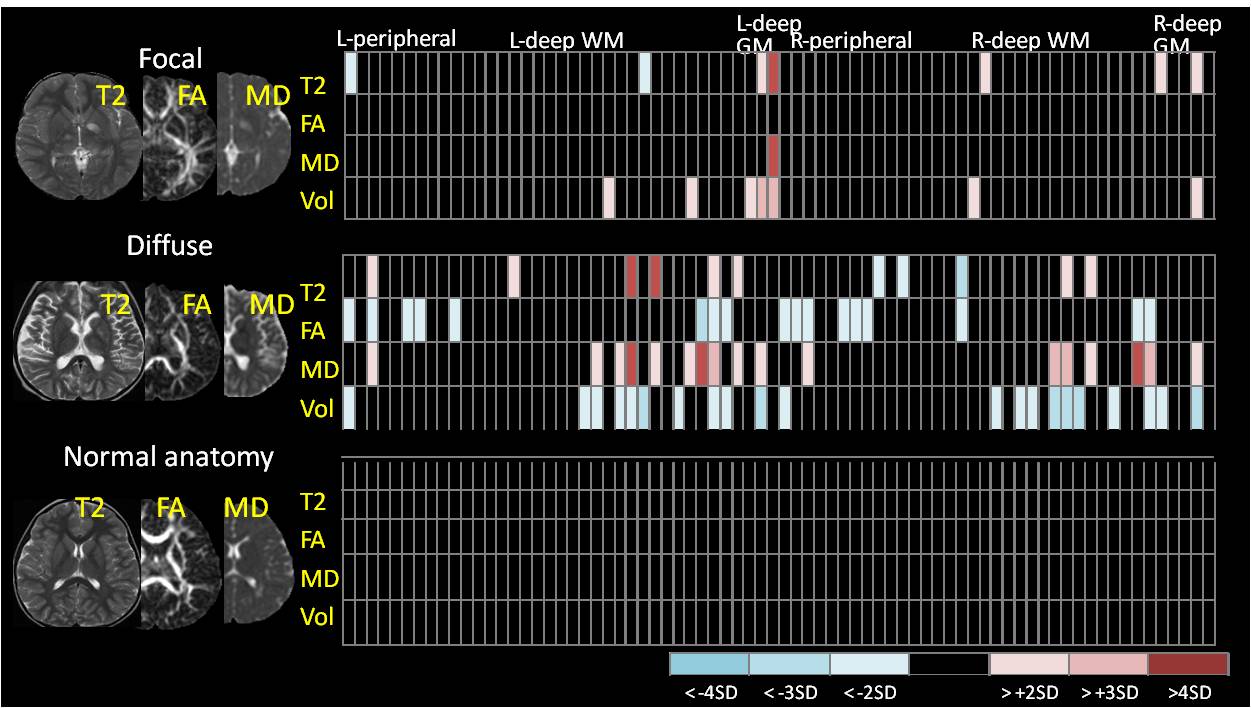
The proposed strategy consists on analyzing each patient, a premise of “personalized medicine”, under a universal system of labels that are understandable and biological relevant. In the “atlas-based” approach each brain is mapped to one or multiple templates and the labels defined in this template can be back transferred to each individual. The atlas-based analysis enables to unify the multi-modal imaging quantification; each individual is then characterized by a matrix of regions by imaging features that carries complementary information in different image domains (Fig. 1). In analogy to the Gaussian filters used in voxel-based analysis, the set of labels represent biological filters, that can be defined based on multiple criteria: classical anatomy, functional units, cytoarchitecture, vascular territory, etc. The choice of labels depends on the model and questions being investigated. Another important component, that conveys practical relevance to the method, is the link to big databases, so the numbers extracted from the imaging analysis can be interpreted in the light of previous knowledge about normal and abnormal patterns, therefore simulating the human reasoning of radiological interpretation. Ultimately, the image information can be reduced to a type of “bar code” (Fig 2), condensed and still singular.Applications
We will discuss different methods for atlas-based quantification and how they can impact both research and clinical scenarios. We will illustrate some applications on anatomo-functional correlations, multimodal analysis, outcome prediction, pattern recognition, and automated classification. We will also discuss future perspectives in translational medicine, for aiding diagnosis and guiding radiological interpretation, and for imaging search and information retrieval.Acknowledgements
To the following PIs and their group members, at the Johns Hopkins University: Susumu Mori, Michael I. Miller, Argye Hillis, Peter vanZijl, James Pekar, Peter Barker
To the grant support of NIH-NIBIB R03 EB014357 and AHA 12SDG12080169
References
Allen Institute for Brain Science (2009). Allen Human Brain Atlas. Available online at: http://human.brain-map.org/mri_viewers/data.
Dickie, D. A., Job, D. E., Rodriguez, D., Robson, A., Danso, S., Pernet, C., et al. (2016a). Brain Imaging of Normal Subjects (BRAINS) Age-Specific MRI Atlases from Young Adults to the Very Elderly (v1.0), [dataset]. University of Edinburgh, Edinburgh Imaging, CCBS, BRAINS Imagebank.
Djamanakova A, Faria AV, Hsu J, Ceritoglu C, Oishi K, Miller MI, Hillis AE, Mori S. Diffeomorphic brain mapping based on T1-weighted images: improvement of registration accuracy by multichannel mapping. J Magn Reson Imaging. 2013 Jan;37(1):76-84.
Djamanakova A, Tang X, Li X, Faria AV, Ceritoglu C, Oishi K, Hillis AE, Albert M, Lyketsos C, Miller MI, Mori S. Tools for multiple granularity analysis of brain MRI data for individualized image analysis. Neuroimage. 2014 Nov 1;101:168-76.
Faria AV, Joel SE, Zhang Y, Oishi K, van Zjil PC, Miller MI, Pekar JJ, Mori S. Atlas-based analysis of resting-state functional connectivity: evaluation for reproducibility and multi-modal anatomy-function correlation studies. Neuroimage. 2012 Jul 2;61(3):613-21.
Faria AV, Landau B, O'Hearn KM, Li X, Jiang H, Oishi K, Zhang J, Mori S. Quantitative analysis of gray and white matter in Williams syndrome. Neuroreport. 2012 Mar 28;23(5):283-9.
Faria AV, Oishi K, Yoshida S, Hillis A, Miller MI, Mori S. Content-based image retrieval for brain MRI: an image-searching engine and population-based analysis to utilize past clinical data for future diagnosis. Neuroimage Clin. 2015 Jan 15;7:367-76.
Faria AV, Ratnanather JT, Tward DJ, Lee DS, van den Noort F, Wu D, Brown T, Johnson H, Paulsen JS, Ross CA, Younes L, Miller MI; PREDICT-HD Investigators and Coordinators of the Huntington Study Group. Linking white matter and deep gray matter alterations in premanifest Huntington disease. Neuroimage Clin. 2016 Feb 26;11:450-60.
Faria AV, Sebastian R, Newhart M, Mori S, Hillis AE. Longitudinal Imaging and Deterioration in Word Comprehension in Primary Progressive Aphasia: Potential Clinical Significance. Aphasiology. 2014 Aug;28(8-9):948-963.
Faria AV, Zhang J, Oishi K, Li X, Jiang H, Akhter K, Hermoye L, Lee SK, Hoon A, Stashinko E, Miller MI, van Zijl PC, Mori S. Atlas-based analysis of neurodevelopment from infancy to adulthood using diffusion tensor imaging and applications for automated abnormality detection. Neuroimage. 2010 Aug 15;52(2):415-28.
Glasser, M. F., Coalson, T. S., Robinson, E. C., Hacker, C. D., Harwell, J., Yacoub, E., et al. (2016). A multi-modal parcellation of human cerebral cortex. Nature 536, 171–178.
Gousias, I. S., Edwards, A. D., Rutherford, M. A., Counsell, S. J., Hajnal, J. V., Rueckert, D., et al. (2012). Magnetic resonance imaging of the newborn brain: manual segmentation of labelled atlases in term-born and preterm infants. Neuroimage 62, 1499–1509.
Liang Z, He X, Ceritoglu C, Tang X, Li Y, Kutten KS, Oishi K, Miller MI, Mori S, Faria AV. Evaluation of Cross-Protocol Stability of a Fully Automated Brain Multi-Atlas Parcellation Tool. PLoS One. 2015 Jul 24;10(7):e0133533.
Luders, E., Narr, K. L., Thompson, P. M., Woods, R. P., Rex, D. E., Jancke, L., et al. (2005). Mapping cortical gray matter in the young adult brain: effects of gender. Neuroimage 26, 493–501. doi: 10.1016/j.neuroimage.2005.02.010
Miller MI, Faria AV, Oishi K, Mori S. High-throughput neuro-imaging informatics. Front Neuroinform. 2013 Dec 17;7:31.
Mori S, Oishi K, Faria AV. White matter atlases based on diffusion tensor imaging. Curr Opin Neurol. 2009 Aug;22(4):362-9
Mori S, Oishi K, Faria AV, Miller MI. Atlas-based neuroinformatics via MRI: harnessing information from past clinical cases and quantitative image analysis for patient care. Annu Rev Biomed Eng. 2013;15:71-92.
Oishi K, Faria AV, Yoshida S, Chang L, Mori S. Quantitative evaluation of brain development using anatomical MRI and diffusion tensor imaging. Int J Dev Neurosci. 2013 Nov;31(7):512-24.
Race DS, Tsapkini K, Crinion J, Newhart M, Davis C, Gomez Y, Hillis AE, Faria AV. An area essential for linking word meanings to word forms: evidence from primary progressive aphasia. Brain Lang. 2013 Nov;127(2):167-76.
Talairach, J., and Tournoux, P. (1988). Co-planar Sterotactic Atlas of the Human Brain: 3-dimensional Proportional System: An Approach to Cerebral Imaging. Stuttgart: Georg Thieme Verlag.
Tang X, Oishi K, Faria AV, Hillis AE, Albert MS, Mori S, Miller MI. Bayesian Parameter Estimation and Segmentation in the Multi-Atlas Random Orbit Model. PLoS One. 2013 Jun 18;8(6):e65591.
Tang X, Yoshida S, Hsu J, Huisman TA, Faria AV, Oishi K, Kutten K, Poretti A, Li Y, Miller MI, Mori S. Multi-contrast multi-atlas parcellation of diffusion tensor imaging of the human brain. PLoS One. 2014 May 8;9(5):e96985.
Toga, A. W., Thompson, P. M., Mori, S., Amunts, K., and Zilles, K. (2006). Towards multimodal atlases of the human brain. Nat. Rev. Neurosci. 7, 952–966.
Van Essen, D. C., Ugurbil, K., Auerbach, E., Barch, D., Behrens, T. E. J., Bucholz, R., et al. (2012). The Human Connectome Project: a data acquisition perspective. Neuroimage 62, 2222–2231 Evans, A. C., Janke, A. L., Collins, D. L., and Baillet, S. (2012). Brain templates and atlases. Neuroimage 62, 911–922
Wu D, Ma T, Ceritoglu C, Li Y, Chotiyanonta J, Hou Z, Hsu J, Xu X, Brown T, Miller MI, Mori S. Resource atlases for multi-atlas brain segmentations with multiple ontology levels based on T1-weighted MRI. Neuroimage. 2016 Jan 15;125:120-30.
Zhang Y, Zhang J, Oishi K, Faria AV, Jiang H, Li X, Akhter K, Rosa-Neto P, Pike GB, Evans A, Toga AW, Woods R, Mazziotta JC, Miller MI, van Zijl PC, Mori S. Atlas-guided tract reconstruction for automated and comprehensive examination of the white matter anatomy. Neuroimage. 2010 Oct 1;52(4):1289-301
Figures