Magnetization Transfer: Applications in MSK imaging
1Medical Physics Unit, McGill University, Montreal, QC, Canada
Synopsis
Magnetization transfer (MT) is a distinct endogenous mechanism that impacts MR signal and image contrast. MT is sensitive to the MRI-invisible component of biological tissue. In this presentation, we will review the physics, measurement techniques, and selected research findings from MT-MRI in the musculoskeletal system, in particular with relevance to collagen-rich tissues.
Target Audience
Scientists, medical professionals, and research technologists who seek an understanding of contrast mechanisms and a review of research findings from magnetization transfer MRI in the musculoskeletal system.Learning Objectives
At the end of this presentation, the attendees will:
- Understand and describe the magnetization transfer effect and the two-pool model of magnetization transfer
- Describe various methods for magnetization transfer imaging
- Understand how the magnetization transfer effect is linked to musculoskeletal tissue composition and structure, especially in cartilage and meniscus
- List examples of past and current research results in musculoskeletal imaging
Introduction
Magnetic resonance imaging is largely based on the observation of the magnetization of hydrogen nuclei attached to water molecules. Differences in water hydrogen proton density and relaxation times are the main determinants of MRI signal and contrast. Other effects, such as flow, diffusion, and the presence of lipids, can impact image appearance. Water molecules in human tissue are characterized by relatively free tumbling motion that results in the familiar, moderately long T1 and T2 values.
On the other hand, the entire micro- and macrostructure of tissue is composed of a rich network of phospholipids, proteins, and other molecules arranged in a semi-rigid structure (1,2). Hydrogen protons attached to molecules in these structures are said to be in a "restricted" or "semi-solid" state. This proton pool is typically characterized by moderate to long T1, and very short T2 (on the order of microseconds) (3). Therefore, these restricted protons are invisible to most MR imaging methods.
Magnetization transfer (MT) describes the phenomenon by which the net magnetization of the observable water hydrogen protons (the "free" pool) is exchanged with that of the pool of restricted hydrogen protons (4). This effect can be exploited to produce a distinct form of contrast (MT contrast, or MTC) (5), to yield effective background suppression (e.g. in MR angiography) (6), or to measure quantitative parameters that describe the free and restricted pool. We will review the physics of MT, the imaging methods, and selected applications in musculoskeletal (MSK) MRI, building on prior reviews (7).
Magnetization Transfer Physics
The macromolecular hydrogen protons of the restricted pool are characterized by very fast decay of transverse magnetization (T2~microseconds), to the point where transverse magnetization is essentially negligible for most imaging (4,8). It is more appropriate to describe the restricted pool by its very wide NMR resonance, in contrast to the narrow resonance of water hydrogen protons. The restricted protons cannot be easily excited into a cohere state of magnetization and therefore are not observed directly by the vast majority of MRI methods.
MT is the combination of interaction effects between the free and restricted pools that can be distinguished from pure T1 effects. The distinction is essentially due to the timescale of the interaction, or exchange rate, which permits observation of the MT effect distinct from T1 relaxation (7-9). The underlying phenomena responsible for MT are thought to be dipolar interaction (mutual spin flips) and chemical exchange, and these are essentially indistinguishable in human MT-MRI. The MT effect is illustrated in Figure 1.
The presence of the invisible restricted pool is not to be neglected. The z-component of restricted pool magnetization is always present, and the effect of this component can be observed via the MT effect. In general, MT is always affecting the observable signal and is essentially a longitudinal relaxation mechanism, and for many pulse sequences it is not distinguished from T1 effects.
MRI can be intentionally sensitized to the MT effect. RF pulses have the effect of reducing (or saturating) the z-magnetization of the restricted pool from its equilibrium value, which then recovers via intrinsic T1 relaxation. It is also possible to selectively saturate the restricted pool through the application of appropriate on- or off-resonance radio-frequency B1 pulses (10-13). In saturation transfer experiments, the restricted pool is saturated, and this saturation is then transferred to the observable free pool via MT. This results in an overall signal decrease in the free pool.
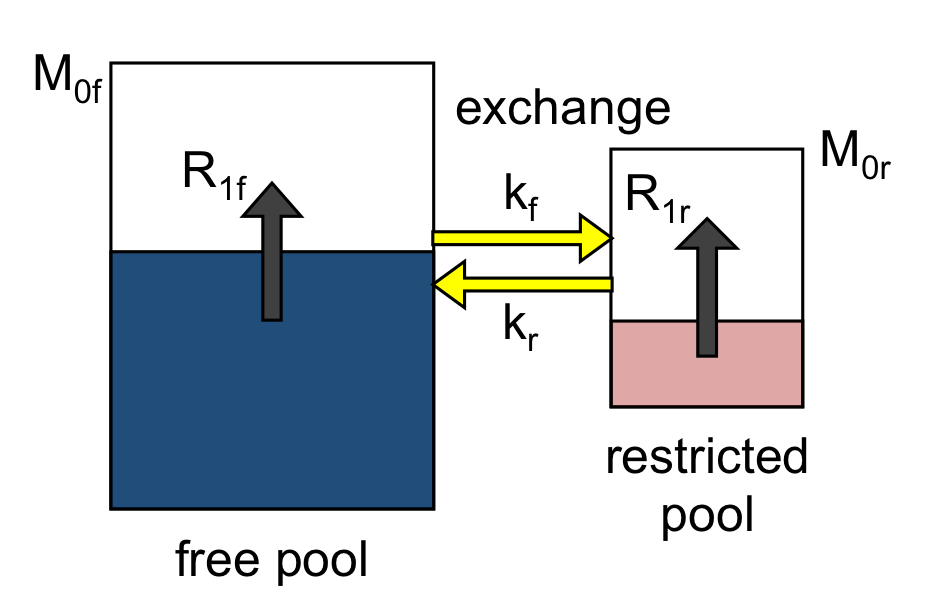
The MT effect is most easily modeled by a combination of reservoirs, or pools, of magnetization, as illustrated in Figure 2. The model depicts the z-magnetization of the free and restricted pools, along with T1 recovery and exchange constants. The model parameters are well described in the literature (but there is limited consensus on the notation). Modified Bloch equations coupled by exchange terms, also known as the Bloch-McConnell equations, can be used describe the behaviour of each pool (8).
Methods for Imaging and Mapping Magnetization Transfer
Magnetization transfer imaging can be achieved in a number of ways. All methods result in signal decreases due, and signal enhancement due to MT has yet to be demonstrated in MRI. The various approaches all exploit some aspect of difference between the restricted and free pools, such as off-resonance or relaxation properties.
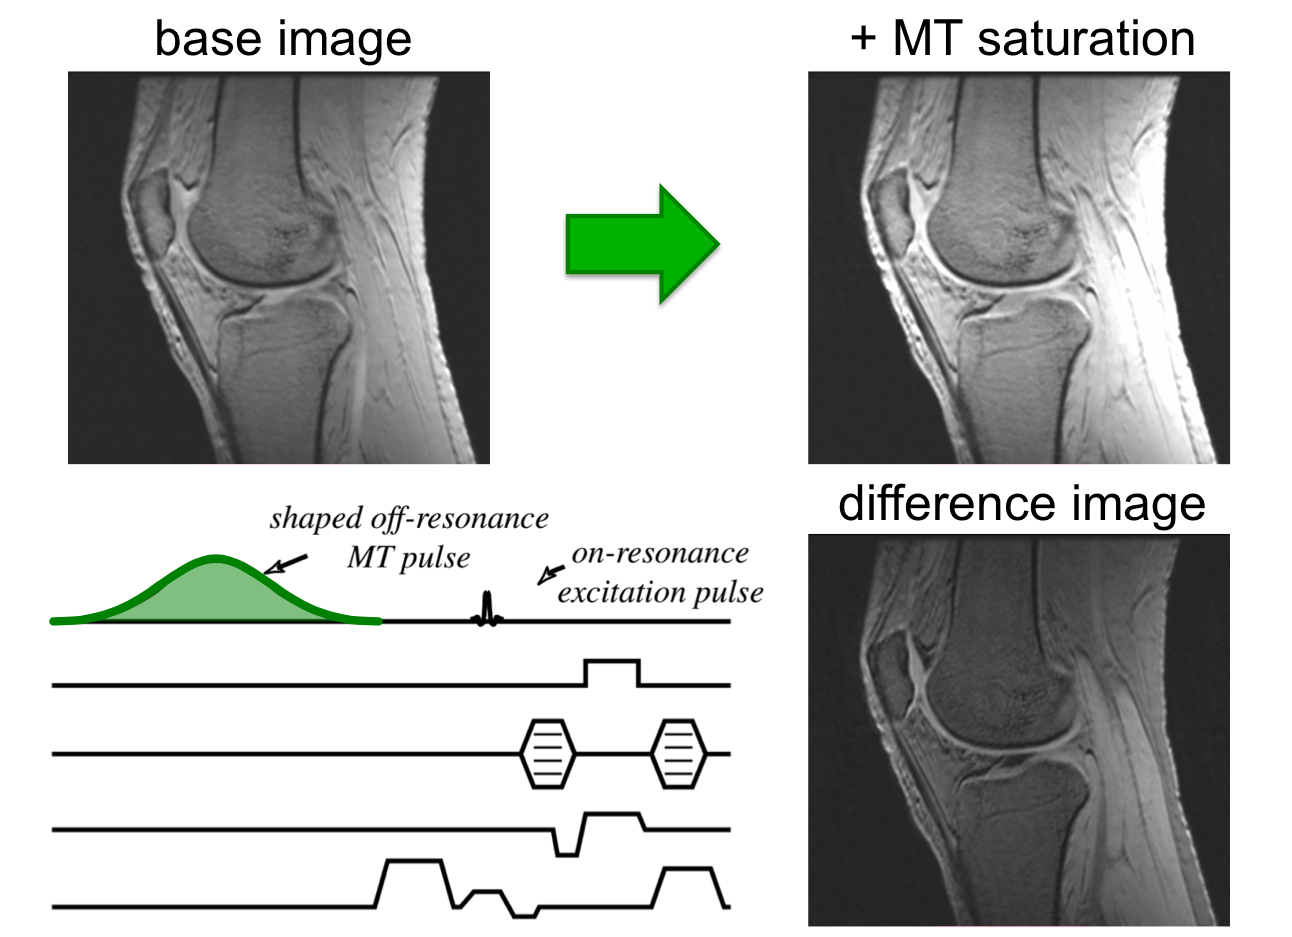
The most common approach is to add an off-resonance RF pulse to an appropriate imaging sequence (Fig. 4), modifying the signal and making the image sensitive to the presence of MT (10). This is usually a shaped off-resonance pulse with a relatively long duration and high amplitude, to produce enough saturation. Such pulses need to be repeated (usually at every TR) to maintain any MT effect in the signal. The base imaging sequence can be a spin or gradient echo. It can take a considerable amount of power to completely saturate the restricted pool, and this is ultimately limited by RF energy deposition (or SAR). It is nonetheless possible to obtain important signal changes by using saturation transfer.
Other approaches to introduce MT contrast include: on-resonance binomial composite pulses that result in zero net rotation of the free pool (14); modulation of the RF excitation pulse in balanced steady-state free precession (bSSFP) (15,16), and selective inversion recovery (17,18). In the case of binomial pulses, the RF acts to saturate the restricted pool partially while leaving the free pool relatively untouched. Appropriately-designed inversion pulses can invert the free pool while leaving the semi-solid pool untouched. The fast, selective excitation pulses in bSSFP can produce significant saturation of the restricted pool.
In all cases described above, the MT contrast image that results is rarely used on its own. It is most often compared to the baseline image (with no MT contrast). The most common metric is the MT ratio, or MTR, a relative difference image where high MTR means large MT effect. The MTR combines the entire MT effect into a single index.
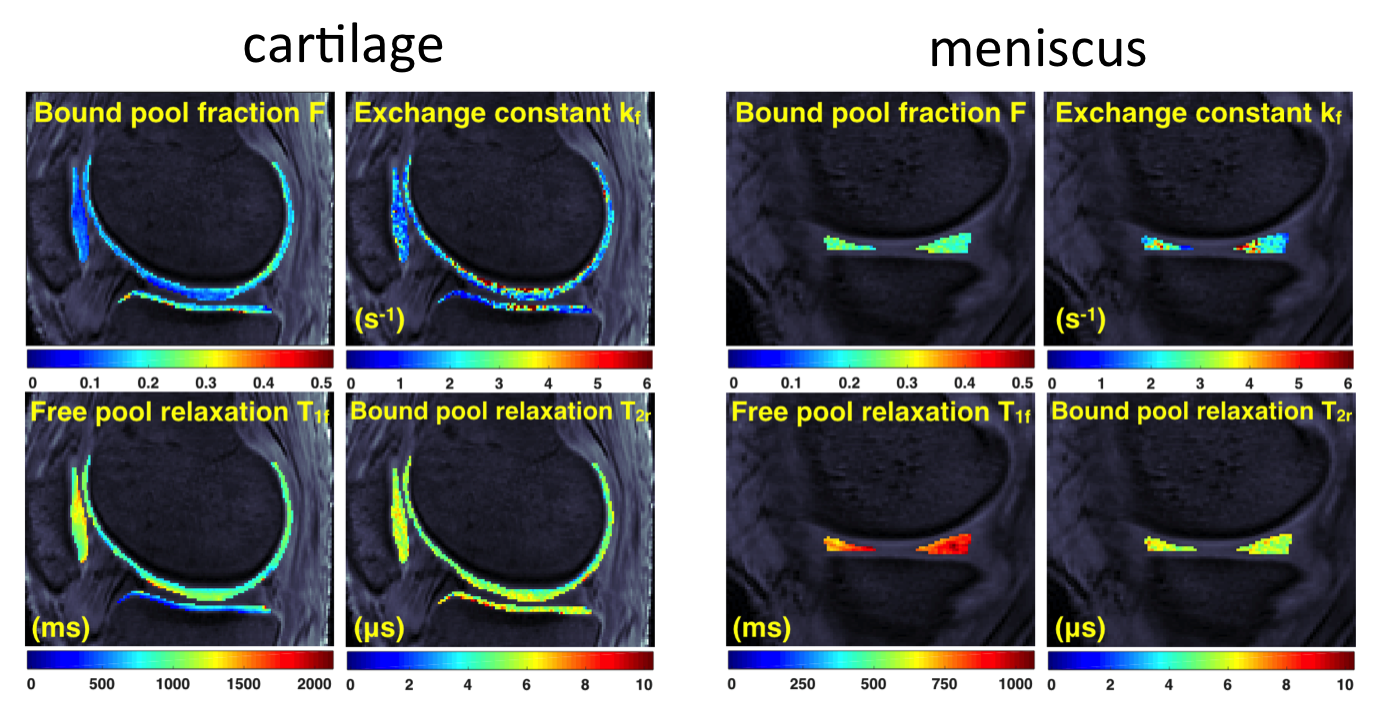
The logical extension of MT-weighted imaging is to quantify a set of parameters that describe the two-pool model seen in Fig. 3 (8,19-26). The usual quantities include the relative size of the restricted pool, the exchange rate, and the relaxation rates of each pool. A variety of methods have been proposed and are collectively known as quantitative magnetization transfer (QMT) imaging or cross-relaxation imaging. Variations of QMT exist with each of the aforementioned MT contrast approaches, and all have their strengths and weaknesses.
Applications in Musculoskeletal Imaging
The main application of MT imaging (and related quantitative methods) has been in brain imaging. The interpretation of the MT effect in brain tissue has been closely linked to the presence of myelin in brain white matter (27). White matter is a lipid- and protein-rich structure produced by glial cells that envelops and supports axons. White matter can be affected by a number of diseases, notably in multiple sclerosis, where there is much interest in MT-MRI. The MT effect, however, is not limited to brain white matter or myelin and can be observed in other tissues including muscle and cartilage.
MT-MRI has been present in MSK imaging essentially since the discovery of the effect (28). Some of the earliest work studied knee imaging and collagen content in tissue with MT. Prior work with MT-MRI has reported variable observations on the link between the MT effect and MSK tissue properties (1,29-32).
More recently, a few groups have used quantitative MT (QMT) to study cartilage composition and damage due to disease (33-36). This is largely to address perceived limitations of quantitative MRI methods to assess the ultra-structure of collagen, such as ambiguity in the interpretation of changes in T2 values. Collagen has been proposed as the major contributor to the MT effect in cartilage (29). A smaller contribution to the MT effect comes from proteoglycan concentration and tissue microstructure organization as evidenced in a study of pathological and physiological perturbations (1). Experimental NMR observations confirmed that the largest MT effect in cartilage is due to the collagen-water interaction, followed by proteoglycan-collagen (37). Notably, one group has used QMT in vivo and reported differences between patients with osteoarthritis and asymptomatic volunteers (35).
Summary
In closing, the MT effect has been presented as a distinct contrast mechanism from conventional T1 and T2 relaxation. The MT effect involves hydrogen protons located in restricted macromolecular components of tissue, and therefore offers an imaging window to these tissue components. MT imaging exploits the differences in off-resonance and/or relaxation behaviour of the restricted pool to sensitize MR imaging pulse sequences to the MT effect in a controlled manner. The use of MT is promising as a quantitative technique in the study of collagen-rich MSK tissues such as cartilage and meniscus.Acknowledgements
The author is grateful to Mikaël Simard, Emily McWalter, Bruce Pike, and John Sled for contributions to material in this presentation. Research funding from the Research Institute of the McGill University Health Centre and the Natural Science and Engineering Research Council of Canada (NSERC) is also acknowledged.References
- Gray ML, Burstein D, Lesperance LM, Gehrke L. Magnetization transfer in cartilage and its constituent macromolecules. Magn Reson Med 1995;34(3):319-325.
- Koenig SH, Brown RD, Spiller M, Lundbom N. Relaxometry of brain: why white matter appears bright in MRI. Magn Reson Med 1990;14:482-495.
- Koenig SH, Brown RD, 3rd. A molecular theory of relaxation and magnetization transfer: application to cross-linked BSA, a model for tissue. Magn Reson Med 1993;30(6):685-695.
- Wolff SD, Balaban RS. Magnetization transfer contrast (MTC) and tissue water proton relaxation in vivo. Magn Reson Med 1989;10:135-144.
- Wolff SD, Eng J, Balaban RS. Magnetization transfer contrast: method for improving contrast in gradient-recalled-echo images. Radiology 1991;179:133-137.
- Jones RA, Southon TE. Improving the contrast in rapid imaging sequences with pulsed magnetization transfer contrast. J Magn Reson 1992;97(1):171-176.
- Henkelman RM, Stanisz GJ, Graham SJ. Magnetization transfer in MRI: A review. NMR Biomed 2001;14:57-64.
- Henkelman RM, Huang X, Xiang QS, Stanisz GJ, Swanson SD, Bronskill MJ. Quantitative interpretation of magnetization transfer. Magn Reson Med 1993;29:759-766.
- Harrison R, Bronskill MJ, Henkelman RM. Magnetization transfer and T2 relaxation components in tissue. Magn Reson Med 1995;33:490-496.
- Graham SJ, Henkelman RM. Understanding pulsed magnetization transfer. J Magn Reson Imaging 1997;7:903-912.
- Graham SJ, Henkelman RM. Pulsed magnetization transfer imaging: evaluation of technique. Radiology 1999;212:903-910.
- Edzes HT, Samulski ED. Cross Relaxation and Spin Diffusion in the Proton NMR of Hydrated Collagen. Nature 1977;265:521-523.
- Forsen S, Hoffman RA. A New Method for Study of Moderately Rapid Chemical Exchange Rates Employing Nuclear Magnetic Double Resonance. Acta Chem Scand 1963;17(6):1787.
- Hu BS, Conolly SM, Wright GA, Nishimura DG, Macovski A. Pulsed saturation transfer contrast. Magn Reson Med 1992;26(2):231-240.
- Bieri O, Scheffler K. On the origin of apparent low tissue signals in balanced SSFP. Magn Reson Med 2006;56(5):1067-1074.
- Bieri O, Scheffler K. Optimized balanced steady-state free precession magnetization transfer Imaging. Magn Reson Med 2007;58(3):511-518.
- Gochberg DF, Kennan RP, Gore JC. Quantitative studies of magnetization transfer by selective excitation and T1 recovery. Magn Reson Med 1997;38(2):224-231.
- Edzes HT, Samulski ED. The measurement of cross-relaxation effects in the proton NMR spin-lattice relaxation of water in biological systems: hydrated collagen and muscle. J Magn Reson 1978;31(2):207-229.
- Sled JG, Pike GB. Quantitative imaging of magnetization transfer exchange and relaxation properties in vivo using MRI. Magn Reson Med 2001;46:923-931.
- Ramani A, Dalton C, Miller DH, Tofts PS, Barker GJ. Precise estimate of fundamental in-vivo MT parameters in human brain in clinically feasible times. Magn Reson Imaging 2002;20:721-731.
- Yarnykh VL. Pulsed Z-spectroscopic imaging of cross-relaxation parameters in tissues for human MRI: theory and clinical applications. Magn Reson Med 2002;47:929-939.
- Gochberg DF, Gore JC. Quantitative imaging of magnetization transfer using an inversion recovery sequence. Magn Reson Med 2003;49(3):495-500.
- Gochberg DF, Kennan RP, Robson MD, Gore JC. Quantitative imaging of magnetization transfer using multiple selective pulses. Magn Reson Med 1999;41:1065-1072.
- Gloor M, Scheffler K, Bieri O. Quantitative magnetization transfer imaging using balanced SSFP. Magn Reson Med 2008;60(3):691-700.
- Gloor M, Scheffler K, Bieri O. Nonbalanced SSFP-based quantitative magnetization transfer imaging. Magn Reson Med 2010;64(1):149-156.
- Sled JG, Pike GB. Quantitative interpretation of magnetization transfer in spoiled gradient echo MRI sequences. J Magn Reson 2000;145:24-36.
- Schmierer K, Tozer DJ, Scaravilli F, Altmann DR, Barker GJ, Tofts PS, Miller DH. Quantitative magnetization transfer imaging in postmortem multiple sclerosis brain. J Magn Reson Imaging 2007;26(1):41-51.
- Wolff SD, Chesnick S, Frank JA, Lim KO, Balaban RS. Magnetization transfer contrast: MR imaging of the knee. Radiology 1991;179(3):623-628.
- Kim DK, Ceckler TL, Hascall VC, Calabro A, Balaban RS. Analysis of water-macromolecule proton magnetization transfer in articular cartilage. Magn Reson Med 1993;29(2):211-215.
- Palmieri F, De Keyzer F, Maes F, Van Breuseghem I. Magnetization transfer analysis of cartilage repair tissue: a preliminary study. Skeletal Radiol 2006;35(12):903-908.
- Regatte RR, Akella SV, Reddy R. Depth-dependent proton magnetization transfer in articular cartilage. J Magn Reson Imaging 2005;22(2):318-323.
- Yao W, Qu N, Lu Z, Yang S. The application of T1 and T2 relaxation time and magnetization transfer ratios to the early diagnosis of patellar cartilage osteoarthritis. Skeletal Radiol 2009;38(11):1055-1062.
- Li W, Hong L, Hu L, Magin RL. Magnetization transfer imaging provides a quantitative measure of chondrogenic differentiation and tissue development. Tissue Eng Part C Methods 2010;16(6):1407-1415.
- Stikov N, Keenan KE, Pauly JM, Smith RL, Dougherty RF, Gold GE. Cross-relaxation imaging of human articular cartilage. Magn Reson Med 2011;66(3):725-734.
- Sritanyaratana N, Samsonov A, Mossahebi P, Wilson JJ, Block WF, Kijowski R. Cross-relaxation imaging of human patellar cartilage in vivo at 3.0T. Osteoarthritis Cartilage 2014;22(10):1568-1576.
- Simard M, McWalter EJ, Gold GE, Levesque IR. Quantitative magnetization transfer MRI of in-situ and ex-situ meniscus. 2016; Singapore. p 2266
- Lattanzio PJ, Marshall KW, Damyanovich AZ, Peemoeller H. Macromolecule and water magnetization exchange modeling in articular cartilage. Magn Reson Med 2000;44(6):840-851.
Figures

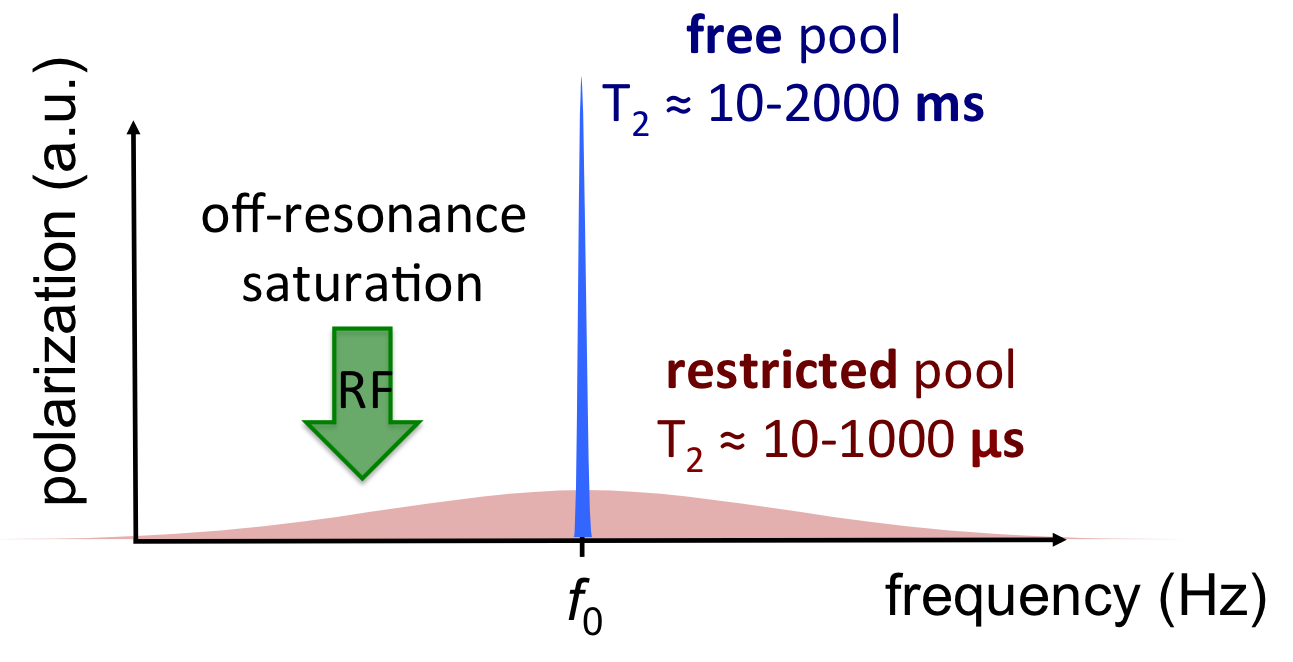
Figure 2. The saturation transfer effect exploits differences in off-resonance response of the free and restricted pools to produce selective saturation of the latter. The saturation of the restricted pool is transferred to the MR-visible water pool by MT.