Cardiac Mechanics
Daniel Auger
Synopsis
Cardiac MR strain imaging has been an active platform for the development of several non-invasive methods used to understand myocardial structure and function. Imaging myocardial strain is of growing importance in the assessment cardiovascular disease. Studies have shown myocardial strain is more predictive of future, adverse cardiac events than left-ventricular (LV) ejection fraction (EF) and studies have shown that MR strain imaging has the potential to demonstrate subclinical myocardial changes prior to the onset of myocardial dysfunction. This work reviews various strain imaging methods, the advantages, limitations and current clinical applications of these techniques.
Introduction
Cardiovascular
disease (CVD) remains a leading cause of death worldwide accounting for 33% or
1 in every 3 deaths in the United States since 2008 [1]. The American Heart Association plans to reduce deaths caused by
CVD by 20% and improve the cardiovascular health of all Americans. In order to
achieve these goals, the ability to diagnose, treat, and manage current
patients and individuals at risk must be improved. To date, our understanding
of cardiac function and pathology is still limited, and various techniques have
been developed for the effective diagnosis, treatment, and management of CVD.
MRI has
been an active platform for the development of several non-invasive methods
used to understand myocardial structure and function. Heart disease can affect
any region of the myocardium and the complex movement and contraction of the
heart; various CMR imaging techniques have been developed to provide
qualitative and quantitative analysis of contractile function. Technical
challenges for imaging myocardial strain include rapid data acquisition, rapid
image analysis, accuracy, and reproducibility.
Imaging
myocardial strain is of growing importance in the assessment of CVD. Echocardiographic
studies have shown myocardial strain is more predictive of future, adverse
cardiac events than left-ventricular (LV) ejection fraction (EF) for patients
with known or suspected LV impairment [2, 3]. Such findings and advancements in
echocardiography are influencing cardiac magnetic resonance (CMR) imaging where
interest in myocardial strain imaging is increasing.
Various
studies assessing myocardial strain have shown that MR strain imaging has the
potential to demonstrate subclinical myocardial changes prior to the onset of
myocardial dysfunction. Examples of such studies include impaired contractile function in
obese children [4] and systolic dysfunction in patients with Type 2 diabetes
Mellitus [5]. Furthermore, CMR has the potential to predict changes in LV
outcomes as shown by Mangion et al. in patients who have suffered acute
myocardial infarction [6] and by Auger et al. in heart failure (HF) patients
undergoing cardiac resynchronization therapy (CRT) [7].
Various
CMR strain imaging techniques are available
which include myocardial tagging, harmonic phase MRI (HARP), phase
contrast velocity encoding (PC-MR), and displacement encoding with stimulated
echoes (DENSE). Understanding the difference between the advantages and
limitations of each is important.Strain and strain imaging methods
Strain is
a geometrical measure of deformation representing the relative displacement
between particles in a material body; i.e. a measure of how much a given displacement
differs locally from a rigid-body displacement. The myocardial strain tensor is
described by three principal strains which can be assessed by the direction of deformation,
namely, radial thickening (Err), circumferential shortening (Ecc)
and longitudinal shortening (Ell). Figure 1(A) illustrates the 3-dimensional
deformation strains in the LV, while Figure 2(B, C) illustrates the example of
2-dimensional deformation.
Myocardial
tagging is an established technique has been considered to be the gold standard
of strain imaging. Tagging allows for the spatial distribution of saturated
magnetization across the myocardium producing dark bands which are also known
as tag lines [8]. As the heart contracts, these tag lines become distorted
reflecting the underlying tissue motion and thus providing features which allow
for temporal tissue tracking methods. Tracking methods allow for displacement
and strain calculations in regional segments of the LV. Figure 2 illustrates the
distortion of the tag lines from time of encoding to a systolic time point. The
corresponding Ecc and Err strain maps are included for a
healthy volunteer.
Myocardial
tagging is an established technique used
clinically in the detection of viable myocardium, cardiac dyssynchrony,
and ischemia. However, quantitative results are time consuming and requires
substantial user interaction hindering its use in a day to day clinical
setting. Furthermore, the spatial resolution is determined by the distance
between tag lines and not the images.
Harmonic
phase (HARP) MRI is an imaging technique used for the rapid analysis and
visualisation of tagged MR images [9]. The method is based on the fact that spatial
modulation of magnetization (SPAMM)-tagged MR images consist of a collection of
distinct spectral peaks in the Fourier domain where each peak contains motion
information in a certain direction. As each peak is isolated, the inverse
Fourier transform is calculated, resulting in a phase linearly related to the
tissue motion in that direction. HARP processing can be up to 10 times faster
than conventional tag following techniques, however, isolating spectral peaks
in k-space leads to SNR loss na decreased spatial resolution.
PC-MR
is an imaging technique which encodes the instantaneous tissue velocity
directly into the voxel phase with the use of a bipolar gradient [10]. PC-MR has
the potential to provide valuable information in the evaluation of global and
regional systolic and diastolic function. The sequence is available on most
clinical scanners and has fast post-processing methods.
Velocity
and strain rate are determined from phase velocity maps. PC-MR has been
validated and is often used as a technique for measuring blood flow. However, phase
velocity mapping has been used in several clinical studies to quantify regional
myocardial motion and detect contractile dysfunction under various conditions.
Time to peak velocity is used to quantify ventricular dyssynchrony and reduced
systolic and diastolic peak velocities to quantify HF. Strain can be calculated by integrating
velocities with respect to time, however, as errors propagate through the
integration, this is not often done.
Strain analysis of cine steady-state free
precession (SSFP) otherwise known as feature-tracking (FT) offers the advantage
of convenience, since strain is assessed from standard SSFP images which are
part of nearly all standard cardiac MR examinations, thus there is no need for
additional acquisitions. FT involves tracking features in the SSFP images such
as the endocardial border through the cardiac cycle from which displacement
fields are derived and strain is calculated. There are various algorithms such
as Tom Tec and heart deformation analysis (HDA) have been implemented to
calculate strain from SSFP images.
These
methods are fast and automatic and have been validated against manual delineation
by expert observers [11] and have been evaluated in healthy volunteers [12]. Results
show that whole slice global strain measured using feature-tracking have good
correlation to myocardial tagging derived global strain. However, these methods
have not been evaluated in patient populations and various studies have
disregarded regional strain assessment using SSFP FT [13, 14] due to large
regional differences [12] and poor reproducibility [15, 16]
Cine
DENSE MR is becoming the gold standard for strain imaging techniques. Cine
DENSE encodes the tissue displacement directly into the phase of the images,
therefore, myocardial motion and deformation is being measured directly at a high
spatial resolution over segments of the cardiac cycle [17, 18]. DENSE MR
imaging contains a SPAMM kernel to position encode the magnetization at an end
diastolic time frame. Tissue displacement which occurs between displacement
encoding pulses and subsequent acquisition times results in a phase shift of
the stimulated echo. Proceeding post-processing methods, this phase shift is a
linear representation of tissue displacement. Tissue tracking methods are
applied to calculate LV displacement fields and strain. Figure 3 illustrates
the magnitude, phase in two encoding directions and the corresponding vector
displacement field at end-systole.
The Ecc strain time curves and
DENSE Ecc strain map in Figure 4 A and B, illustrates the
contraction pattern of a healthy volunteer. However Figure 4 D and E, decreased
contractile function is clear in both strain time curves and the Ecc DENSE
strain maps in the inferior-septal region. This corresponds well with the late
gadolinium enhanced image which clearly shows myocardial scar in this region.
Figure 5 illustrates an example where cine
DENSE strain is used to calculate and quantify regions of delayed mechanical
activation in HF patients undergoing CRT. The strain time curve in Figure 5(A)
indicates delayed activation in the lateral wall of the LV. Active contour
methods applied to a strain matrix detects regions of early and delayed
mechanical activation times along the LV as shown in Figure 4(B). Bull’s-eye
plot of multi-slice activation mapping are produced and can be used to guide
the CRT procedure to ensure the LV lead is placed in a region of maximal
delayed mechanical activation.Conclusions
The importance of strain imaging is
growing significantly and studies are demonstrating the ability of strain to
diagnose and manage a wide range of cardiovascular disease. There are various
methods available, each with its advantages and limitations. Each study should
choose the methods carefully depending on speed, accuracy and dependency.Acknowledgements
No acknowledgement found.References
1. Roger, et al., Cir, 2012; 125: e2-e220 2. Mignot, et al. J Am Soc Echocardiogr., 2010. 23(10): p. 1019-1024. 3. Stanton, et al. Circ: Cardiovasc Imaging, 2009. 2(5): p. 356-364. 4. Jing et al. J Cardiovasc Magn Reson, 2016; 18:28 5. Ernande et al. Rdiology, 2012; 265:402-409 6. Mangion, et al.. 2017, J Cardiovasc Magn Reson, conference proceedings. In print. 7. Auger et al. J Mang Reson, 2017. 8. Axel, et al.. Medical Image Analysis, 9(4):376_393, 2005. 9. Osman, J of the Soc of Magn Reson in Med, 42(6):1048, 1999 10. Pelc, et al. J of Magn Reson Imaging, 5(3):339_345, 1995. 11. Li et al. JACC, 2010; 3(8):860-6 12. Augustine et al. JCMR, 2013;15:8 13. Moody et al. JMRI, 2015; 41:1000–1012 14. Hor et al. JACC Img, 2010; 3(2):144-151 15. Morton et al. JCMR, 2012;14:43 16. Wu et al. J Cardiovasc Magn Reson. 2014; 16(1): 10). 17. Aletras, et al. J of Magn Reson, 137(1):247_252, 1999. 18. Kim et al. Radiology, 2004; 230:826-871Figures

Figure 1: (A) Diagram illustrating principal strain
directions and shear strains. (B, C) 2-D strain deformation during diastole and
systole.
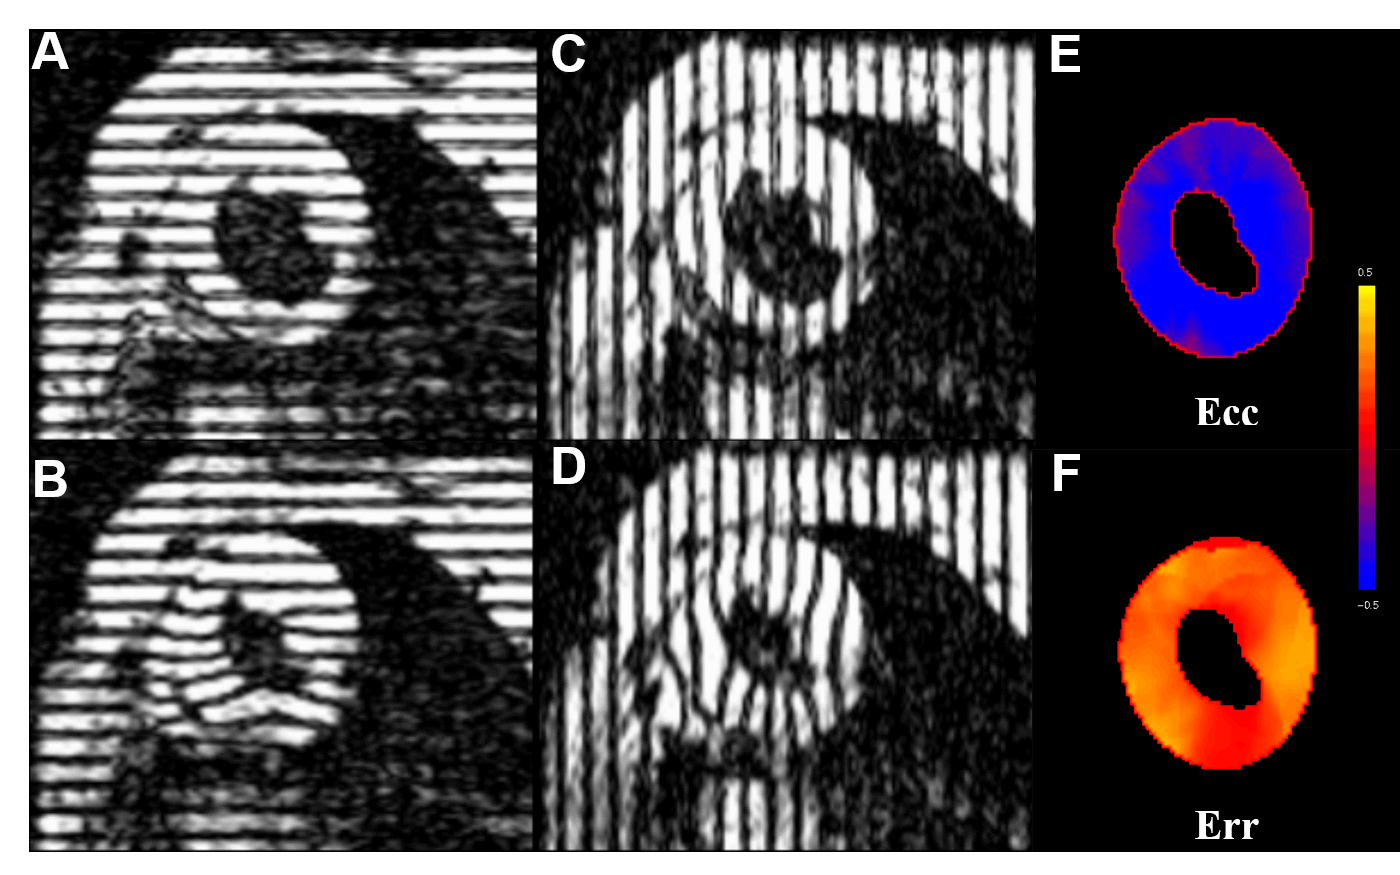
Figure
2: (A-D) Tagged images of a mid-ventricular short axis slice at end diastole
(A, C) and end-systole (B, D). (E, F) corresponding Ecc and Err
strain maps respectively.
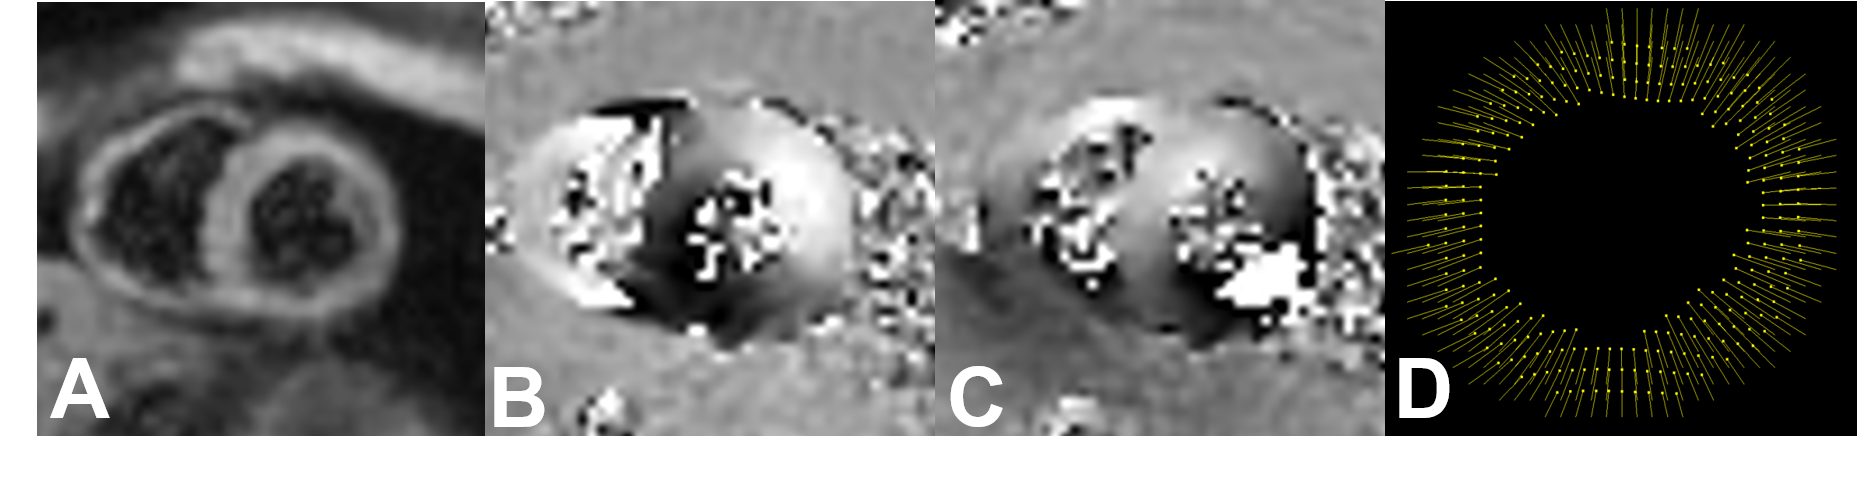
Figure 3: End-systolic short axis DENSE images. (A)
Magnitude, (B) x-encoded and (C) y-encoded phase images. (D) Corresponding
DENSE vector displacement filed
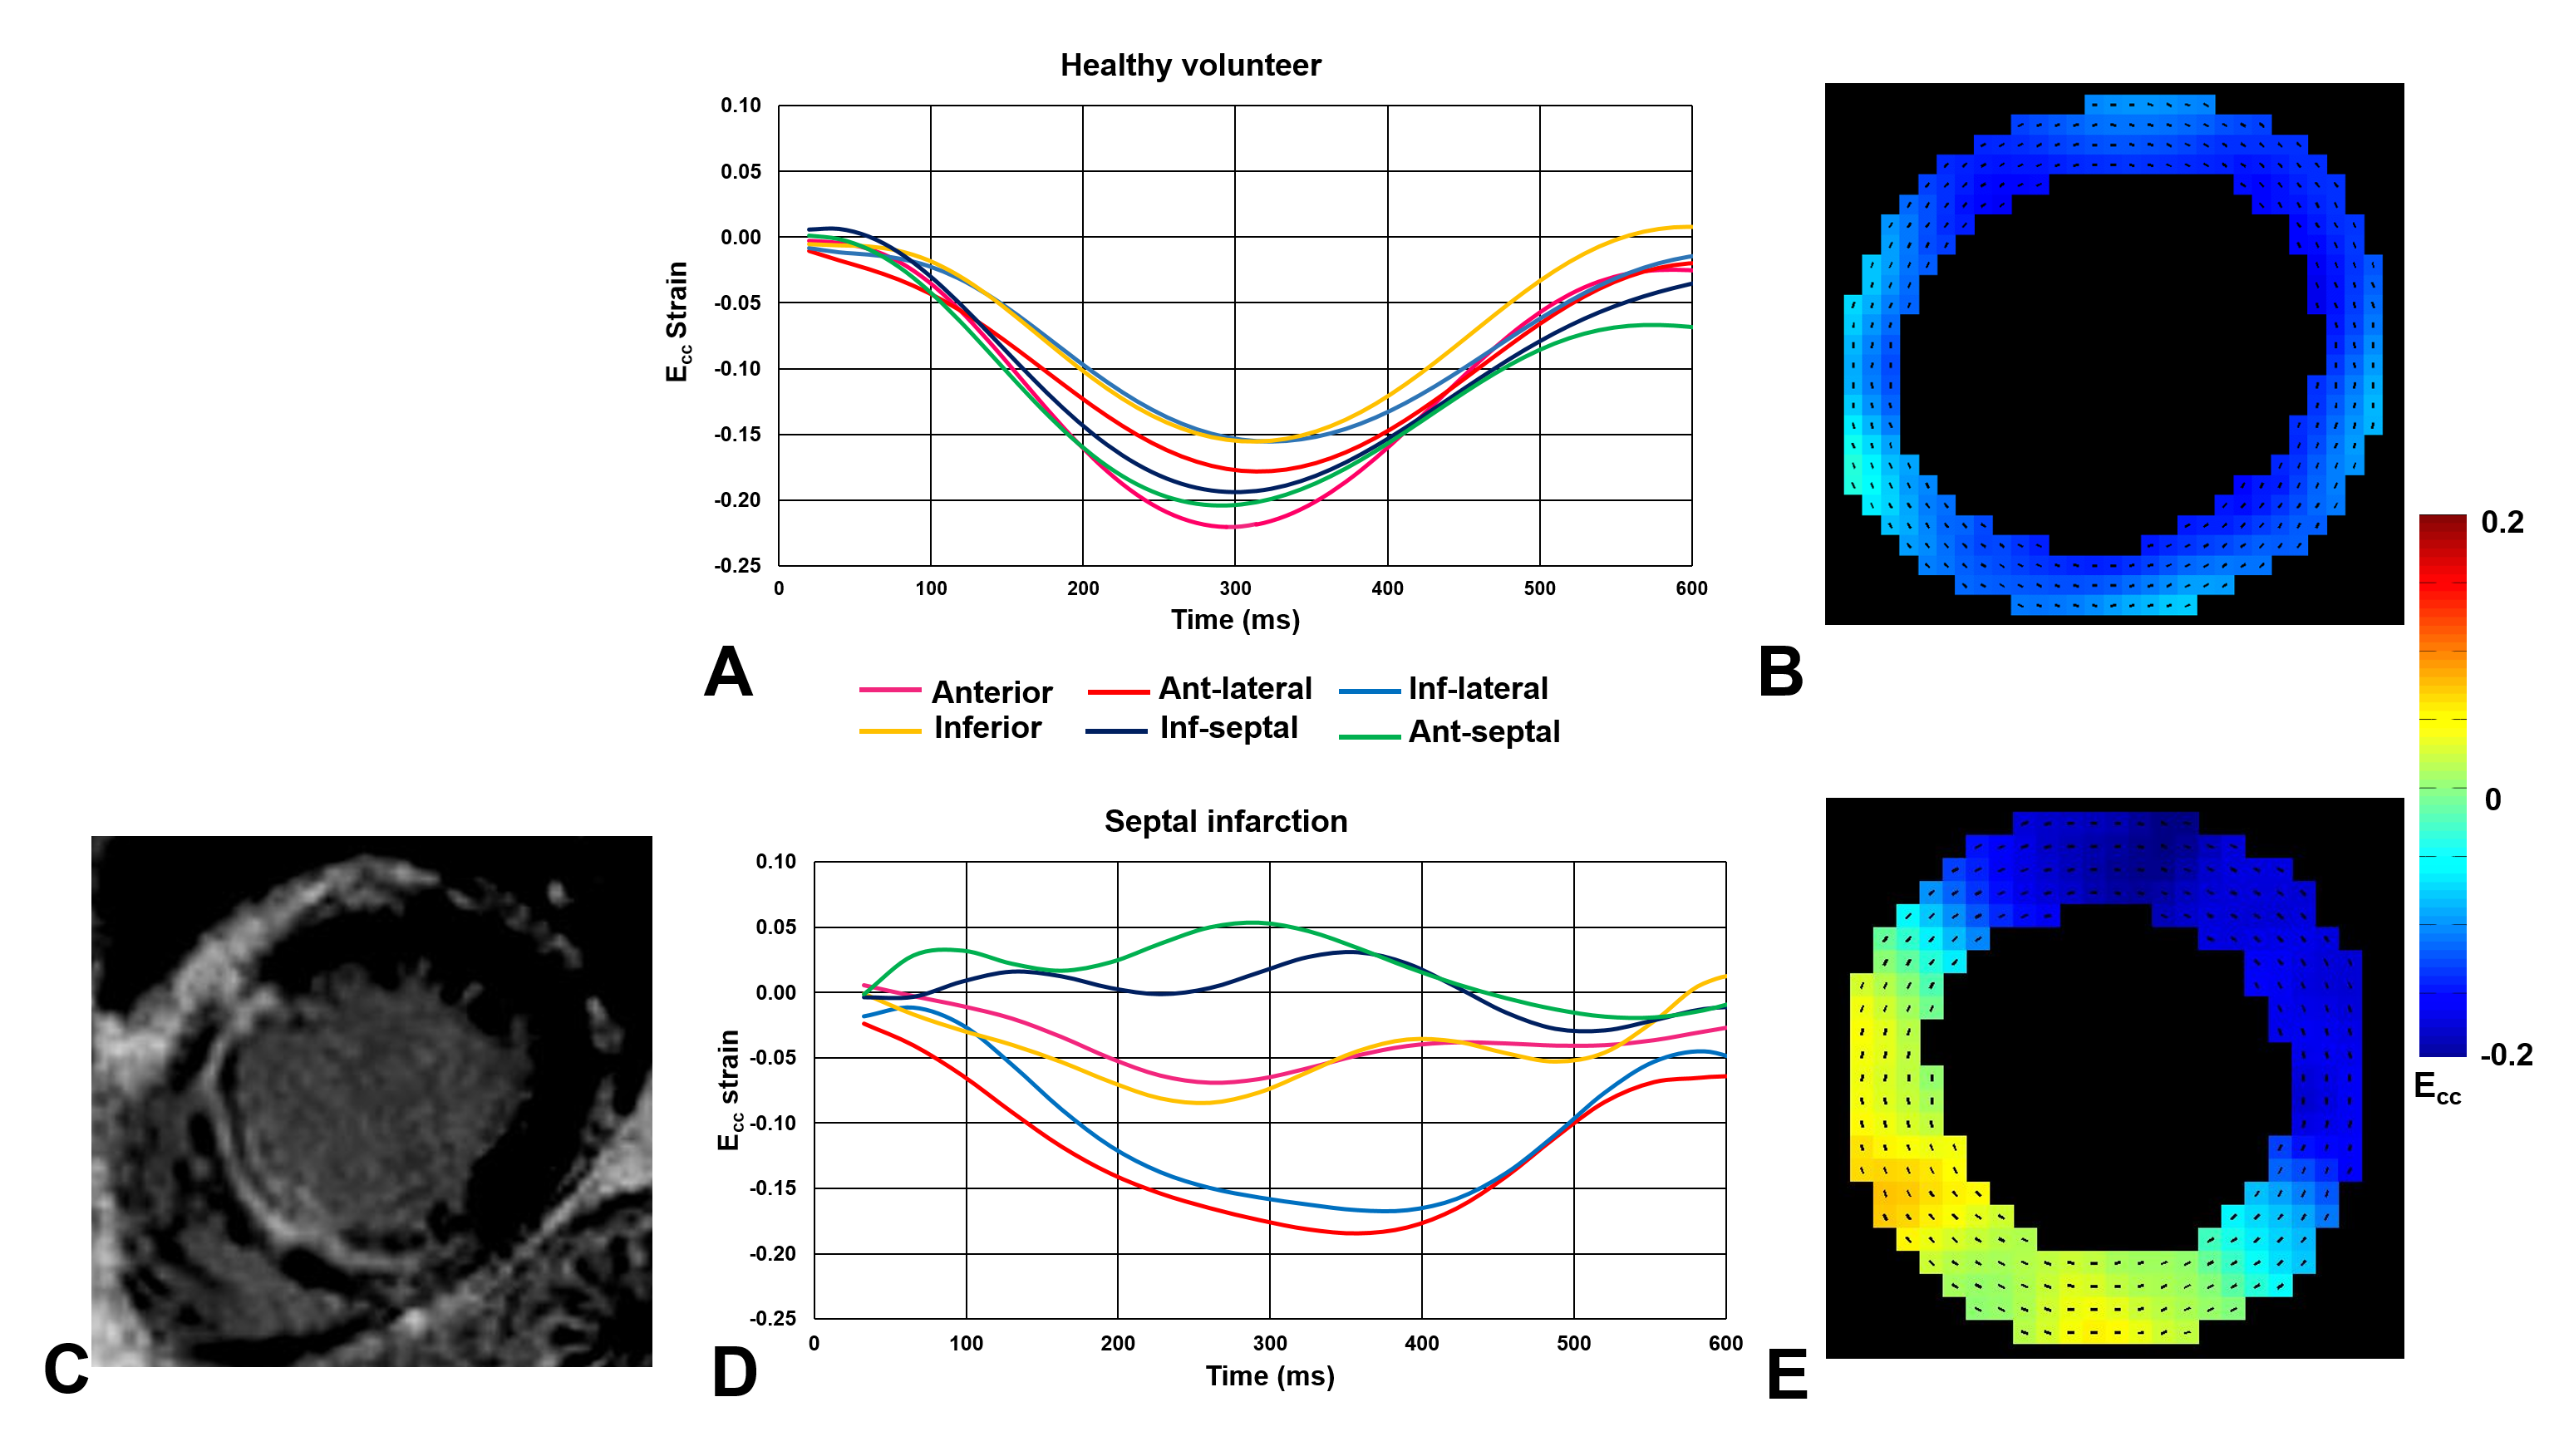
Figure
4: Cine DENSE circumferential strain analsyis. (A) Ecc strain time
curves of a healthy volunteer, (B) corresponding Ecc strain map. (C)
LGE image indicating myocardial scar towards LV septum. (D, E) DENSE anaysis
corresponding to patient in C. Curves and strain map indicate decreased
contractility in LV septum.
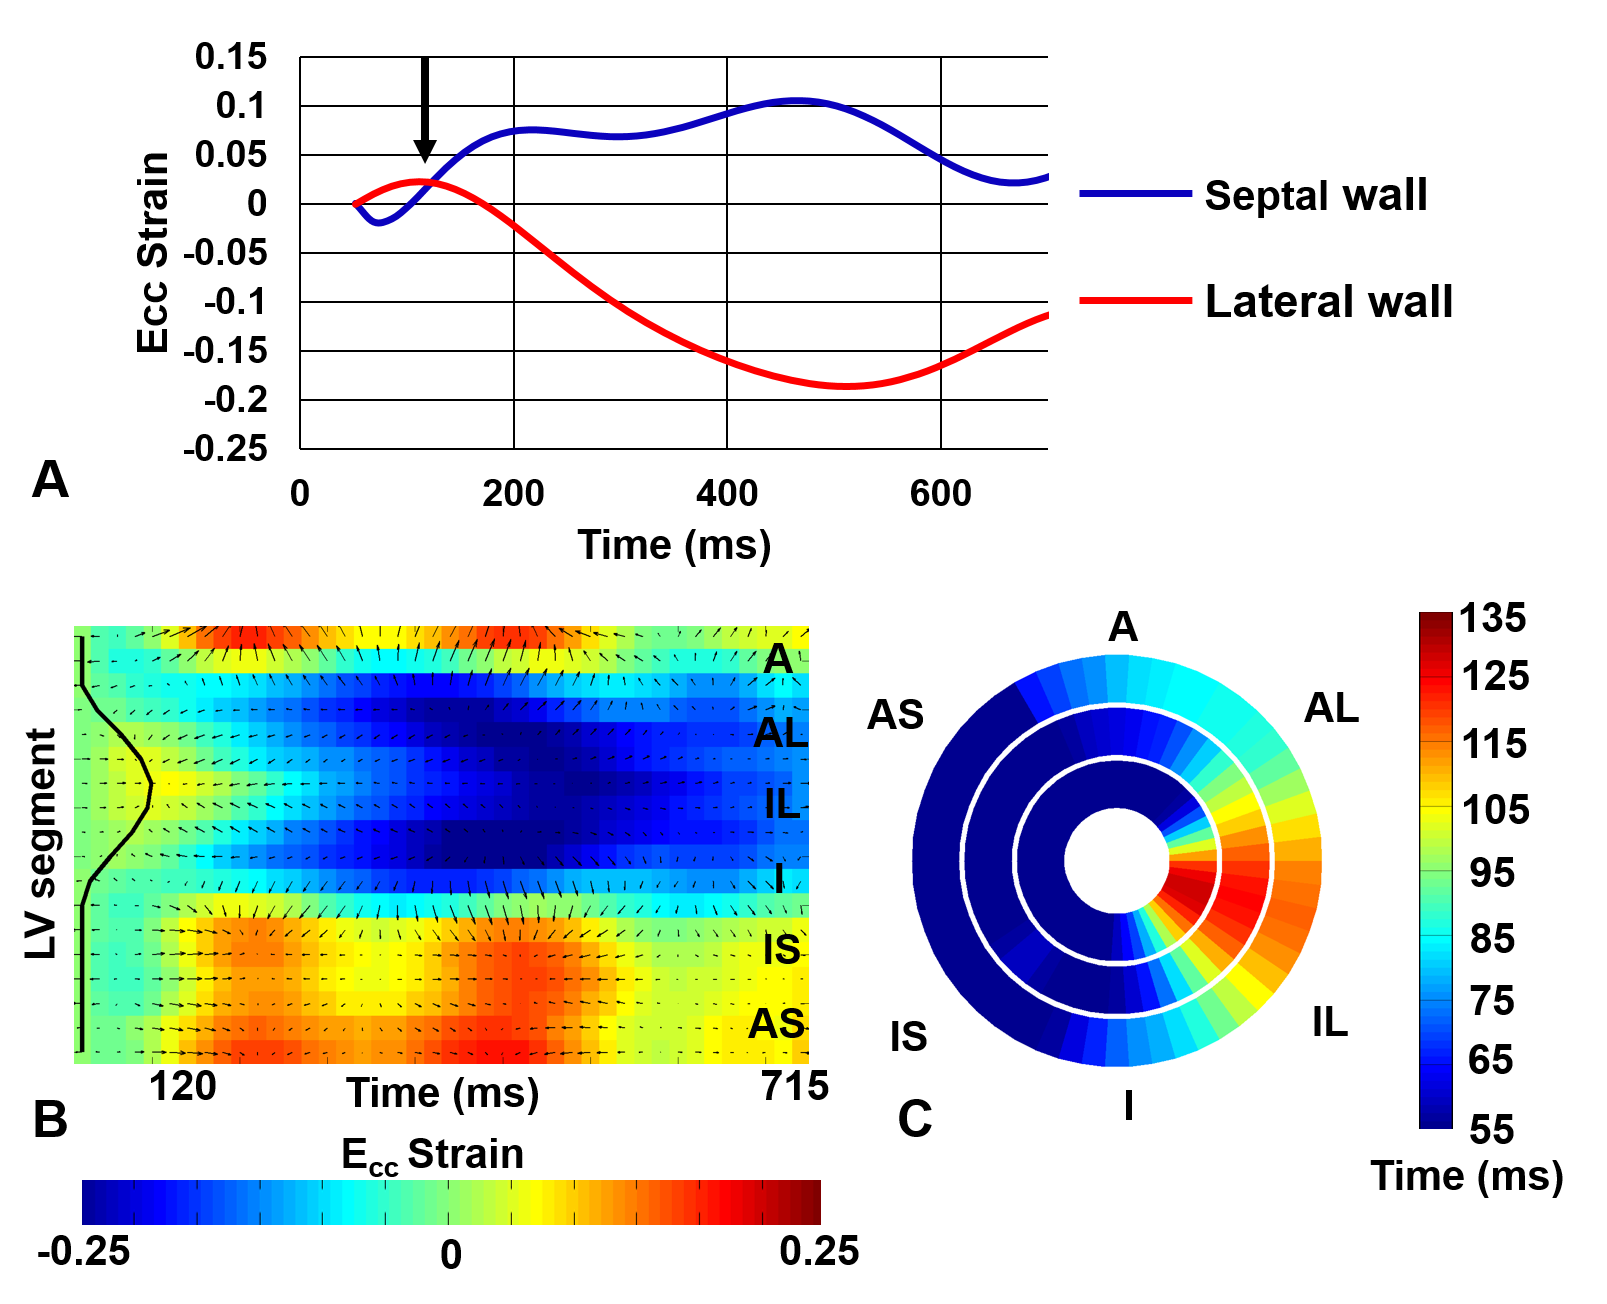
Figure 5: DENSE strain analysis of
HF patient with left bundle branch block undergoing CRT. (A) Strain time curves
indicating delayed activation (black arrow), (B) detection of delayed
activation region by an active contour, (C) 3D activation time map indicating
latest activated region in the infer-lateral wall towards the LV apex.