MRS in Hepatic Disease
1Department of Radiology, University of California, San Diego, La Jolla, CA, United States
Synopsis
The 1H MR spectrum of the liver is dominated by a water peak and peaks associated with fat. This talk will examine the technical challenges associated with MRS of fat and water in the liver and examine how to minimize or correct confounders associated with estimation of three tissue properties: Proton Density Fat Fraction, Liver Triglyceride Composition, and Liver Water and Fat Relaxation.
Purpose
This talk is an overview of liver spectroscopy with a focus on fat-water spectroscopy.Introduction
MR spectroscopy in the liver is challenging due to motion, primarily respiration. As with MR Imaging, the main technique to deal with respiratory motion is to acquire spectroscopy in a breath-hold, though SNR restrictions may require acquisitions using respiratory-gating or free-breathing. However respiratory-gating will introduce variable TR, possibly introducing patient dependent T1 bias. In free breathing the voxel location will be variable, and motion also results in increased line widths.
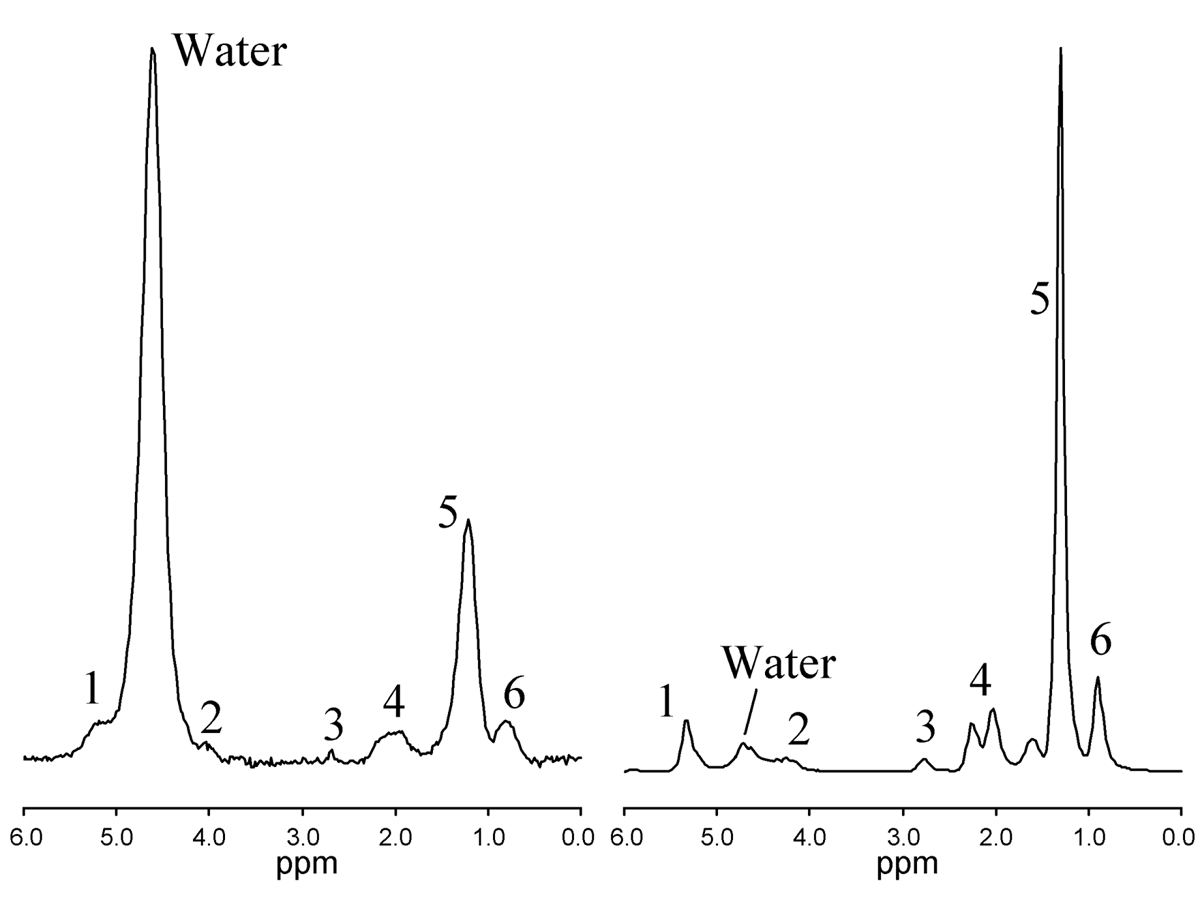
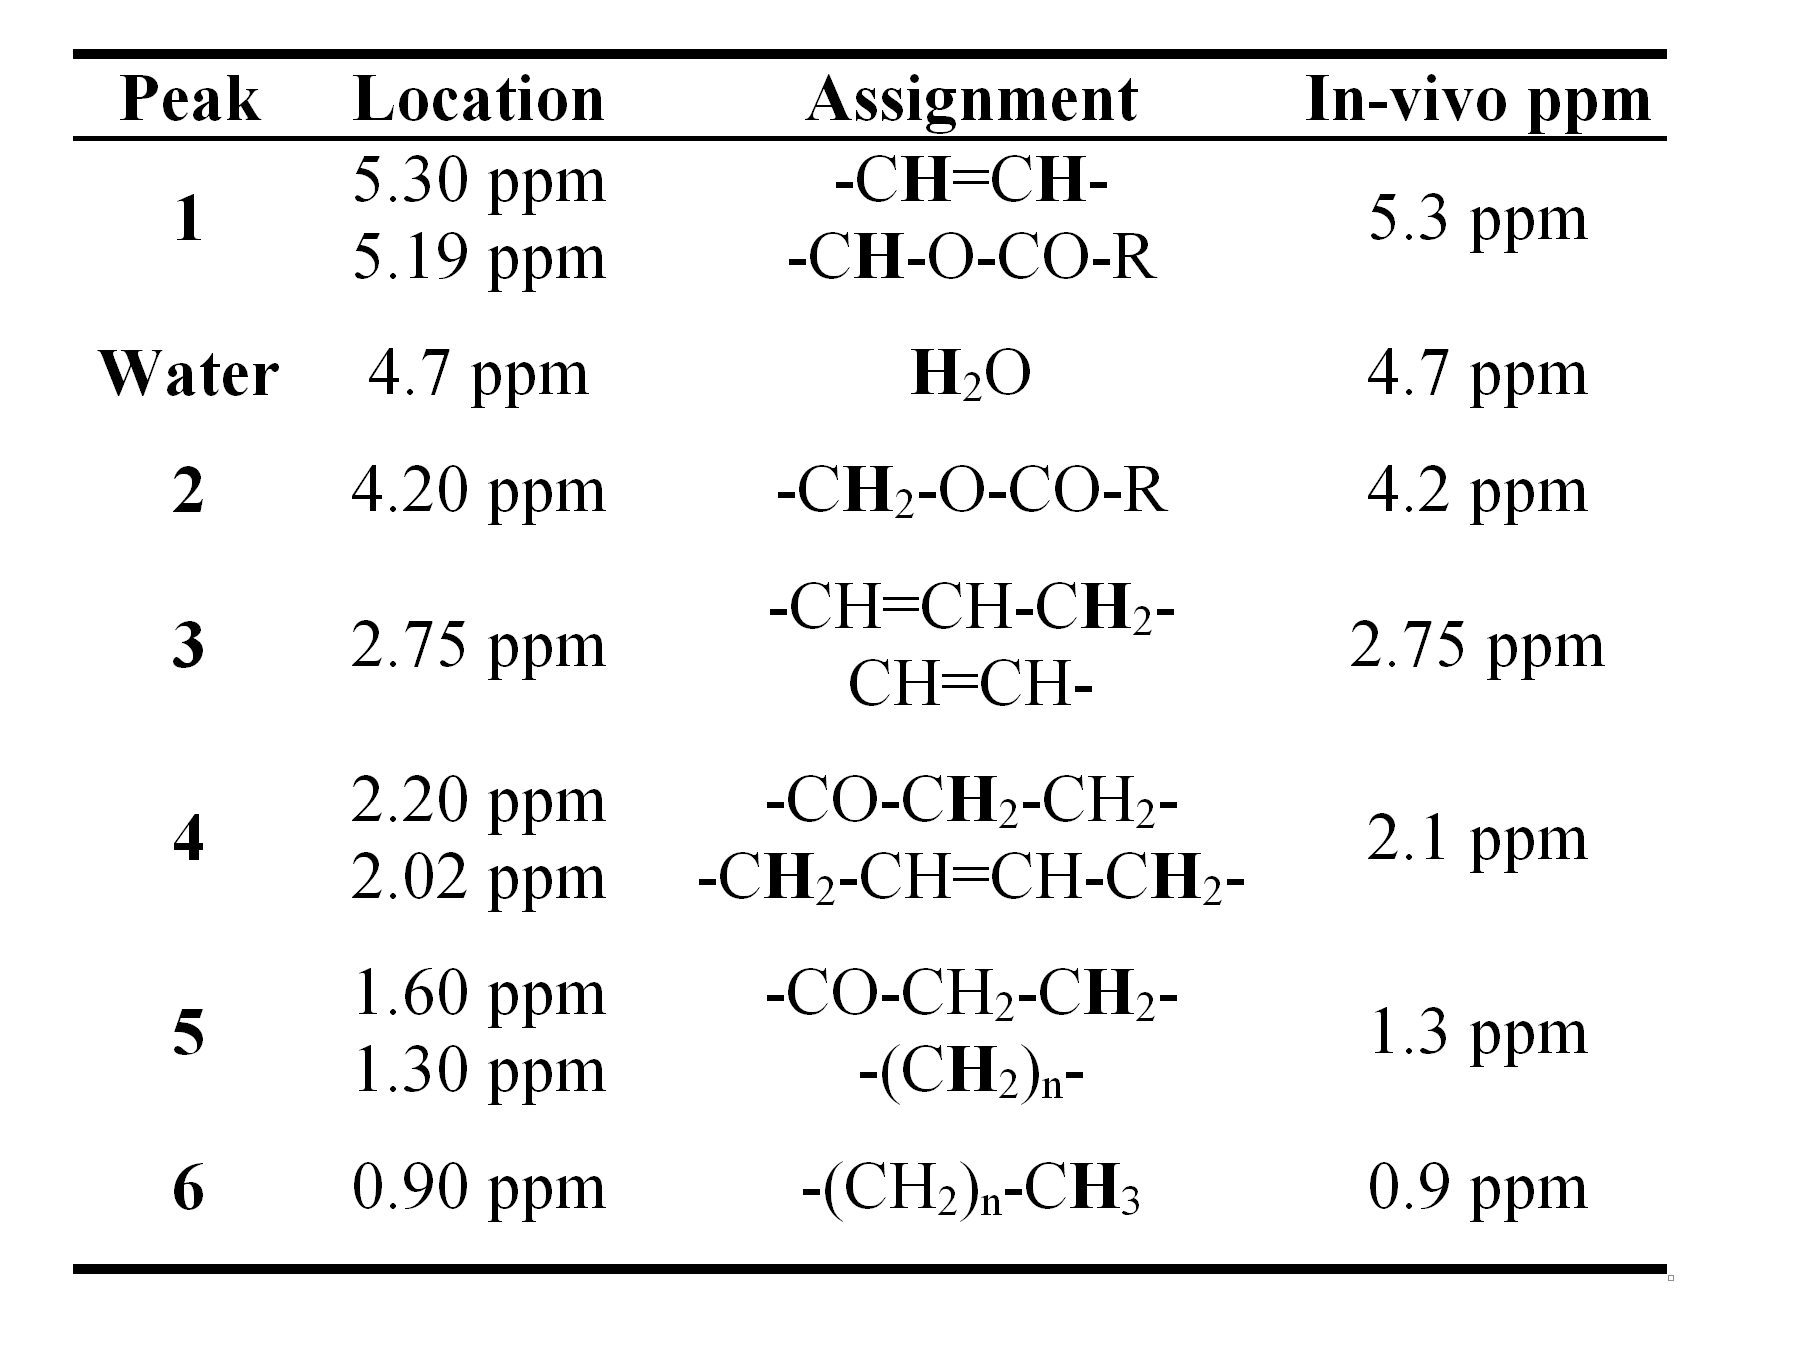
The 1H MR spectrum of liver is dominated by water and peaks associated with triglyceride which has multiple peaks associated with different parts of the triglyceride molecule. Figure 1 shows typical 1H MRS spectrum from liver (left) and human adipose tissue (right). The assignment of each of the peaks is shown in Table 1. While the distinct spectral resonances for each of the structurally distinct triglyceride proton moieties can be observed in adipose tissue, the distinction between many of these triglyceride moieties is lost in liver. Further complicating liver resonances, the water signal merges with the fat peaks at 5.3 and 4.2 ppm. The smallest fat peak is the peak at 2.75 ppm, which at even moderate liver fat levels can be hard to distinguish from noise (1). Not only will the fat peaks contain contributions from more than one triglyceride moiety, fat peaks experience J-coupling from the interaction of different spin states, resulting in a complex peak structure for individual spectral moieties (2,3).
The two main 1H MRS sequences used to measure triglyceride spectra in vivo are PRESS (Point Resolved Spectroscopy) (4) and STEAM (Stimulated Echo Acquisition Mode) (5,6). PRESS has double the SNR compared to STEAM, but STEAM is capable of shorter TEs (7). While the greater SNR of PRESS may be advantageous in detecting metabolites, for triglyceride the shorter TE available to STEAM minimizes J-Coupling effects as discussed below.
Proton Density Fat Fraction
The most common use of MRS in liver is the estimation of amount of fat which when measured appropriately gives the Proton Density Fat Fraction (PDFF) a standardized MR-based biomarker of tissue fat concentration (8,9). To determine PDFF, confounders such as T1 bias, T2 decay, J-coupling, chemical shift displacement, and the spectral complexity of fat must be addressed or minimized.
As fatty liver disease is generally diffuse, the most important part of voxel selection is avoiding major vessels and the edge of the liver. Water and fat peaks (Figure 1) have different T1 and T2 values (10-12). Commonly, a long TR is chosen such that the water and fat peaks are independent of any patient-specific T1 relaxation differences. T2 correction is ideally achieved with acquisition of multiple TEs. There is sufficient signal from fat such that a spectrum can be obtained in a single average. Techniques have been developed that acquire single average spectra at multiple TEs in one sequence to gain T2-corrected fat estimates in a single breath-hold (13,14). It can be challenging to estimate the T2 of the individual fat peaks, and it is normal to model all the visible fat peaks in the range 0-3 ppm by just one T2. As the T2 of the fat peaks are similar, and significantly longer than water, this is an acceptable assumption.
Previously, both PRESS and STEAM sequences have served as gold standards for liver fat quantification in clinical studies, using a range of TEs, with single or multiple TEs (8,14). However, acquiring spectra with PRESS or STEAM causes J-coupled peaks to experience non-exponential decay behavior, with the effects of J coupling increasing as TE increases (15). As all liver fat resonances exhibit J coupling (2), it is advisable to use the minimum possible TE, or TE range, when attempting to measure PDFF. This strongly suggests the use of STEAM as it is capable of shorter TEs than PRESS. Measuring T2 with PRESS, or using STEAM with TE ranges similar to PRESS, may lead to underestimation of fat T2 and hence overestimation of fat peak area and PDFF (3). If a single TE acquisition is used (PRESS or STEAM), the minimum TE should be used to minimize both T2 variability and J coupling effects. When correcting single TE values for T2, T2s generated by STEAM over a short range should be used.
To accurately estimate PDFF, the response across the entire spectrum should be uniform– that is one unit of signal (from water or fat) gives the same peak area no matter where that peak is in the spectrum. One case where non-uniform response may occur is in the use of saturation bands close to an MRS voxel which can introduce non uniform response caused by chemical shift displacement (16). As the precise location of the voxel is often not critical in PDFF estimation, a voxel can generally be selected that does not required saturation bands. Thus, the use of saturation bands in PDFF estimation is not recommended for PDFF estimation.
Finally, as mentioned previously, there are two fat peaks at 5.3 and 4.2 ppm that are indistinguishable from the water peak. However as discussed below, the relative area of these peaks can be estimated from a previously-established standard liver spectrum (1) allowing correction for the fat subsumed by the water.
Liver Triglyceride Composition
1H MRS offers the possibility of determining the triglyceride composition in vivo at clinical field strengths (3 Tesla) (1, 16-18). As well as possibly providing new information about disease processes, characterization of the liver fat spectrum allows for accurate quantification using MR imaging based measurement techniques that incorporate the multi-peak spectral structure of hepatic triglycerides.
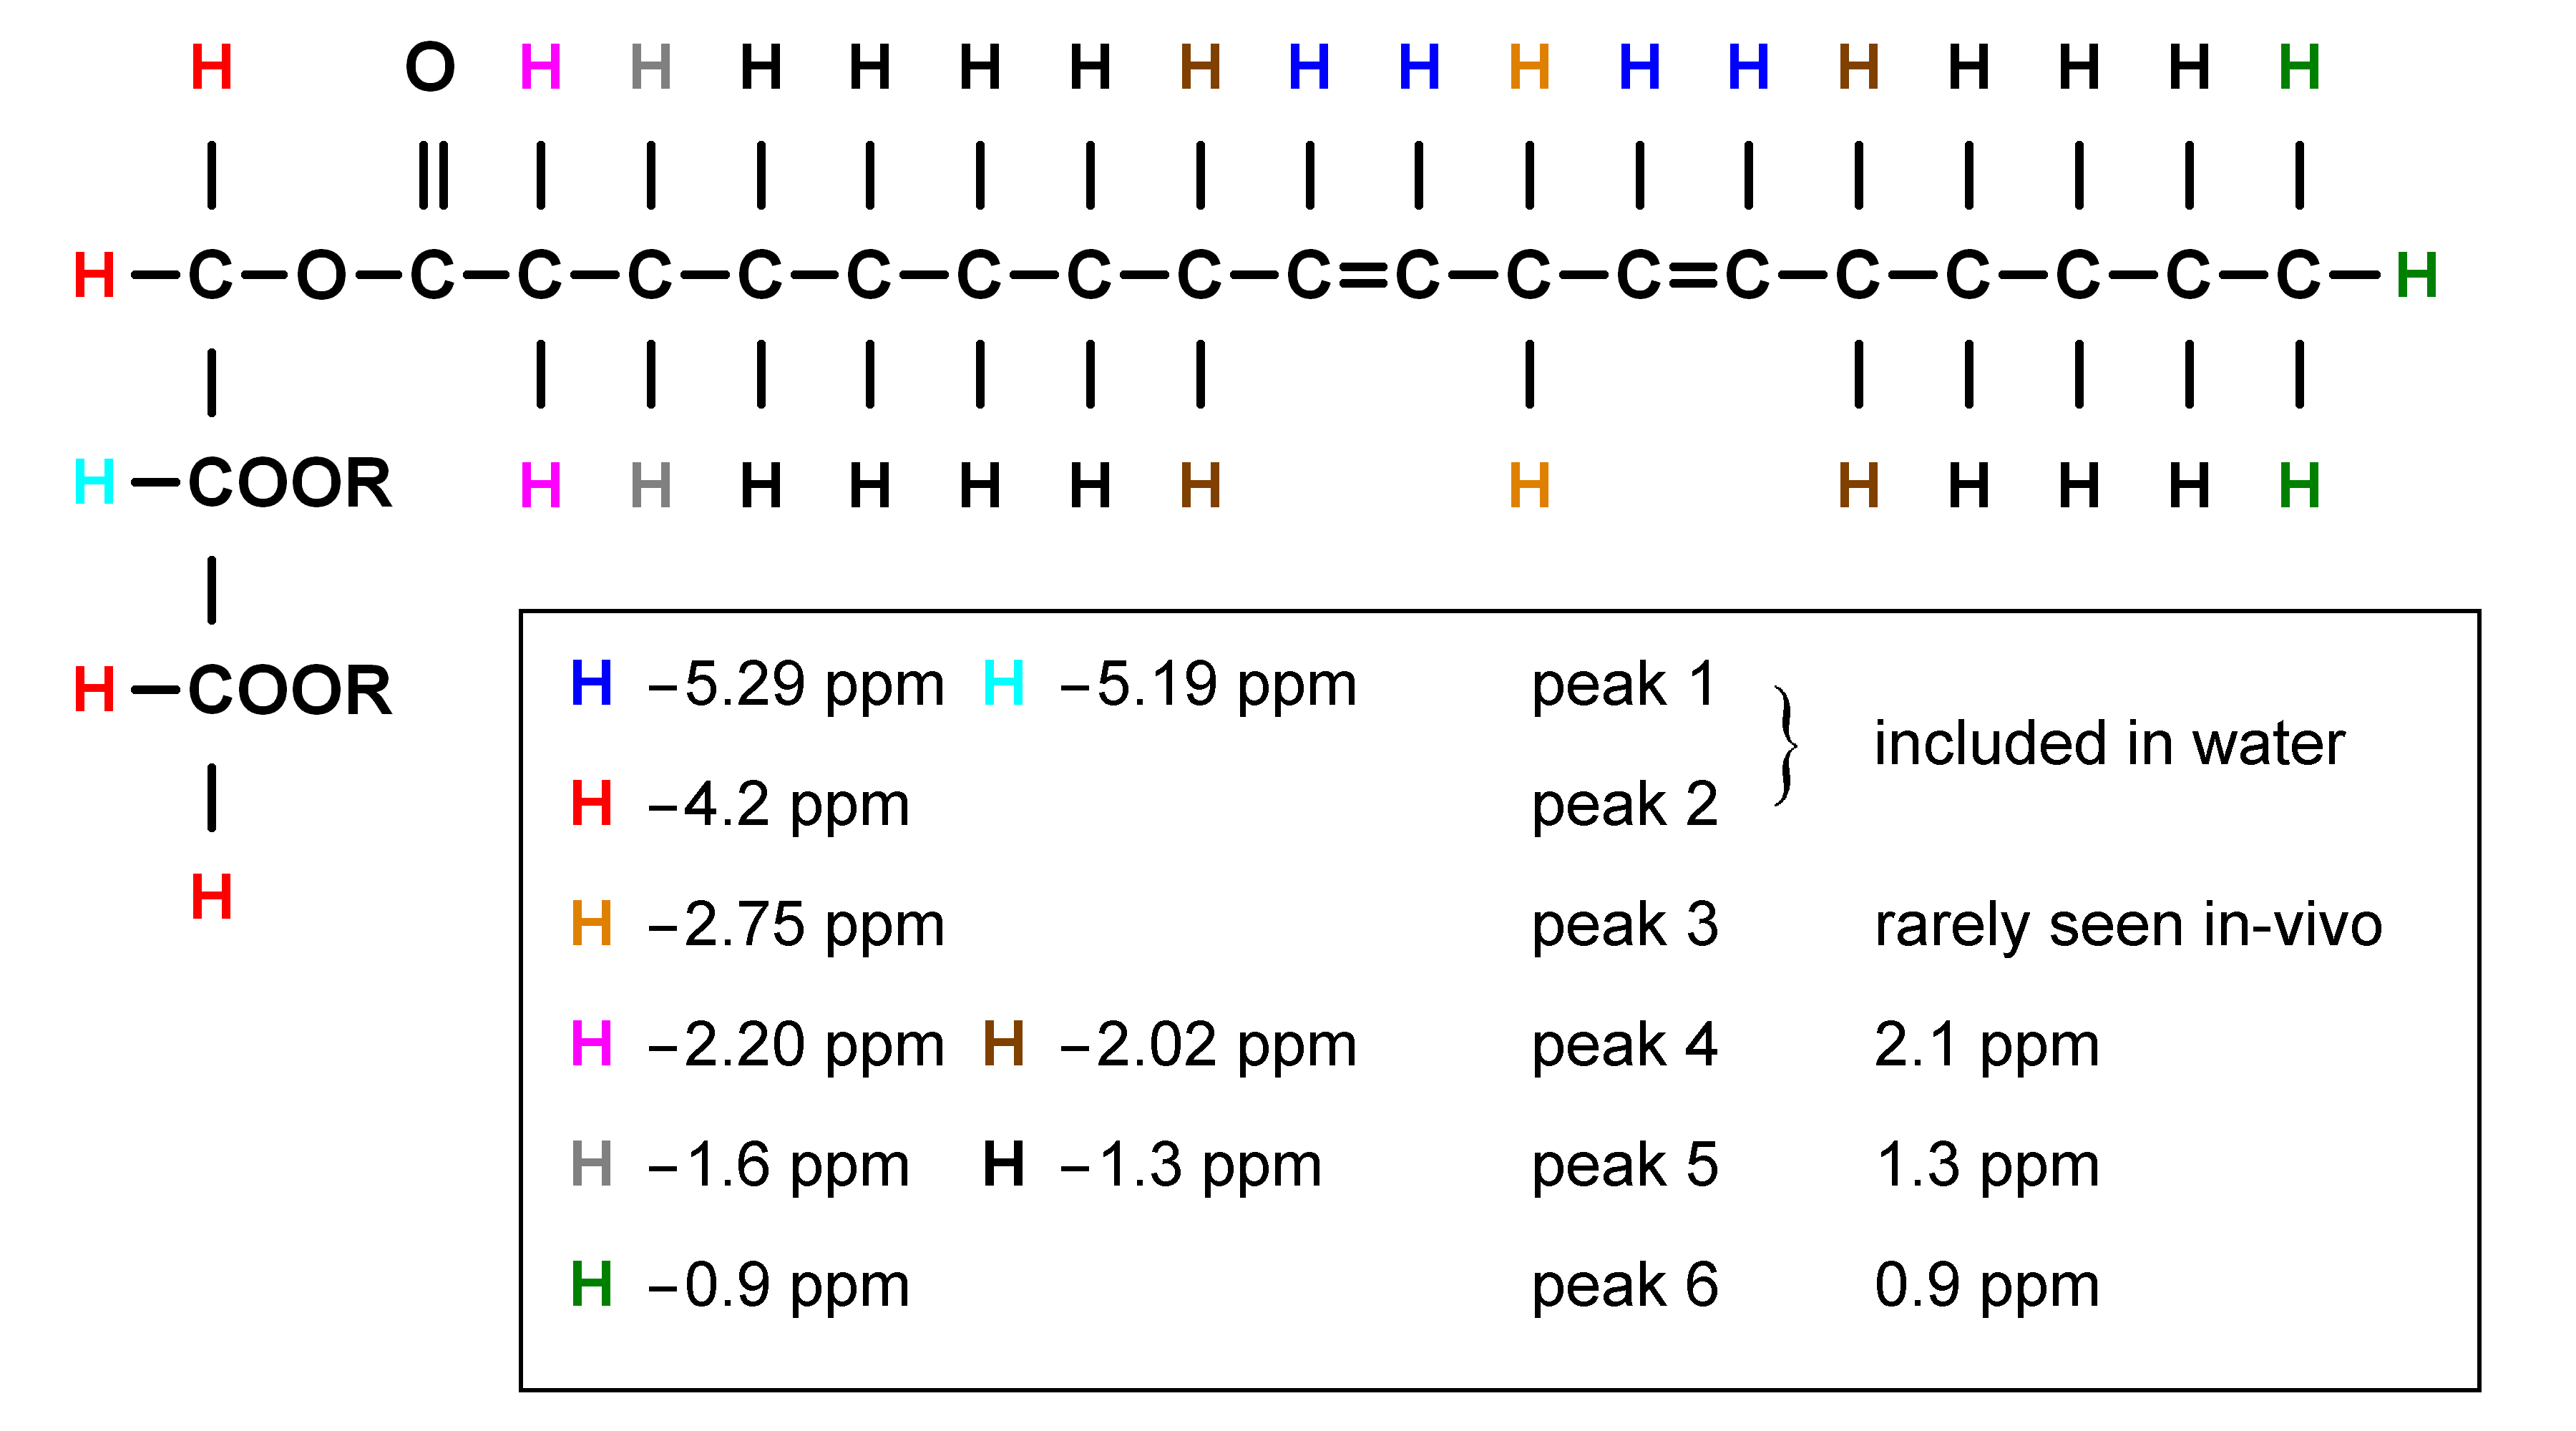
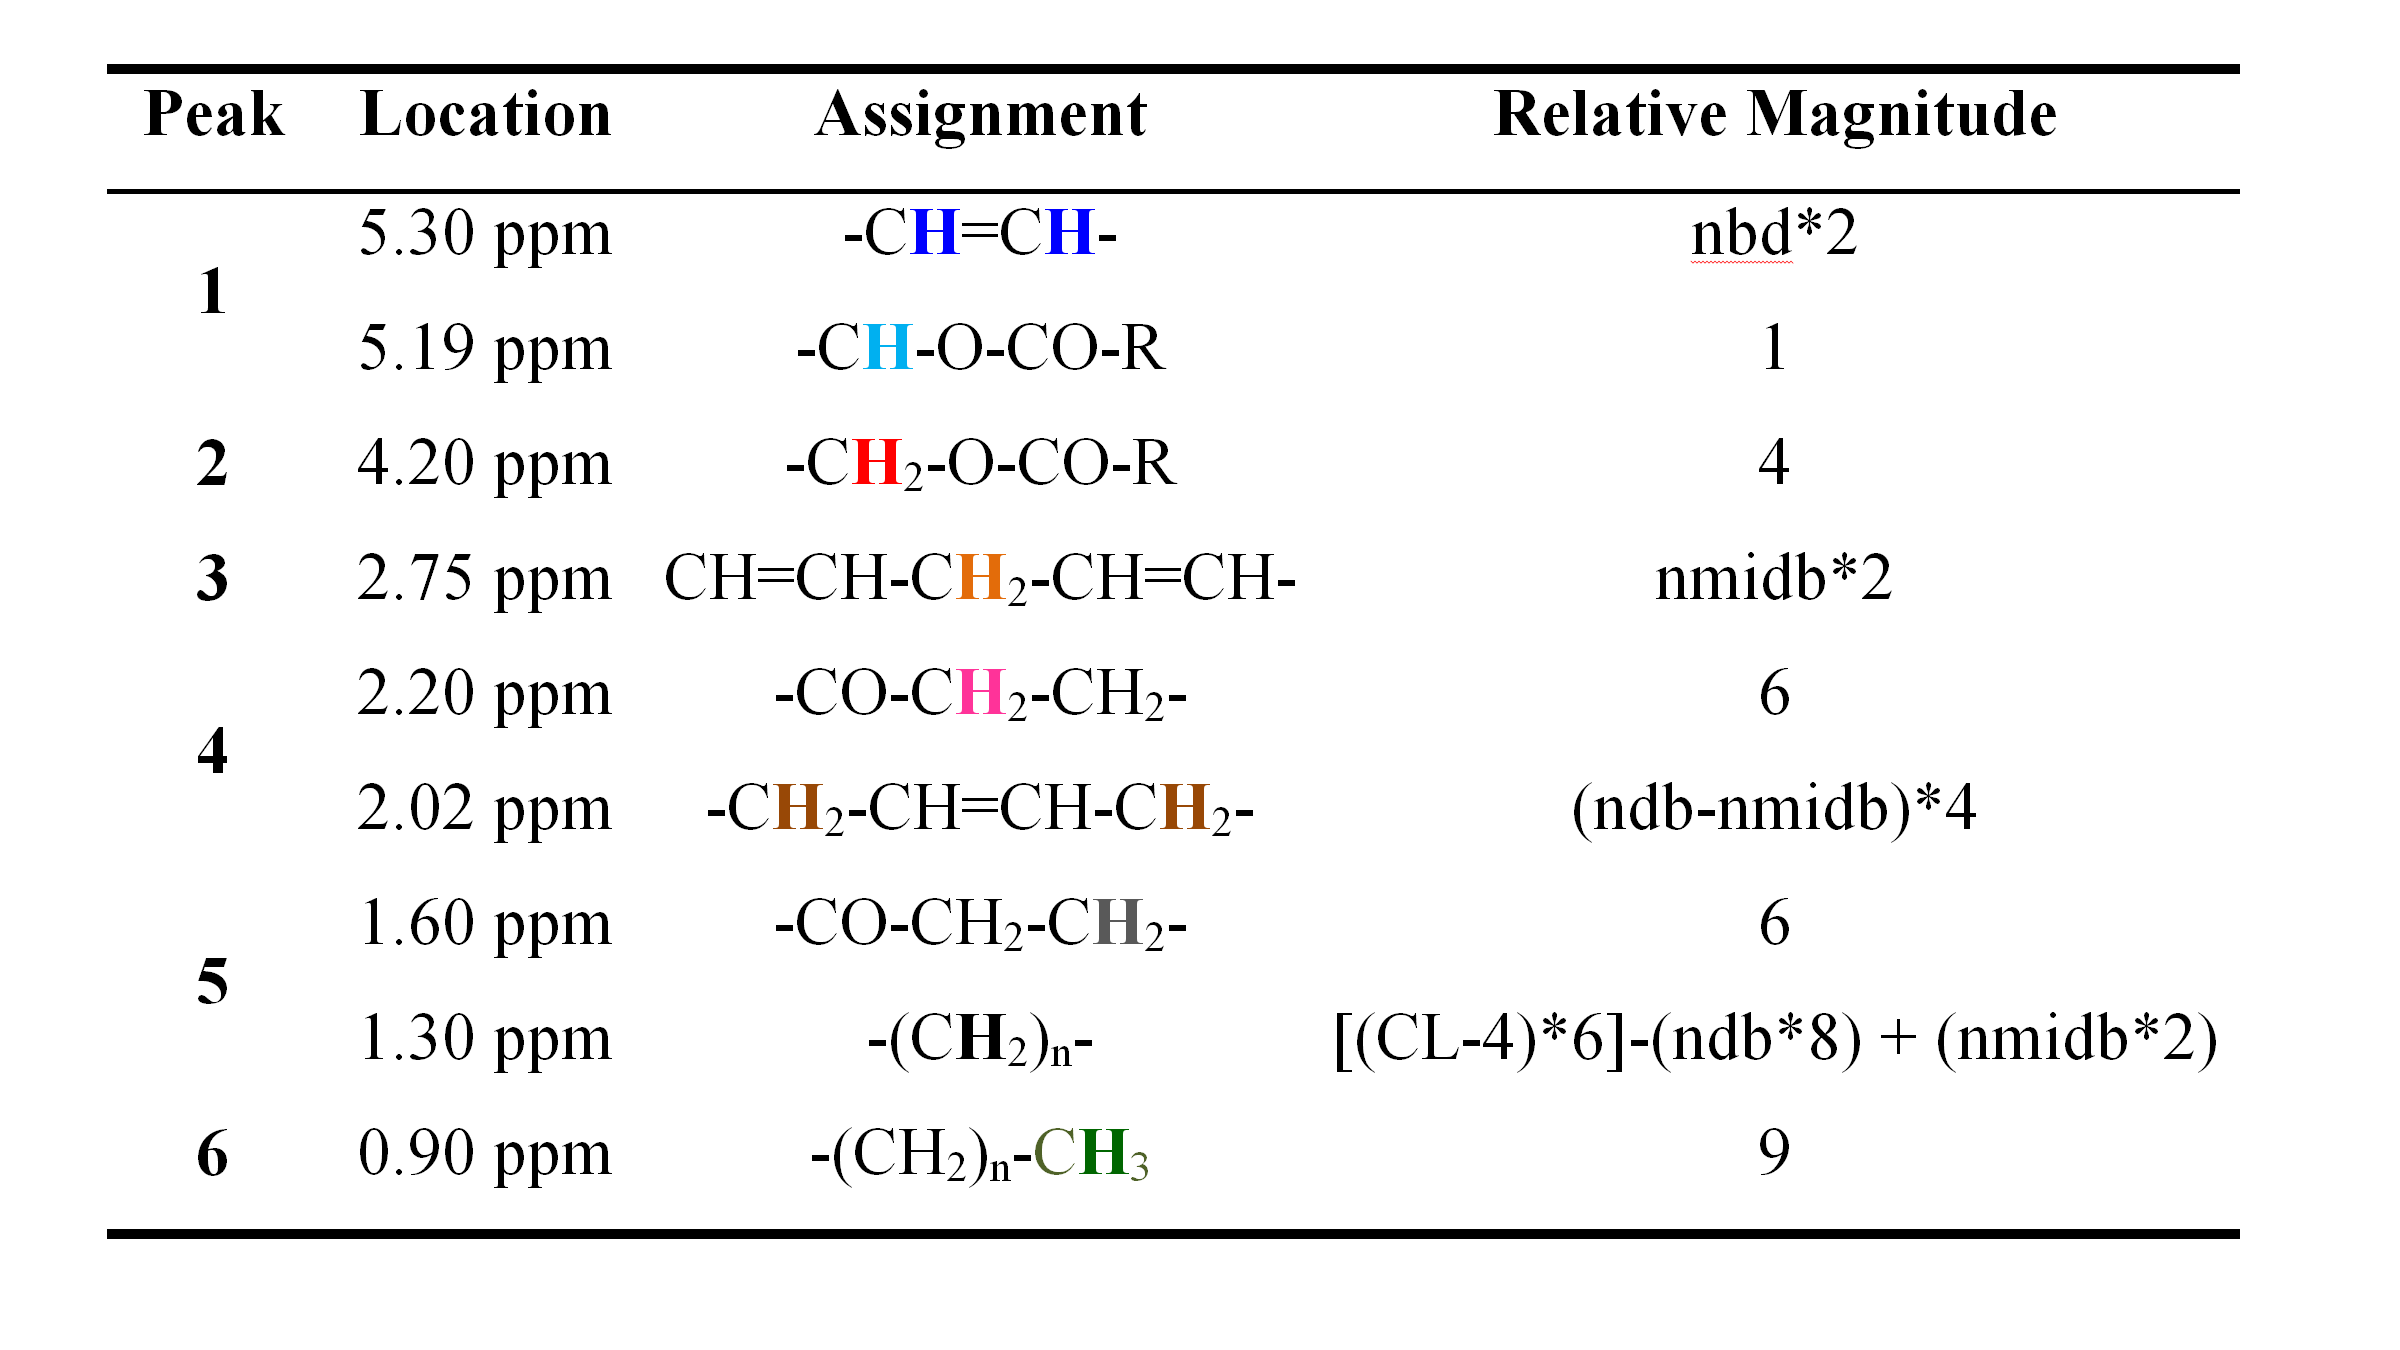
The chemical structure of a typical triglyceride is shown schematically in Figure 2. The relative magnitude of each of the resonances is specified by three variables: number of −CH=CH− double bonds per molecule (ndb), number of double bonds separated by a single CH2 (nmidb - number of methylene-interrupted double bonds), and the fatty acid chain length (CL) (Table 2) (1, 17-18). The relative area of each of the peaks is found by adding the number of hydrogen nuclei with that type of bond in the triglyceride molecule. As fat in vivo consists of a mixture of different triglycerides, we observe a mean CL, ndb, and nmidb weighted by the molecular fraction of triglyceride.
The fat peak areas measurable in liver at clinical field strengths (at 0.9, 1.3, 2.1, and 2.75 ppm) alone suffice to determine ndb, nmidb, and CL, from which relative magnitudes of the non-measurable 4.2 and 5.3 ppm fat peaks can be derived, and the complete liver 1H MR spectrum defined (1).
The same considerations detailed in estimating PDFF must be addressed when estimating liver fat composition. To accurately quantify fat composition STEAM with minimum TE should be used. Accurate determination of all fat peaks, particularly the polyunsaturated peak at 2.75 ppm is required (18). This may require more acquisitions than can be achieved in a breath-hold, indicating the use of respiratory-gated acquisition. The T1 of fat peaks is short enough that T1 bias will not be introduced by using gating. As the T2s of all fat peaks are significantly longer than the minimum TE of STEAM, acquiring with a single TE with correction with previously established T2 values is acceptable. Even with gated acquisition, MRS will struggle to determine fat type at the lowest PDFF values.
Liver Water and Fat Relaxation
As discussed with PDFF, it is possible to acquire multiple spectra in a single breath-hold to give estimates of liver T2, fat, and water. However, the long TR required for PDFF estimation limits the number of different TE spectra than can be acquired; the limited number of TE values may reduce estimation accuracy of T2. Acquiring more TEs in a breath-hold to increase accuracy of T2 estimation requires reduced TR, introducing T1 bias in liver fat estimation. It is also possible to estimate T1 of fat and water in a single breath-hold. Possible approaches to estimating T1 include varying the mixing time (TM) of the STEAM sequence, or varying TR (11).
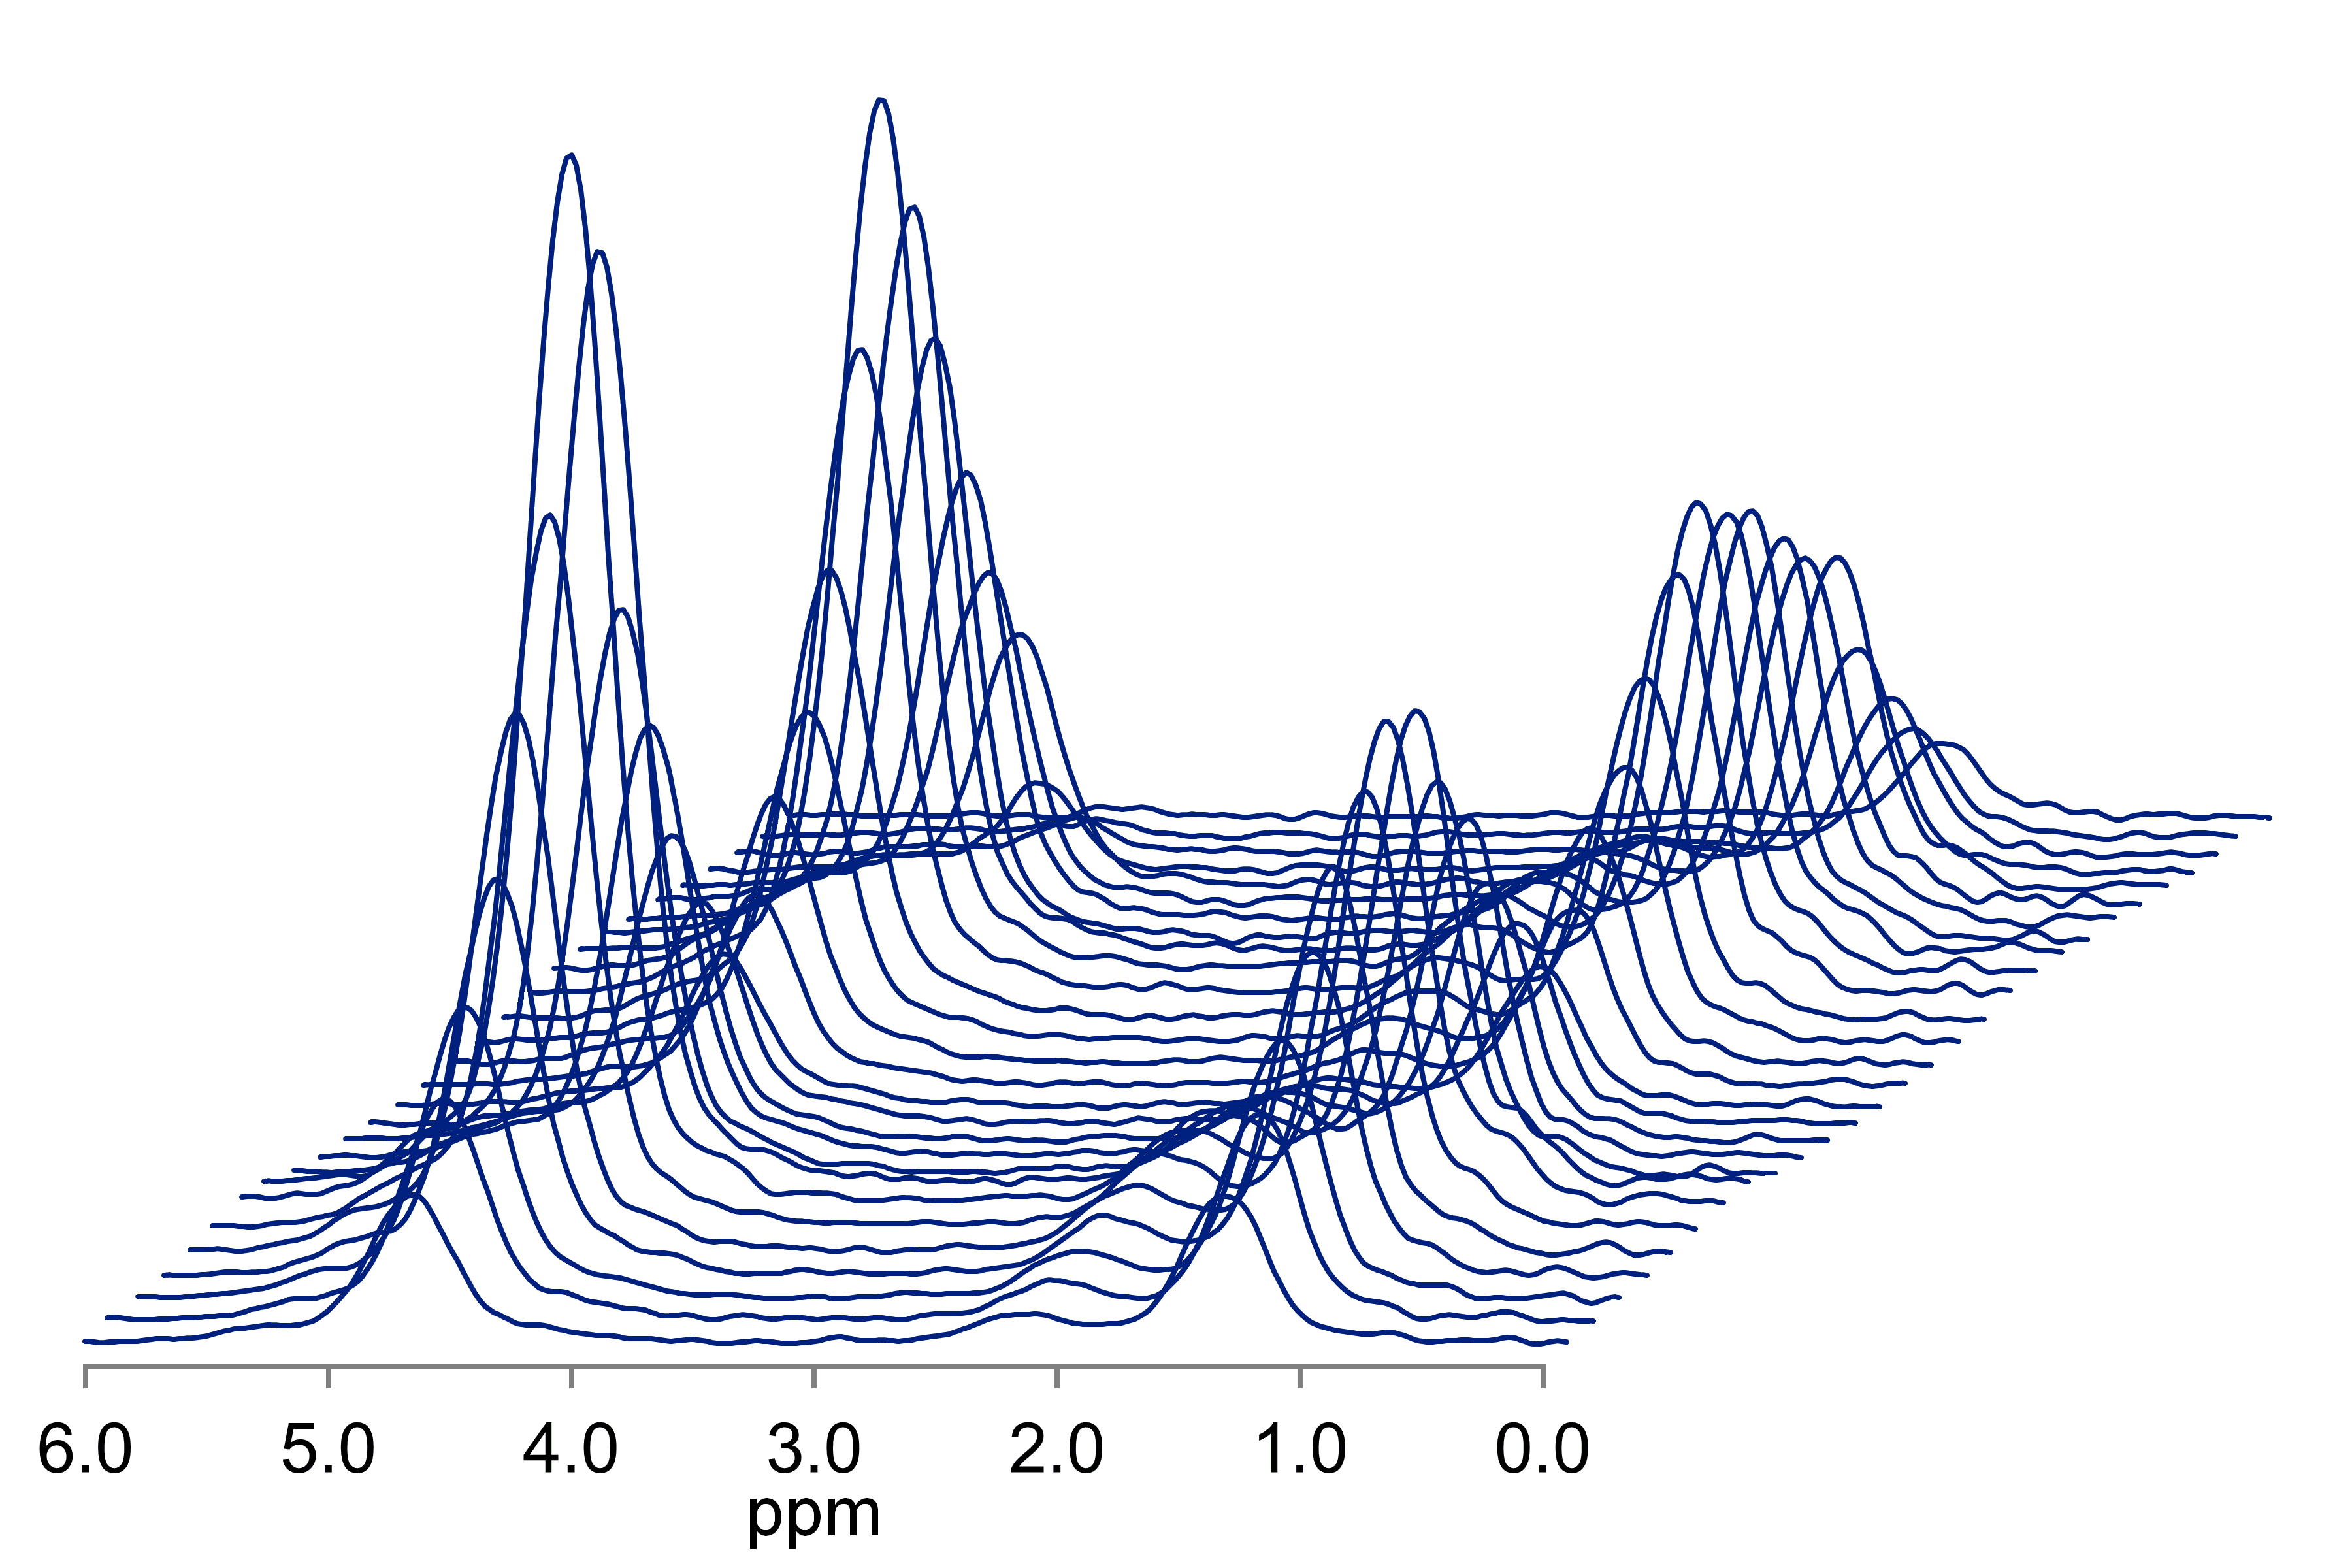
If we combine these approaches, it is possible to estimate liver water and fat T1 and T2, and PDFF in vivo, all in a single breath-hold. One such approach acquires 32 spectra in 21 seconds over a TR range of 150-2000 ms and a TE range of 10-110 ms (Figure 3) (19). The TR range is selected to allow estimation of water and fat T1 which are approximately 350 and 850 ms at 3T, while still acquiring data in a single breath-hold. Similarly, the TE range was chosen to allow estimation of water T2 (~23 ms at 3T) and fat T2 (~65 ms at 3T). Thus, in a similar acquisition time as a long-TR, multi-TE sequence, PDFF, water T1 and T2, and fat T1 and T2 can be estimated. The T1 estimated by MRI imaging is tissue T1, which will be dependent on the amount of fat. By independently estimating the T1 of water and fat, MRS allows estimates of water T1 independent of fat.
Acknowledgements
I would like to thank the members of the Dr. Claude Sirlin's Liver Imaging Group at UCSD, without whom none of my research would be possible. I would particularly like to thank Alexandra Schlein for feedback in preparing this syllabus.References
1) Hamilton G, Yokoo T, Bydder M, et al. In vivo characterization of the liver fat 1H MR spectrum. NMR Biomed. 2011; 24: 784-790
2) Oostendorp M, Engelke UF, Willemsen MA, Wevers RA. Diagnosing Inborn Errors of Lipid Metabolism with Proton Nuclear Magnetic Resonance Spectroscopy. Clin Chem 2006: 52: 1395-1405
3) Hamilton G, Middleton MS, Bydder M, et al. The Effect of PRESS and STEAM Sequences on Magnetic Resonance Spectroscopic Liver Fat Quantification. J Magn Reson Imaging 2009;30:145-152
4) Bottomley, PA. Spatial localization in NMR spectroscopy in vivo. Ann NY Acad Sci 1987: 508: 333-348
5) Granot J. Selected volume excitation using stimulated echoes (VEST): applications to spatially localized spectroscopy and imaging. J Magn Reson 1986: 70: 488-492
6) Frahm J, Merboldt K-D, Hänicke W. Localized proton spectroscopy using stimulated echoes. J Magn Reson 1987: 72: 502-508
7) Keevil SF. Spatial localization in nuclear magnetic resonance spectroscopy. Phys Med Biol 2006: 51: R579-R636
8) Reeder SB, Hu HH, Sirlin CB. Proton density fat-fraction: a standardized MR-based biomarker of tissue fat concentration. J Magn Reson Imaging 2012; 36:1011-1014
9) Reeder SB, Cruite I, Hamilton G, Sirlin CB. Quantitative assessment of liver fat with magnetic resonance imaging and spectroscopy. J Magn Reson Imaging 2011; 34:729-749
10) Szczepaniak LS, Nurenberg P, Leonard D, et al. Magnetic resonance spectroscopy to measure hepatic triglyceride content: prevalence of hepatic steatosis in the general population. Am J Physiol Endocrinol Metab 2005: 288: E462-E468.10
11) Thomsen C, Becker U, Winkler K, Christoffersen P, Jensen M, Henriksen O. Quantification of liver fat using magnetic resonance spectroscopy. Magn Reson Imaging 1994;12:487-495
12) Longo R, Pollesello P, Ricci C, et al. Proton MR spectroscopy in quantitative in vivo determination of fat content in human liver steatosis. J Magn Reson Imaging 1995;5:281-285
13) Pineda N, Sharma P, Xu Q, Hu X, Vos M, Martin DR. Measurement of hepatic lipid: high-speed T2-corrected multiecho acquisition at 1H MR spectroscopy-a rapid and accurate technique. Radiology. 2009;252:568-576
14) Yokoo T, Shiehmorteza M, Hamilton G, et al. Estimation of hepatic proton-density fat fraction by using MR imaging at 3.0 T. Radiology 2011; 258: 749-759
15) De Graff RA, Rothman DL. In Vivo Detection and Quantification of Scalar Coupled 1H NMR Resonances. Concepts in Magnetic Resonance 2001: 13: 32-76
16) Ren J, Dimitrov I, Sherry AD, Malloy CR. Composition of adipose tissue and marrow fat in humans by 1H NMR at 7 Tesla. J Lipid Res 2008;49:2055-2062
17) Hamilton G, Smith DL, Bydder M, Nayak KS, Hu HH. MR properties of brown and white adipose tissues. Journal of magnetic resonance imaging : JMRI 2011;34:468-473
18) Hamilton G, Schlein AN, Middleton MS, et al. In vivo triglyceride composition of abdominal adipose tissue measured by 1H MRS at 3T. J Magn Reson Imaging 2016 doi: 10.1002/jmri.25453. [Epub ahead of print]
19) Hamilton G, Middleton MS, Hooker JC, et al. In vivo breath-hold 1H MRS simultaneous estimation of liver proton density fat fraction, and T1 and T2 of water and fat, with a multi-TR, multi-TE sequence. J Magn Reson Imaging 2015; 42: 1538-1543
Figures