Diffusion & Perfusion Weighted Imaging
1Lucas Center for Imaging, Department of Radiology, Stanford University, Stanford, CA, United States
Synopsis
This lecture is devoted to the basic technological aspects of diffusion-weighted imaging (DWI) and perfusion-weighted imaging (PWI), using neuroimaging applications as examples, and with the concepts explained with minimal use of equations.
Background
Diffusion-weighted imaging (DWI) [1-6] is one of the most important contrast mechanisms in MRI. It has revolutionized the detection of pathologic conditions physiologic mechanisms sensitive for diffusion abnormality, such as in stroke, seizure, trauma, demyelination, tumors, infection, and others. PWI is an MRI technology that studies cerebral hemodynamics and blood flow [7-8]. PWI provides information on hypoperfused areas of brain tissue, and is used in the evaluation of focal brain lesions, primary tumors, in the differentiation of tumor recurrence and radionecrosis, and others. PWI is often combined with other MR techniques like magnetic resonance angiography (MRA) to assess vessel patency, and DWI to identify areas of reversible ischemia early before it progresses to permanent infarction [9-11].Methods
Diffusion-weighted imaging
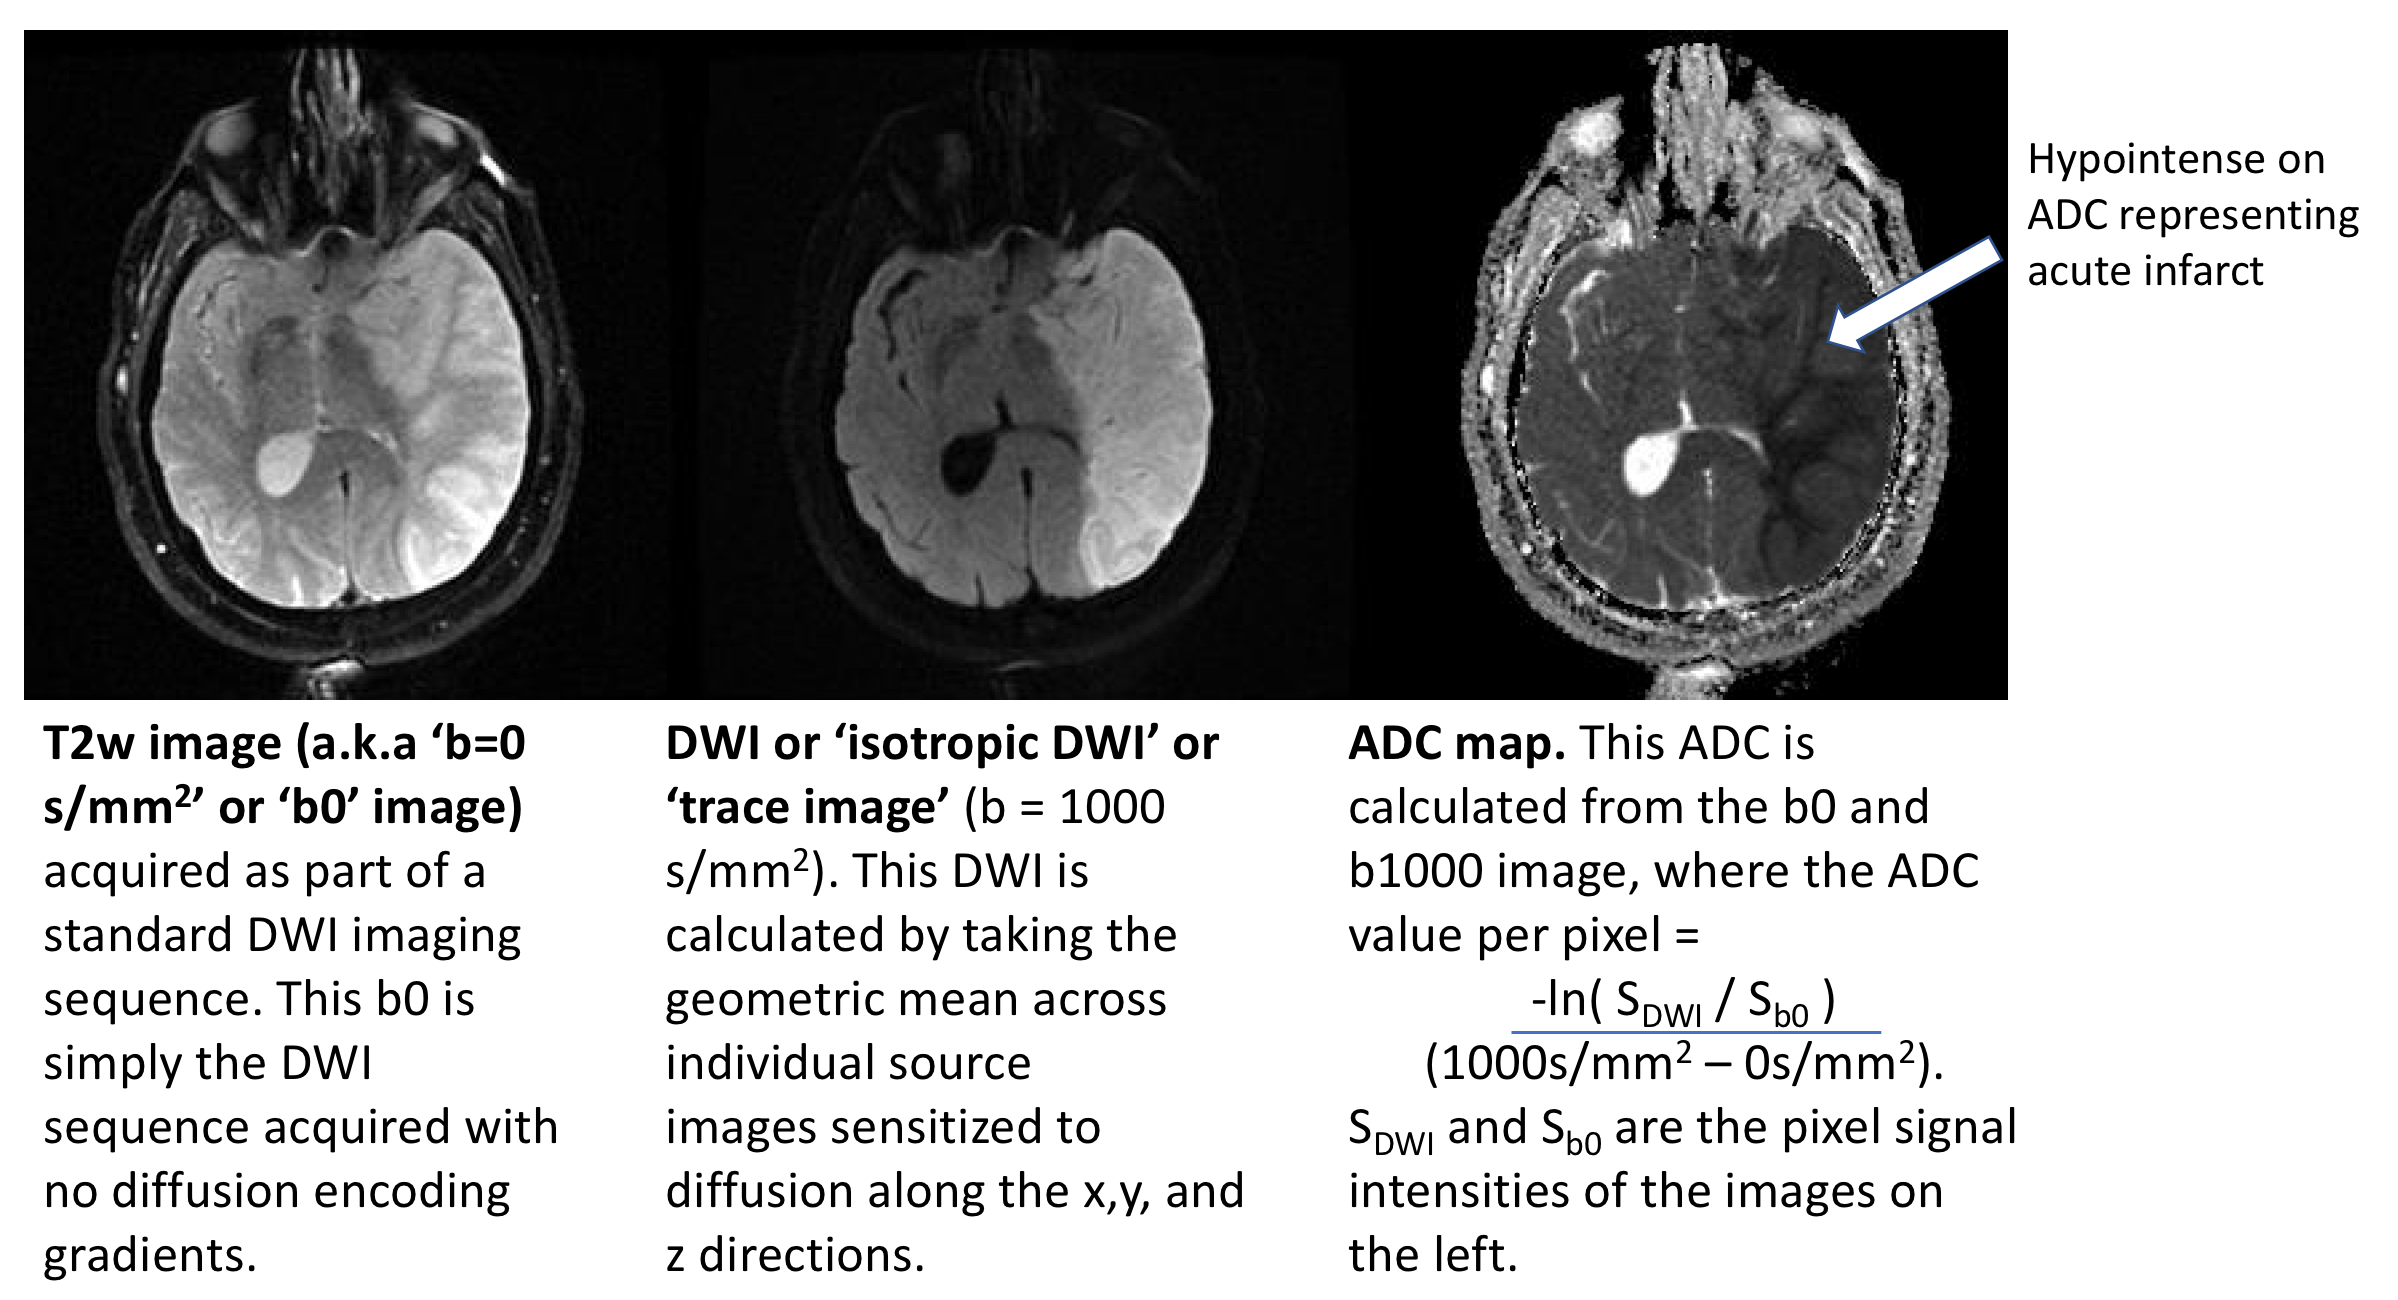
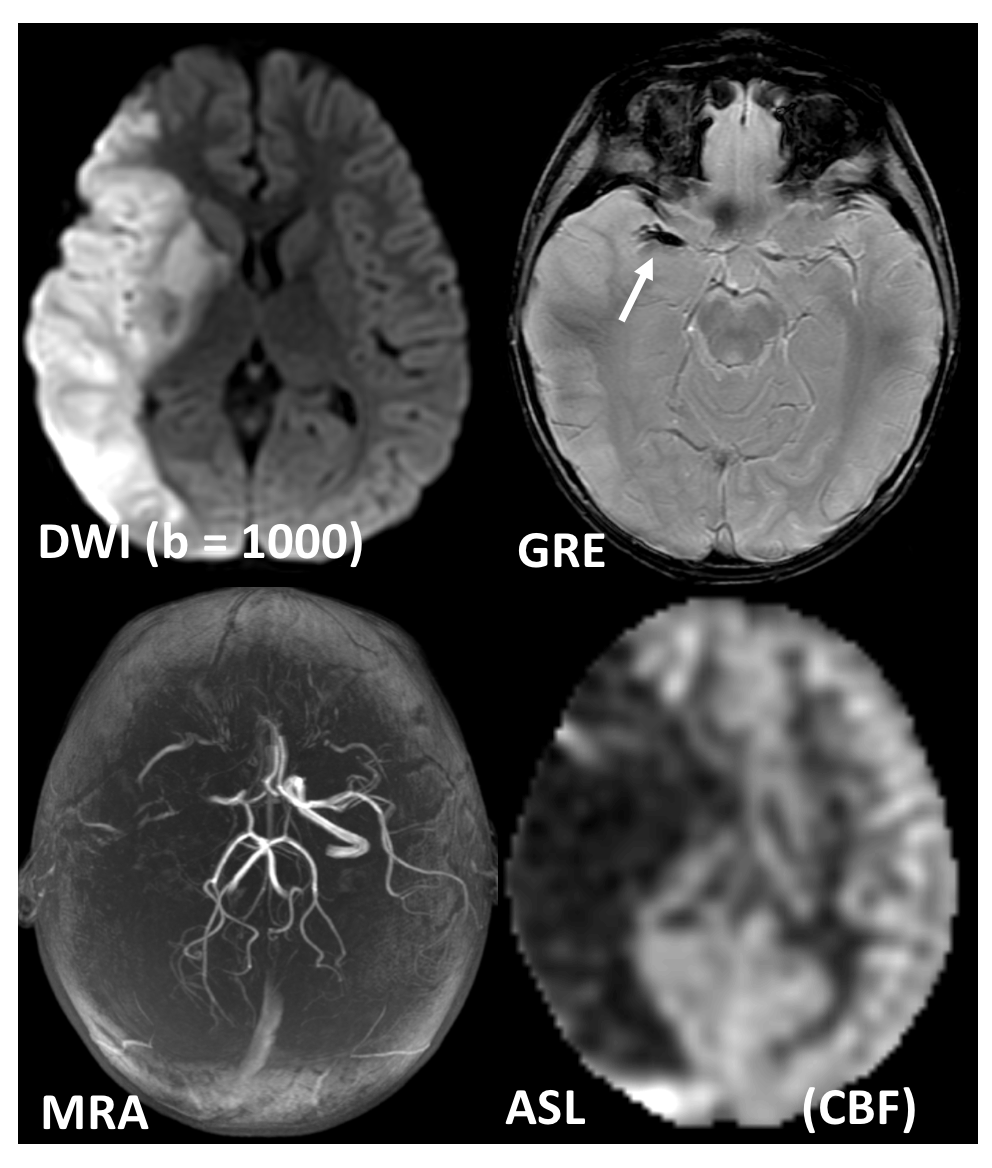
DWI uses the diffusion of water molecules to generate contrast in MR images. Due to the presence of cell membranes, macromolecules, fibers and other obstacles, the water molecules tend to be confined and hindered in their normal free diffusion. Water molecule diffusion patterns can therefore reveal microscopic details about tissue architecture, characterize different tissue types or pathological processes. DWI allows one to take ‘snapshots’ of this tissue water motion on a time scale of a few tens of milliseconds, using strong ‘diffusion encoding’ magnetic field gradients. On a DWI image, the grayscale pixel value is dependent on the underlying diffusivity, where voxels with high diffusion appear hypointense (e.g. CSF) and voxels with low diffusion appear hyperintense (e.g. acute stroke, Fig 1).
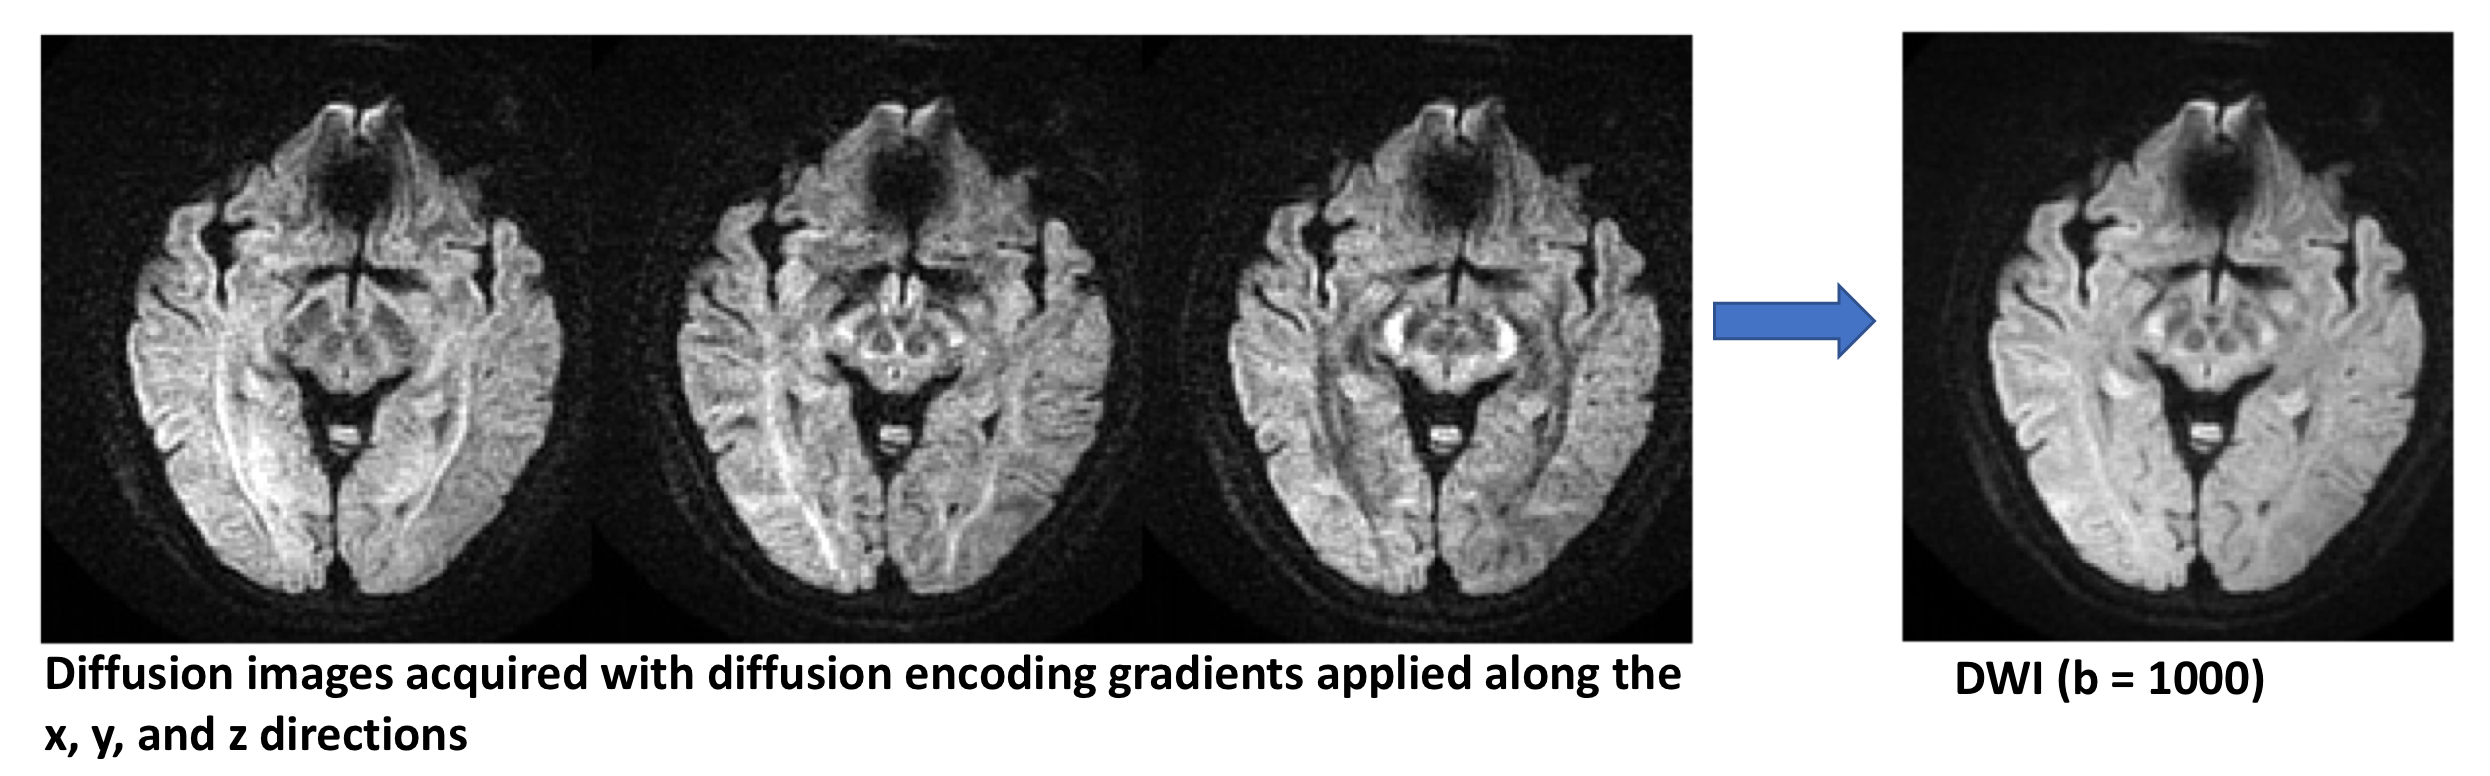
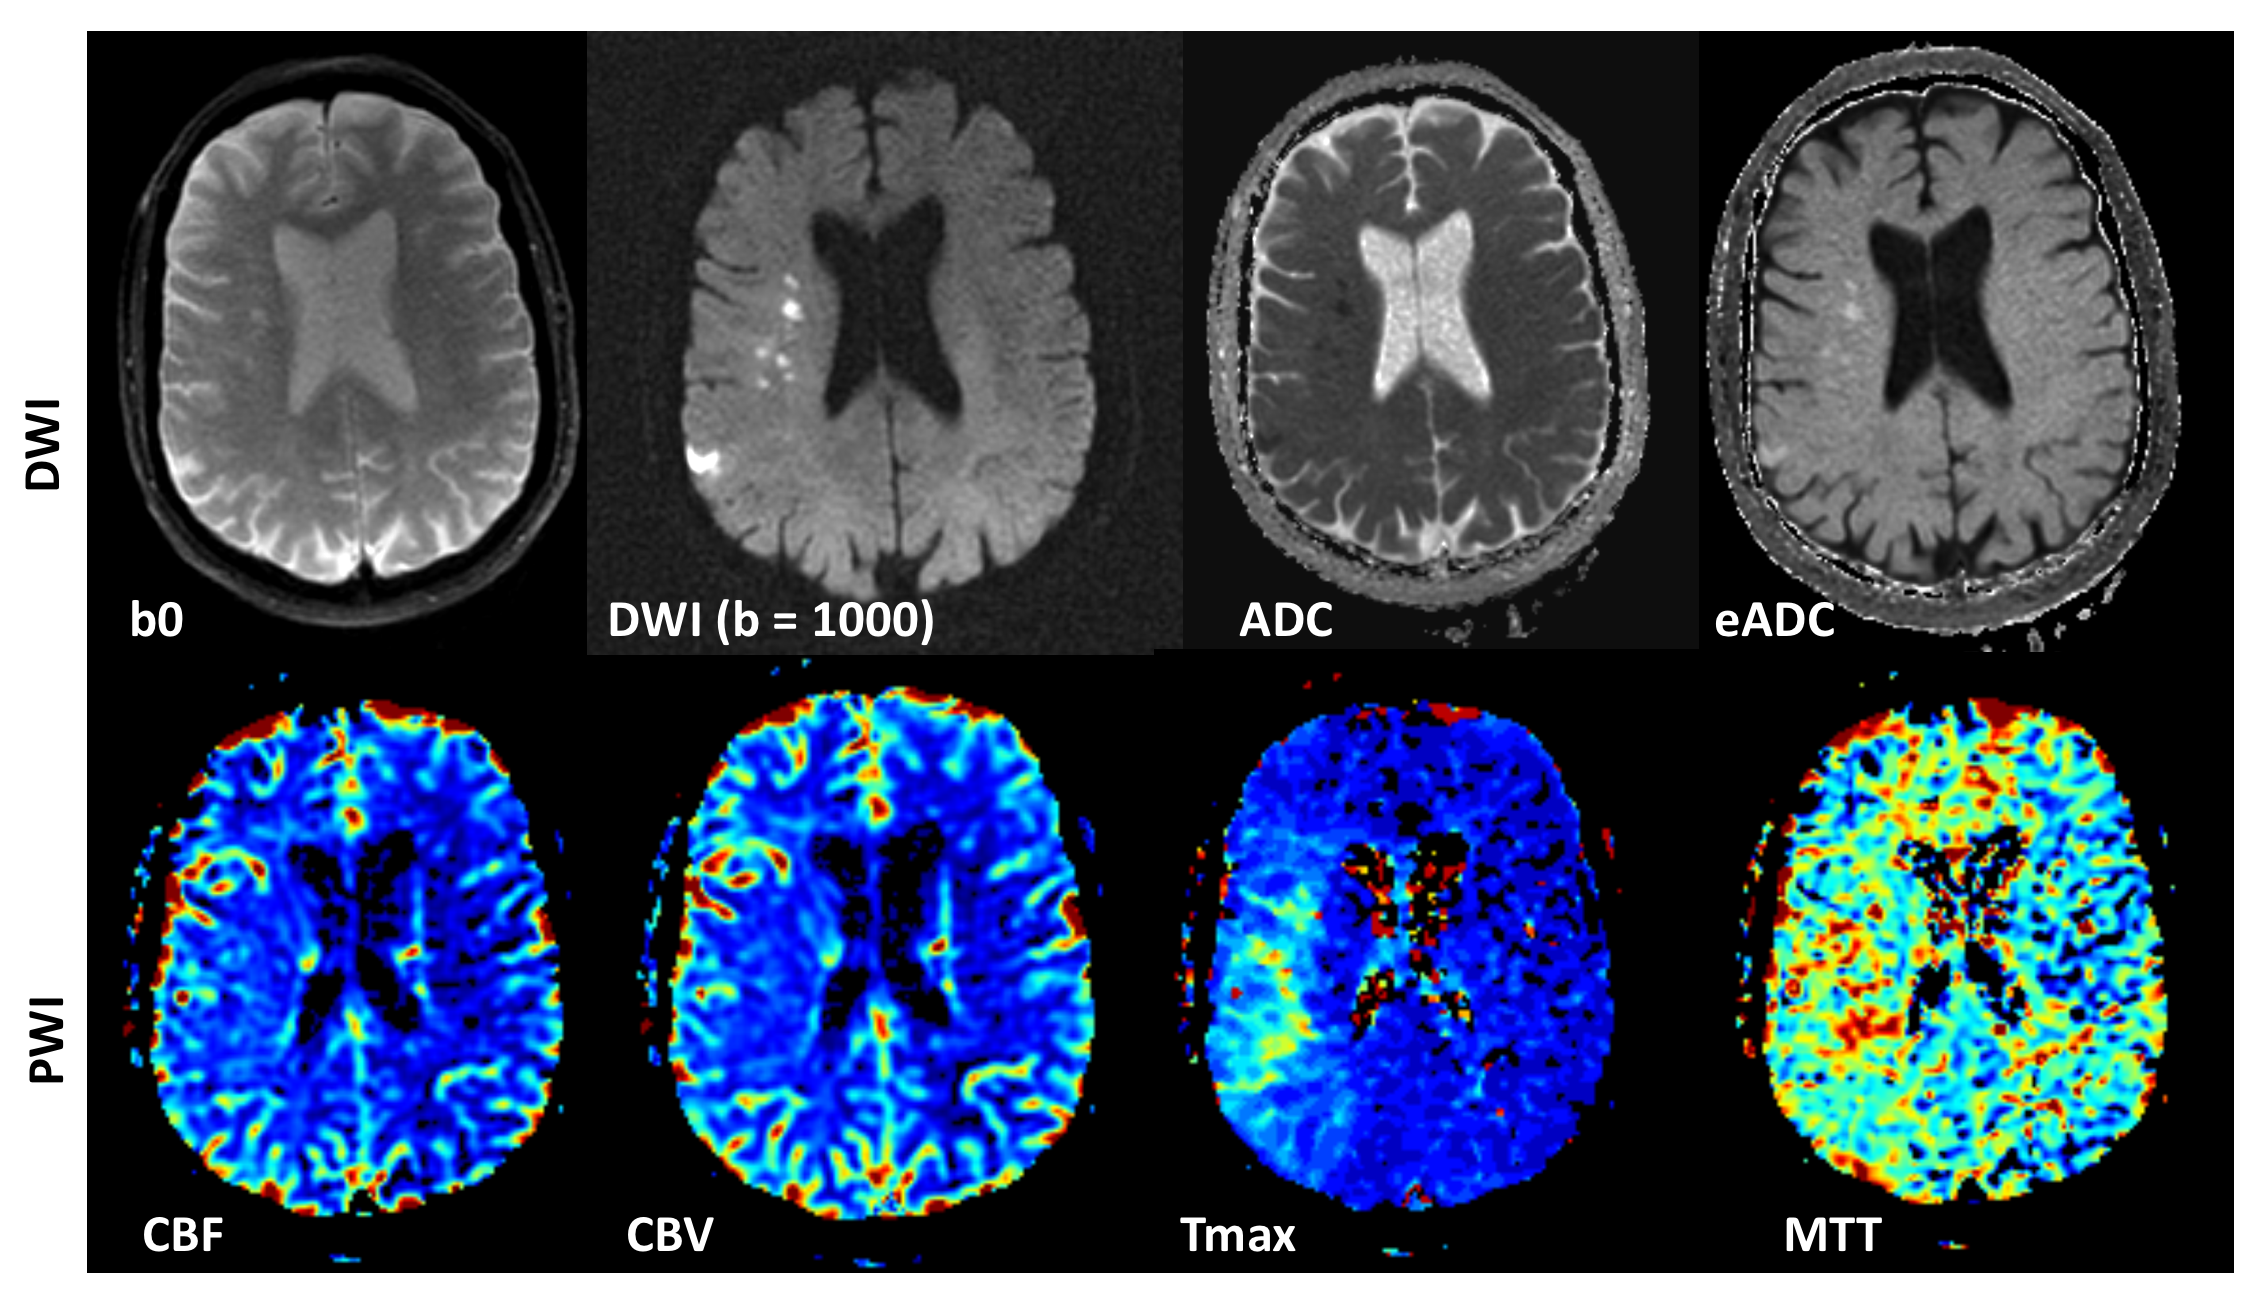
A DWI imaging acquisition is typically achieved with the Stejskal and Tanner method, where the strength of the diffusion encoding is represented by the ‘b-value’ [1]. A typical brain DWI sequence comprises of the acquisition of one ‘b = 0’ or T2-weighted image, followed by 3 or more diffusion-weighted ‘source’ images acquired at a b-value of 1000 (Fig. 2). These individual source images are usually combined by into a single final set for diagnosis by taking the geometric mean across these images. The combined image is known by various names: diffusion-weighted images, isotropic images, or trace images. On both the b = 0 and b = 1000 images, the contrast not only depends upon the spatially distributed diffusion coefficient of the acquired tissues, but also depends on the T2 (and sometimes T1) values. Because of this, the apparent diffusion coefficient or ADC is often calculated (based off the -logarithm ratio of b1000/b0), which helps to differentiate T2 shine through (or T1) effects and other artifacts from real diffusion lesions (Fig. 1). Sometimes the exponential ADC (or eADC [12]) is calculated which is simply based on the ratio of b1000/b0 and results in an opposite contrast (i.e. an acute infarct is seen as a hypointense on ADC and as hyperintense on eADC (Fig. 4)).
Perfusion-weighted imaging
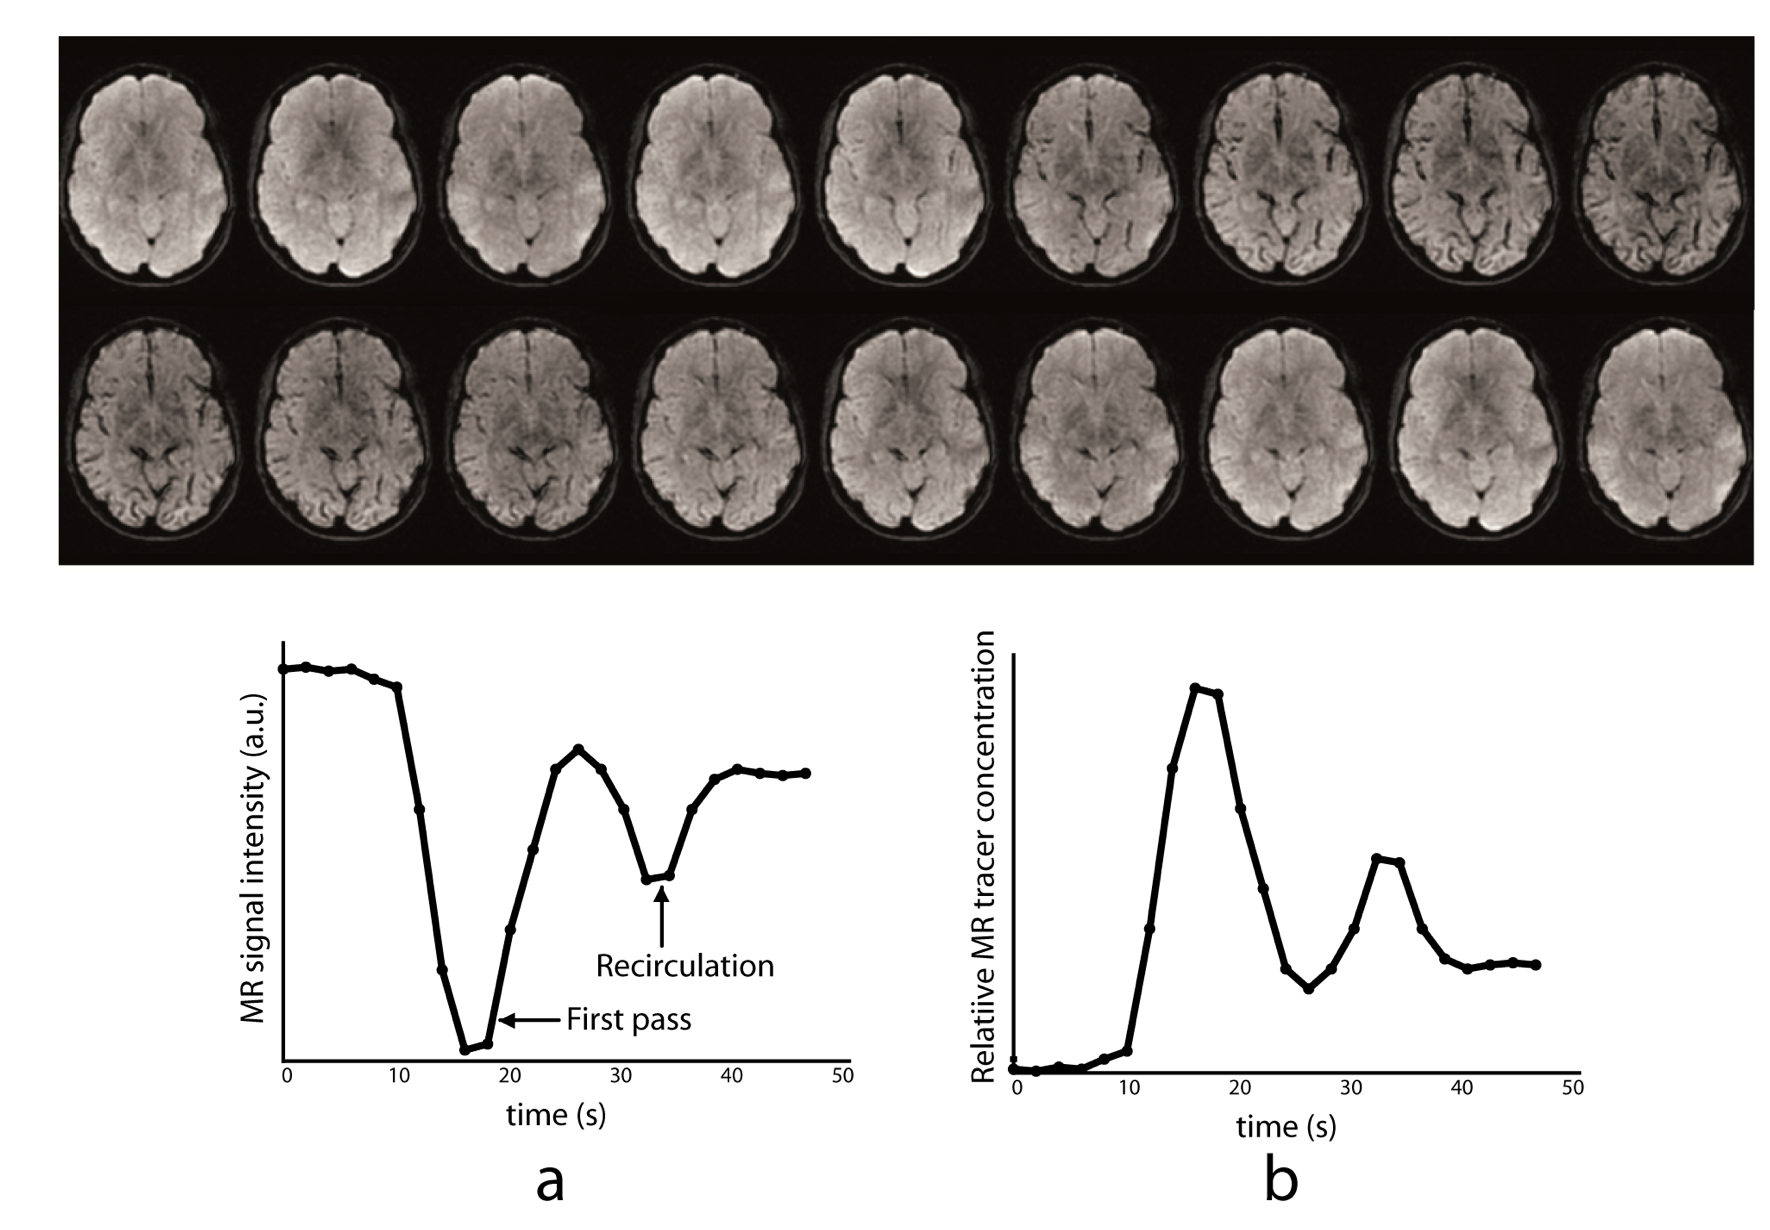
The two most common PWI techniques comprise an exogenous method called dynamic susceptibility contrast imaging by injection of MR contrast (DSC-MRI) [7-8], and an endogenous (and non-invasive) method called arterial spin labelling (ASL) [13-17]. In DSC-MRI, a Gadolinium contrast agent is injected and a time series of fast T2*-weighted (or spin-echo) images is acquired during the first pass through the cerebral circulation. As Gadolinium passes through the tissues, it produces a reduction of T2* intensity depending on the local concentration (Fig. 3). Hemodynamic maps of cerebral blood flow (CBF), cerebral blood volume (CBV) and mean transit time (MTT) or time to bolus peak (TTP) can be created by mathematical analysis of the evolution of the intensity of the signal. Both PWI and DWI are rapidly have become integral parts of the diagnostic workup in the acute stroke setting (Fig. 4).
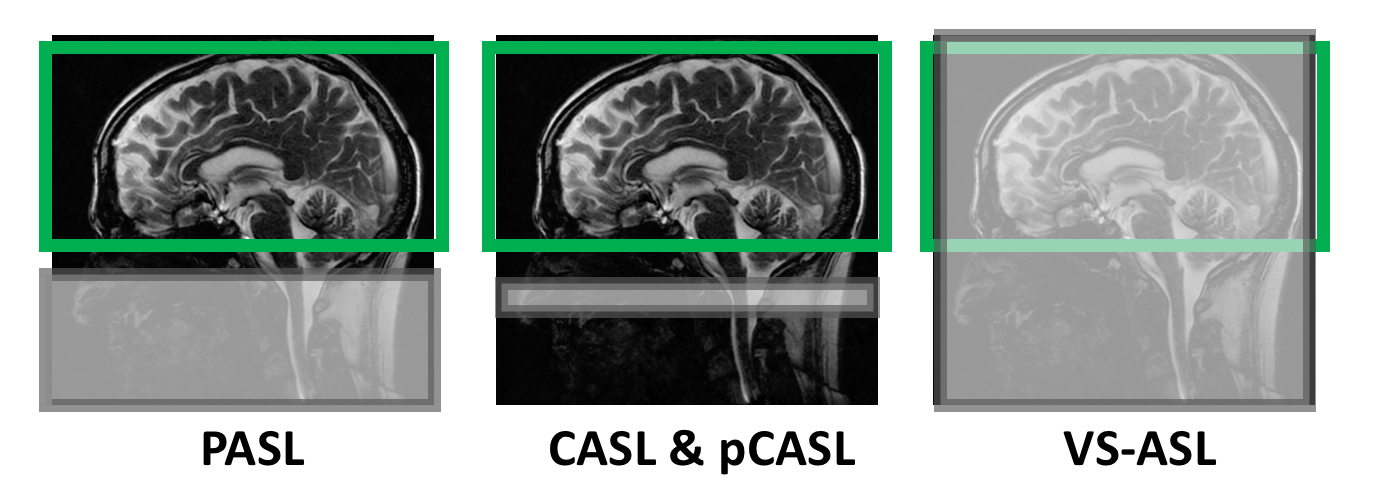
Arterial spin labeling (ASL) uses magnetically labeled arterial blood water protons as an endogenous diffusible tracer to measure tissue blood flow [13-17]. Here, flowing spins in the carotid arteries are inverted by a radiofrequency pulse. The influx of fresh, labeled protons in the tissue of interest slightly alters the magnetization and, depending on the exchange with tissue protons (therefore the T1 relaxation time of the tissue), renders this method sensitive to the local degree of microperfusion. Hence, any change in regional blood flow will be picked up by ASL via image contrast changes. The four types of ASL preparation components are: pulsed ASL (PASL), continuous ASL (CASL), pseudo-continuous ASL (pCASL) and velocity-selective ASL (VS-ASL). The primary difference among these ASL categories is the technique that magnetically tags the inflowing blood (Fig. 5). In the past, despite being non-invasive, ASL methods have seen limited adoption clinically due to their complexity, susceptibility to motion, among other problems. However due to recent technical advances, ASL is increasingly becoming of increasing clinical interest, particularly to investigate perfusion abnormalities in cerebral stroke and patients with chronic vascular diseases (Fig. 6).
Acknowledgements
No acknowledgment found.References
[1] Le Bihan, D; E. Breton (1985). "Imagerie de diffusion in-vivo par résonance magnétique nucléaire". C R Acad Sci (Paris). 301 (15): 1109–1112.
[2] Merboldt, K; Hanicke, W; Frahm, J (1985). "Self-diffusion NMR imaging using stimulated echoes". Journal of Magnetic Resonance (1969). 64 (3): 479–486. JMagR..64..479M. doi:10.1016/0022-2364(85)90111-8.
[3] Taylor, D G; Bushell, M C (1985). "The spatial mapping of translational diffusion coefficients by the NMR imaging technique". Physics in Medicine and Biology. 30 (4): 345–349.
[4] Moseley ME, Kucharczyk J, Mintorovitch J, Cohen Y, Kurhanewicz J, Derugin N, Asgari H, Norman D. Diffusion-weighted mr imaging of acute stroke: Correlation with t2-weighted and magnetic susceptibility-enhanced mr imaging in cats. AJNR Am J Neuroradiol. 1990;11:423-429.
[5] Lansberg MG, Norbash AM, Marks MP, Tong DC, Moseley ME, Albers GW. Advantages of adding diffusion-weighted magnetic resonance imaging to conventional magnetic resonance imaging for evaluating acute stroke. Arch Neurol. 2000;57:1311-1316.
[6] Warach S, Gaa J, Siewert B, Wielopolski P, Edelman RR. Acute human stroke studied by whole brain echo planar diffusion- weighted magnetic resonance imaging. Ann Neurol. 1995;37:231–241.
[7] Baird AE, Warach S. Magnetic resonance imaging of acute stroke. J Cereb Blood Flow Metab. 1998;18:583-609
[8] Calamante F, Thomas DL, Pell GS, Wiersma J, Turner R. Measuring cerebral blood flow using magnetic resonance imaging techniques. J Cereb Blood Flow Metab. 1999;19:701-735.
[9] Hossmann K-A, Hoehn-Berlage M. Diffusion and perfusion MR imaging of cerebral ischemia. Cerebrovasc Brain Metab Rev. 1995;7:187–217.
[10] Sorensen AG, Buonanno FS, Gonzalez RG, Schwamm LH, Lev MH, Huang-Hellinger FR, Reese TG, Weisskoff RM, Davis TL, Suwanwela N, Can U, Moreira JA, Copen WA, Look RB, Finklestein SP, Rosen BR, Koroshetz WJ. Hyperacute stroke: evaluation with combined multisection diffusion- weighted and hemodynamically weighted echo-planar MR imaging. Radiology. 1996;199:391–401.
[11] Warach S, Dashe JF, Edelman RR. Clinical outcome in ischemic stroke predicted by early diffusion- weighted and perfusion magnetic resonance imaging: a preliminary analysis. J Cereb Blood Flow Metab. 1996;16:53–59.
[12] JM Provenzale, E Engelter, JPetrella, JS Smith, JA MacFall. Use of MR Exponential Diffusion-Weighted Images to Eradicate T2 “Shine-Through” Effect, AJR, 1999; 172:537-539 (1999)
[13] Detre JA, Leigh JS, Williams DS, Koretsky AP. Perfusion imaging. Magn Reson Med 1992;23(1):37-45
[14] Detre JA, Zhang W, Roberts DA, et al. Tissue specific perfusion imaging using arterial spin labeling. NMR Biomed 1994;7(1-2):75-82
[15] Williams DS, Detre JA, Leigh JS, Koretsky AP. Magnetic resonance imaging of perfusion using spin inversion of arterial water. Proc Natl Acad Sci U S A 1992;89(1):212-216
[16] Deibler AR, Pollock JM, Kraft RA, Tan H, Burdette JH, Maldjian JA. Arterial spin-labeling in routine clinical practice, part 1: technique and artifacts. AJNR Am J Neuroradiol. 2008;29:1228–1234.
[17] Wolf RL, Detre JA. Clinical neuroimaging using arterial spin-labeled perfusion magnetic resonance imaging. Neurotherapeutics. 2007;4:346–359.
Figures