Future of MR Systems & Applications - Ultra High Field
1Former Siemens Healthcare now Lakeside Imaging/e
Synopsis
Ultra-High Field MRI has developed from a plain research instrument for mastering the required technology to a clinically recognised MR imaging field strength. Besides stronger magnets, the entire RF transmit and receive chain needed to be updated to the higher MR frequencies. The mitigation of the transmit B1+ inhomogeneity by means of parallel transmission is now fully understood and utilized in almost every UHF site in some sort or another. Beside the significantly higher resolution achieved with UHF, unique contrast and imaging possibilities opened up: better susceptibility weighting, quantitative susceptibility mapping, CEST imaging and sodium imaging, aiming for better diagnosis in neuro degenerative diseases, tumour imaging, musculoskeletal imaging and much more. All these aspects of UHF imaging will be considered in this educational talk.
Abstract
Over the last two decades Ultra-High Field MRI has developed from a plain research instrument to mastering the required technology to become a clinically recognised MR imaging field strength. Besides stronger magnets, the entire RF transmit and receive chain needed to be updated to allow for the higher MR frequencies. Associated with it came the struggle to deal with and mitigate the transmit B1+ inhomogeneity by means of parallel transmission, which is now fully understood and utilized in almost every UHF site in some kind or another. Beside the significantly higher resolution achieved with UHF, unique contrast and imaging possibilities opened up, such as better susceptibility weighting, quantitative susceptibility mapping, CEST imaging and sodium imaging, aiming for better diagnosis in neuro degenerative diseases, tumour imaging, musculoskeletal imaging and much more. All these aspects of UHF imaging will be considered in this educational talk.General
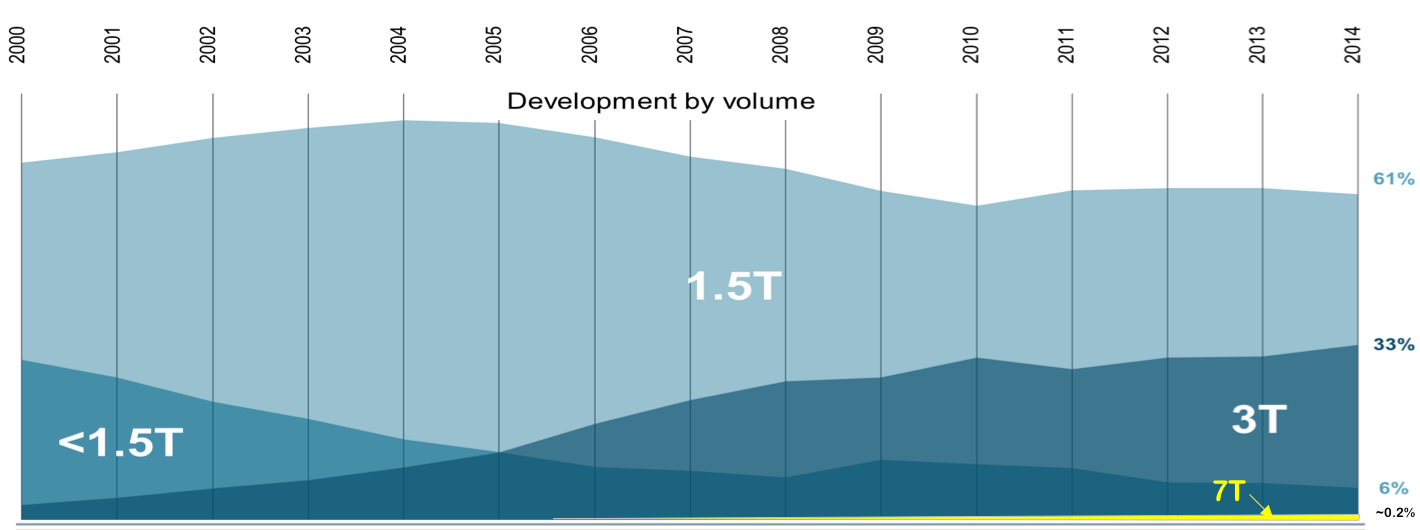
To strive for higher and higher magnetic fields is in the gene pool of MR development. In the mid 1970ties the early MRI systems utilized magnetic fields 0.01 T and lower. In the mid-eighties, when commercial MRI development started, the main field strength ranged from 0.35T - 1.5T, settling in at 1.5T as the field strength mostly used so far. That remained there until the end of the 1990ties. Then 3T started to take off and showed its potential first in neuro imaging in particular fMRI. This MRI field strength matured in the first decade of 2000 and is now a very important MRI field strength with a strong focus in neuro, spine and MSK imaging. All other body part can be imaged also, but some, such as abdominal, MR breast and cardiac imaging, remain mostly at 1.5T. Although the first Ultra High Field (UHF) system had a field strength of 8 Tesla (Ohio State University, Columbus Ohio installed in 1998) later the community settled to 7T (/37/) with CMRR’s first 7T system (University of Minnesota, Minneapolis) in 2000 and remains a strong hold since then. About 60 such human 7T systems are currently running world-wide, with the trend to increase over time and getting frecognized as a tool for clinical and research applications (/44/). A few of these systems (three in total) are head-only systems, however, the vast majority are whole body systems. Figure 1 shows the distribution of MRI field strength from the year 2000 until 2014, indicating that 1.5T stays flat, 3T is increasing and 7T is very small in number of sold units but receiving increased recognition in the field.
Already in the early 2004 the first 9.4T magnet was installed at CMRR, followed by 4 more magnets of that field strength until now. A 10.5T system is operating now since 2013 at CMRR in Minneapolis and produces images of large animals. Human permission is still pending but expected to arrive soon. Eventually higher field strength project evolved with two 11.7T head magnet systems (NIH Bethesda and Seoul, Korea) and one whole body system (Neurospin in Saclay, France). All of them are planned to be installed by end of 2017 or 2018.
In 2016 two independent extreme Ultra-High Field (xUHF) human MRI projects have been initiated aiming for 20 Tesla with an intermediate step at 14 T before reaching out to 20T (/38-40/). Quite impressively over 30 years of serious MRI development the field strength has increased by 4 orders of magnitude. After the FDA in 2008 and the IEC in 2014 classified up to 8T as nonsignificant risk, it is now obvious that 7T will become the first clinically approved UHF system field strength.
Technical challenges
Besides the stronger magnet (which is not part of my considerations here; see also /1/), the move from 3T to 7T involves some serious HW reengineering especially on the RF chain and RF coils. First of all, the MR (Larmor) frequency increases from 128MHz to 300 MHz. That involves a new RF transmit high power chain, including powerful RF Amplifiers. While in conventional MRI at 1.5T and 3T the RF power level is at 10 /35 kW, respectively, at 7T it has reached 8 kW only with a move toward 16 kW for head and joint imaging. However, general body imaging would require significantly more power of about 32 or 64 kW. It has become clear that higher power is desired but at current time not yet easily affordable. The increasing 7T market may change that.
The receive signal chain has to be modified to accept the new 1H MR Frequency and the X-Nuclei MR frequencies (Table 1 shows all relevant nucleus MR frequencies ranging from 7T to 20T). New RF coils need to be designed and build to match that new frequency range (/2/).
Due to dielectric effects B1 homogeneity is no longer ideal, as it is very subject dependent (/3-5/). This is because RF eddy currents in human tissue (having varying dielectric properties and anatomy) are resulting in variations of B1+ in tissue.
In order to correct for it a new concept of parallel/simultaneous RF transmission (pTx) (/ 6-10/) has been introduced (See figure 3 for the general topology). In principle, what has been used for RF transmit in the lower fields, i.e. 1 channel transmit at 1.5T and 2 channel transmit at 3T, is now extended to 8 or more transmit channel (with a clear trend to go higher in channel number, /11-12, 41, 42/) to allow B1 shimming or other higher sophisticated excitation schemes. With it comes the need to supervise and monitor the local SAR (/13-15, 45/) the human subject is exposed to, which was not necessary for the lower MR fields. These technical hurdles are more or less solved now and UHF MRI can achieve similar homogenous B1 distribution as 1.5T and 3T gets. RF coils therefore have to consider multiple transmit channels (typical for 7T is 8 channel, some sites have 16 channel TX. On the receive side 32 RX channels (/43/) are now common for head coils and 28 channels for knee coil for example (similar to lower fields), more RF receive channel will be coming also as UHF utilizes these pRX techniques better than lower fields.
Potential Clinical application at 7T
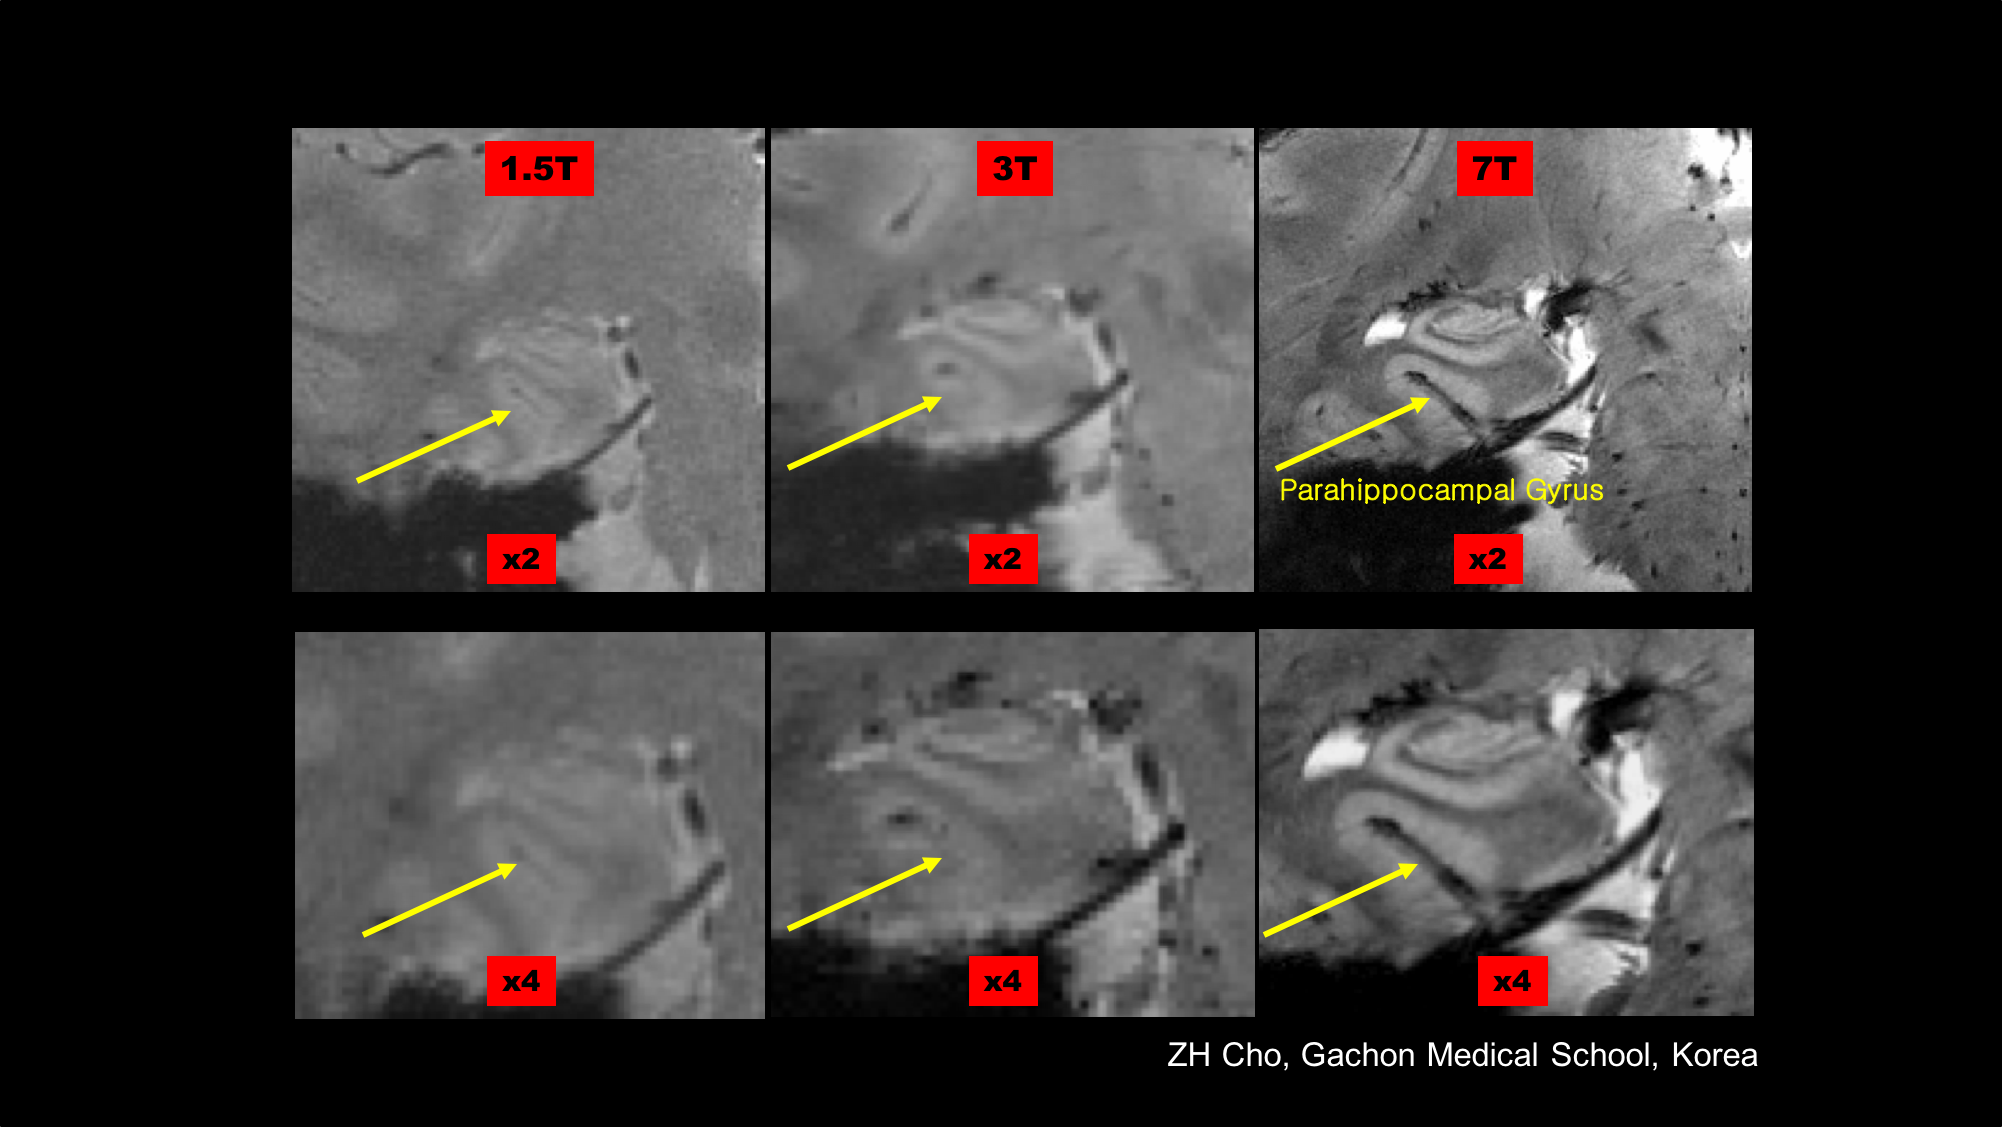
It has been obvious from the beginning, that 7T allows higher resolution imaging due to the increased SNR (/34/). Up until the early days of 7T imaging the general believe was that SNR increases linearly with B0. In 2015 it was reported that SNR increases supra linear with B0 (/16/, see also Figure 2)). This increased resolution is utilized to perform morphometric measurements in the Hippocampus to explore effects of Alzheimer Disease (AD) inpatients (/46/, /48/).
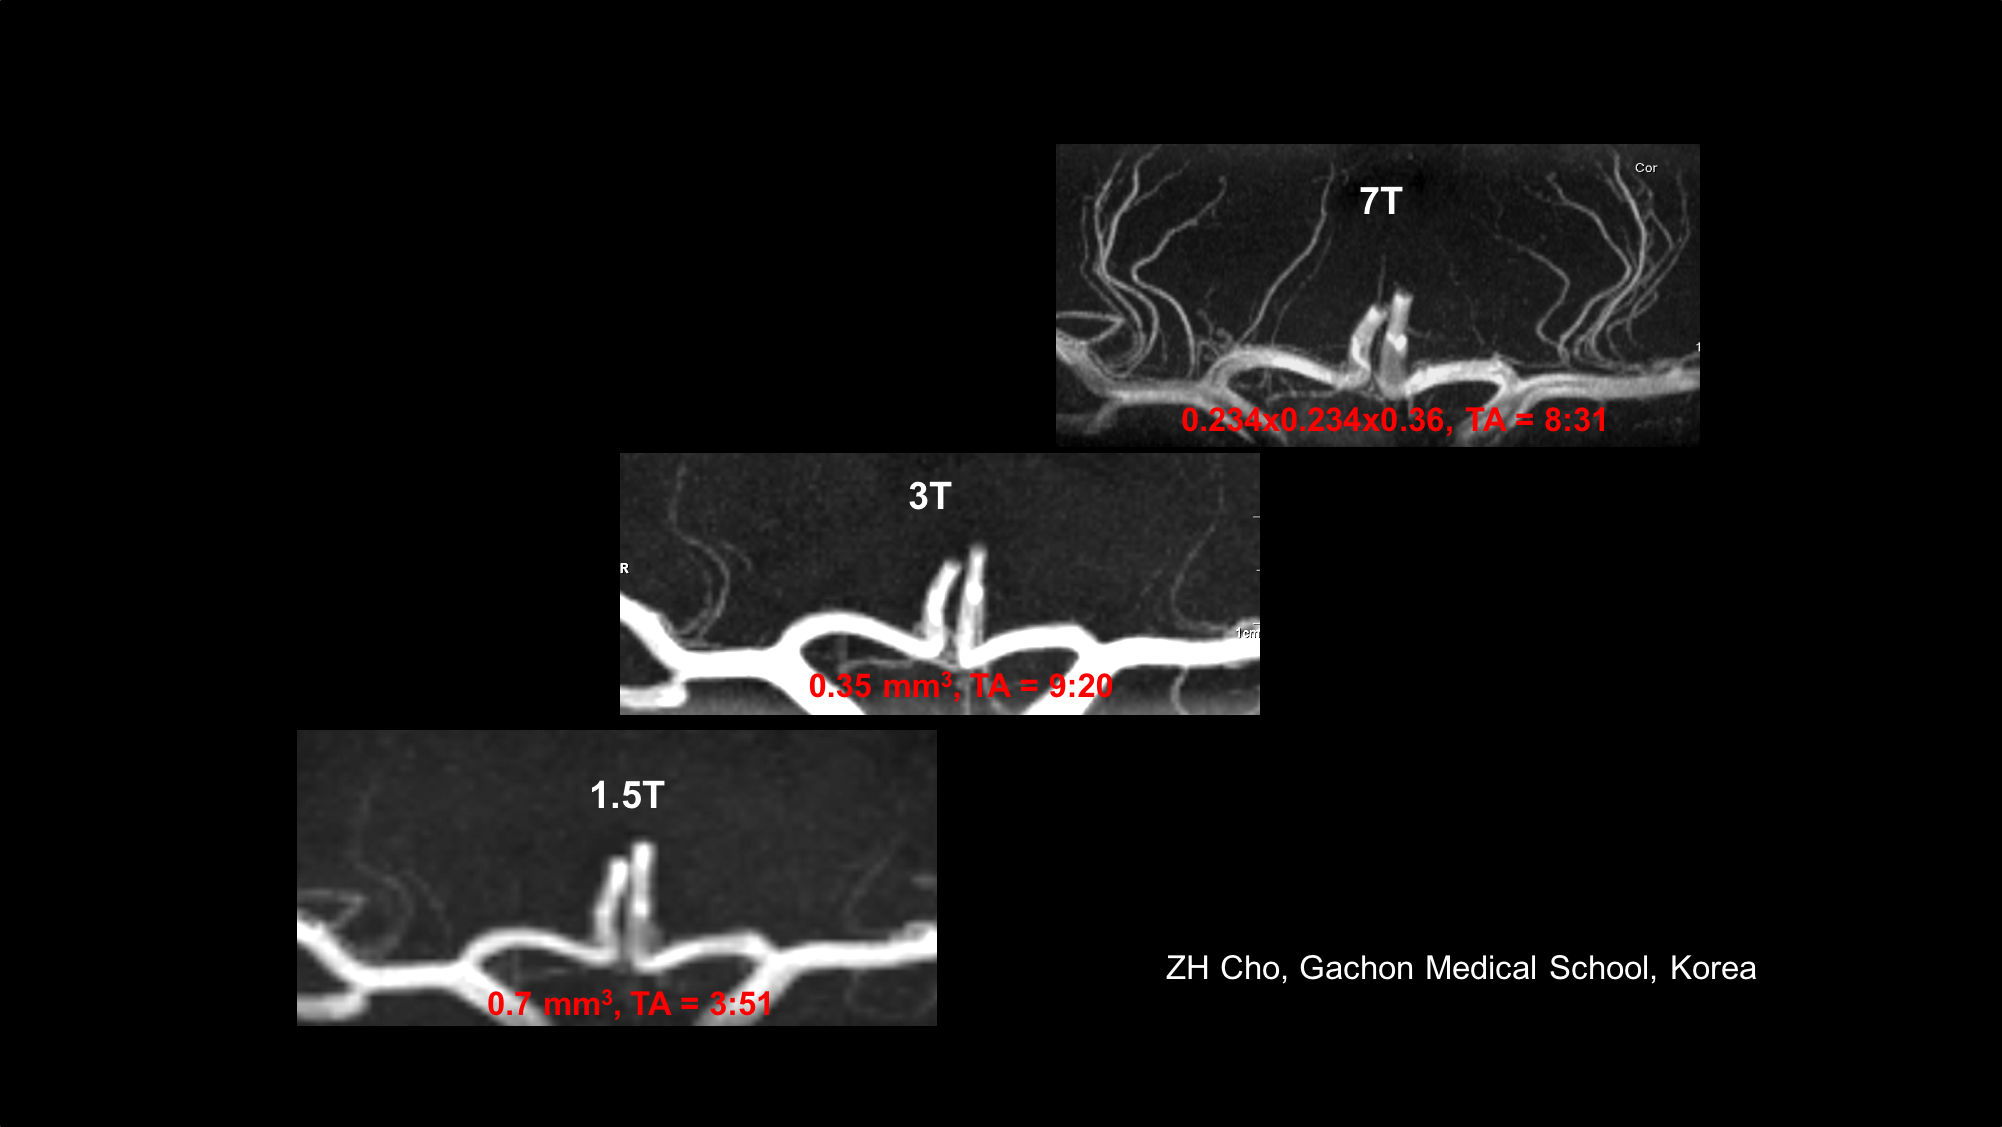
Particularly for MR Angiography where the prolonged T1 relaxation time (/17/) and hence the better background noise suppression allowes to view vasculature with MR of before unseen resolution (/ 18-19 /,/47/). An example is shown in Figure 4 A showing fine vessel in the lenticular striate vasculature feeding the basal ganglia.
Also, it became clear that the increased susceptibility contrast at 7T (and higher) is creating new contrast images, unseen at lower fields, as the susceptibility effect scales linearly with B0. In principle possible at lower fields too, It opens up new ways for the diagnosis of Multiple Sclerosis, MS, Parkinson’s disease, PD, micro bleeds, etc (/50-52/). Disease progression using susceptibility weighted imaging in MS has been reported (/20/, /49/). When imaging PD patients the 7.0 T images clearly shows the cell groups of the Substantia Nigra and Red Nucleus and therefore the possible damage as a result of PD (/21/). Figure 4 B-C show comparison of 1.5T, 3T and 7T acquisitions of the hippocampus, vain vasculature and lenticulostriate arteries.
T2* related imaging at UHF also spurred the development of Quantitative Susceptibility Mapping, QSM, with the potential for using it in clinical and research applications ranging from iron distributions and metabolic consumption of oxygen to viewing white matter tracts (/22- 23/).
In MR Spectroscopy, besides SNR increase, the sensitivity is also increasing due to the linearly with Bo increasing line spread. In the same category falls Chemical Exchange Saturation Transfer (CEST) (/24-30/). The Z-spectrum can be acquired on a much better detailed basis. Every step above in fields brings its own improvement (see Figure 5, a comparison of Z-Spectrum at 3T, 7T and 9.4T). All these lines in the z-spectrum correspond to metabolic processes of some kind, therefore CEST would allow for metabolic weighted imaging, such as Glucose-CEST (/30/, /35/) which is vital to visualizing tumour metabolism and may add additional information to the well-established FDG PET scanning.
Beside 1H other nuclei can be detected in MR experiments and being utilized for imaging (besides MR spectroscopy). Due to the very week concentration and sensitivity the x-nuclei signal is many orders of magnitude smaller when compared to 1H. The “best” nuclei in this sense is 23Na which was already been imaged at 1.5T in mid-eighties but suffered serious noise. This changed with the move towards 7T and higher (see Figure 5: 23NA SNR comparison 1.5T, 3T, 7T). Reasonable image quality can be achieved in a still long but clinically acceptable scan time of about 20 minutes. However, 23Na provides additional information for research and clinical applications opening up a new use (/31/). For example, in cartilage imaging, tumour imaging and in imaging of diabetes and MS. In MS it has been shown that total Sodium concentration can reflect the state of physical inability (/32/). Other nuclei are also of interest, such as 39K, and have been imaged recently (/33/).
Conclusion
Ultra-High Field MRI has slowly developed into a potential clinical diagnostic tool. So far only brain and MSK imaging is feasible in clinical settings. Other body parts will follow when pTX is fully developed. Due to the increased SNR, higher resolution images are commonly achieved. Susceptibility contrast is the prominent new contrast at 7T and its QSM derivative is an important new tool to look deeper into iron distribution (ferritin) in the deep brain, deoxyhaemoglobin in the veins and blood degradation products (hemosiderin), to name just a few potential applications. CEST imaging is strongly benefitting from UHF and will make its way as metabolite weighted imaging, such as Glucose CEST for tumour diagnosis. Of the X-nuclei 23Na seems to be the best candidate for clinical applications, such as looking into diabetes. On the technical side pTX needs to develop better workflow in order to make it clinically useful. More coils need to be provided and eventually all RF coils will be used in PTX mode.Acknowledgements
No acknowledgement found.References
1. Warner R. Ultra-high field magnets for whole-body MRI Supercond. Sci. Technol. 29 (2016) 094006 (8pp).
2. Adriany G, Van de Moortele PF, Wiesinger F, et al. Transmit and receive transmission line arrays for 7 Tesla parallel imaging. Magn Reson Med 2005;53:434–445.
3. Kangarlu A, Baertlein BA, Lee R, Ibrahim T, Yang L, Abduljali AM, Robitaile P-M. Dielectric Resonance Phenomena in Ultra High Field MRI. JCAT 1999;23(6):821-831.
4. Van de Moortele PF, Akgun C, Adriany G, Moeller S, Ritter J, Collins CM, Smith MB, Vaughan JT, Ugurbil K. B(1) destructive interferences and spatial phase patterns at 7 T with a head transceiver array coil. Magn Reson Med 2005;54:1503–1518.
5. Collins CM, Smith MB. Signal-to-noise ratio and absorbed power as functions of main magnetic field strength, and definition of “90 degrees” RF pulse for the head in the birdcage coil. Magn Reson Med 2001;45:684–691.
6. Katscher U, Boernert P, Leussler C, van den Brink JS. Transmit SENSE. Magn Reson Med 2003;49:144–150.
7. Ullmann P, Junge S, Wick M, Seifert F, Ruhm W, Hennig J. Experimental analysis of parallel excitation using dedicated coil setups and simultaneous RF transmission on multiple channels. Magn Reson Med 2005;54:994–1001.
8. Setsompop K, Wald LL, Alagappan V, Gagoski B, Hebrank F, Fontius U, Schmitt F, Adalsteinsson E, L. Wald. Parallel RF transmission with eight channels at 3 Tesla. Magn Reson Med 2006;56:1163–1171.
9. Schmitter S, Wu X, Ugurbil K, Van de Moortele P-F. Design of parallel transmission radiofrequency pulses robust against respiration in cardiac MRI at 7 Tesla. Magn Reson Med 2015;74:1291–130.
10. Vincent Gras, Alexandre Vignaud, Alexis Amadon, Denis Le Bihan, and Nicolas Boulant. Universal Pulses: A New Concept for Calibration-Free Parallel Transmission. Magn Reson Med 2017;77:635–643.
11. Adriany G, Van de Moortele P-F, Ritter J, Moeller S, Auerbach EJ, Akgün C, Snyder CJ, Vaughan T, Ugurbil K. A geometrically adjustable 16-channel transmit/receive transmission line array for improved RF efficiency and parallel imaging performance at 7 Tesla. Magnetic Resonance in Medicine 2008; 59:590 –597.
12. Orzada S, Bitz A, Kraff O, Oehmigen M, Gratz M, Johst S, Voelker M, Rietsch S, Floeser M, Fiedlser T, Shooshtary S, Solbach K, Quich H, Ladd M. A 32-Channel Integrated Body Coil for 7 Tesla Whole-Body Imaging. Proceddings of ISMRM 2016, Abstract 0167.
13. Eichfelder G1, Gebhardt M. Local specific absorption rate control for parallel transmission by virtual observation points. Magn Reson Med. 2011 Nov;66(5).
14. Graesslin I, Homann H, Biederer S, Boernert P, Nehrke K, Vernickel P, Mens G, Harvey P, Katscher U. A specific absorption rate prediction concept for parallel transmission MR. MR. Magn Reson Med 2012;68: 1664–1674.
15. de Greef M, Ipek O, Raaijmakers AJE, Crezee J, van den Berg CAT. Specific absorption rate intersubject variability in 7T parallel transmit MRI of the head. Magn Reson Med 2013;69:1476–1485.
16. Pohmann R, Speck O, Scheffler K. Signal-to-Noise Ratio and MR Tissue Parameters in Human Brain Imaging at 3, 7, and 9.4 Tesla Using Current Receive Coil Arrays. Magn Reson Med 2015; 75:801–809.
17. Rooney WD, Johnson G, Li X, Cohen ER, Kim SG, Ugurbil K, Springer CS Jr. Magnetic field and tissue dependencies of human brain longitudinal 1H2O relaxation in vivo. Magn Reson Med 2007; 57:308–318.
18. Cho ZH, Kang CK, Han JY, et al. Observation of the lenticulostriate arteries in the human brain in vivo using 7.0T MR angiography. Stroke 2008;39:1604–1606.
19. Chang-Ki Kang, Chan-A Park, Kyoung-Nam Kim, Suk-Min Hong, Cheol-Wan Park, Young-Bo Kim and Zang-Hee Cho. Non-Invasive Visualization of Basilar Artery Perforators With 7T MR Angiography. JMRI 32:544–550 (2010) .
20. Dal-Bianco A, Grabner G, Kronnerwetter C, Weber M, Hoeftberger R, Berger T, Auff E, Leutzmeyer F, Trattnig S, Lassmann H, Bagnato F, Hameter S. Slow expansion of multiple sclerosis iron rim lesions: pathology and 7 T magnetic resonance imaging. Acta Neuropathol. 2017 Jan;133(1):25-42.
21. Zang Hee Cho, Chang ki Kang, Young Don Son, Sang Han Choi, Yeong Bae Lee, Sun Ha Paek, Chan Woong Park, 62 Je Guen Chi, Fernando Calamante, Meng Law, Young Bo Kim. Pictorial Review of In Vivo Human Brain: From Anatomy to Molecular Imaging. WORLD NEUROSURGERY 2013 .
22. Y. Wang, T. Liu. Quantitative susceptibility mapping (QSM): Decoding MRI data for a tissue magnetic biomarker. MRM 2015; 73:82-101.
23. Staeb D, Bollmanna S, Langkammer C, Bredies K, Barth M. Accelerated mapping of magnetic susceptibility using 3D planes-on-a- paddlewheel (POP) EPI at ultra-high field strength. NMR Biomed. (2016; DOI: 10.1002/nbm.3620.
24. van Zijl PCM, Yadav NN. Chemical exchange saturation transfer (CEST): what is in a name and what isn’t? Magn Reson Med 2011;65: 927–948.
25. Vinogradov E., Sherry A. D. & Lenkinski R. E. CEST: From basic principles to applications, challenges and opportunities. J Magn Reson 229, 155–172 (2013).
26. Liu G., Song X., Chan K. W. Y. & McMahon M. T. Nuts and bolts of chemical exchange saturation transfer MRI. NMR Biomed 26, 810–828 (2013).
27. Moritz Z. & Peter B. Chemical exchange saturation transfer (CEST) and MR Z -spectroscopy in vivo: a review of theoretical approaches and methods. Phys Med Biol 58, R221–R269 (2013).
28. Kim J., Wu Y., Guo Y., Zheng H. & Sun P. Z. A review of optimization and quantification techniques for chemical exchange saturation transfer MRI toward sensitive in vivo imaging. Contrast Media & Molecular Imaging 10, 163–178 (2015).
29. Kogan F., Hariharan H. & Reddy R. Chemical Exchange Saturation Transfer (CEST) Imaging: Description of Technique and Potential Clinical Applications. Curr Radiol Rep 1, 102–114 (2013).
30. Schuenke, P. et al. Fast and Quantitative T1ρ-weighted Dynamic Glucose Enhanced MRI. Sci. Rep. 7, 42093; (2017).
31. Nagel AM, Schmitter S, Bock M, Moser E, Semmler W, Schad LR. Parameter optimization for 7T 23Na-MRI. Proceedings of the 17th Annual Meeting ISMRM, Honolulu, HI, USA, 2009; 2465.
32. Zaaraoui W, Konstandin S, Audoin B, Nagel AM, Rico A, Malikova I, Soulier E, Viout P, Confort-Gouny S, Cozzone P-J, Pelletier J, Schad LR, Ranjeva P. Distribution of Brain sodium accumulation correlates with Disability in Multiple sclerosis: A Cross-sectional 23Na MR Imaging Study. Radiology: Volume 264: Number 3—September 2012 .
33. UmathumR, RoslerMB, NagelAM. Invivo 39K MRimaging of human muscle and brain. Radiology 2013; 269(2): 569–576.
34. Ladd ME. High-field-strength magnetic resonance: potential and limits. Top Magn Reson Imaging 2007;18:139–152.?
35. Rivlin M, Navon G. Glucosamine and N-acetyl glucosamine as new CEST MRI agents for molecular imaging of tumors. Sci Rep. 2016 Sep 7;6:32648.
36. Ertürk MA, Wu X, Eryaman Y, Van de Moortele PF, Auerbach EJ, Lagore RL, DelaBarre L, Vaughan JT, Ugurbil K, Adriany G, Metzger GJ. Toward imaging the body at 10.5 tesla. Magn Reson Med. 2017 Jan;77(1):434-443
37. Ugurbil K. The road to functional imaging and ultrahigh fields. Neuroimage 2012; 62(2):726–735.
38. Niendorf N, Barth M, Kober F, Trattnig S. From ultrahigh to extreme field magnetic resonance: where physics, biology and medicine meet. Magnetic Resonance Materials in Physics, Biology and Medicine, June 2016, Volume 29, Issue 3, pp 309–311.
39. Budinger TF, Bird MD, Frydman L, Long JR, Mareci TH, Rooney WD, Rosen B, Schenck JF, Schepkin VD, Sherry AD, Sodickson DK, Springer CS, Thulborn KR, Ugurbil K, Wald LL. Toward 20 T magnetic resonance for human brain studies: opportunities for discovery and neuroscience rationale. MAGMA. 2016 Jun;29(3):617-39.
40. Nagel AM, Umathum R, Rösler MB, Ladd ME, Litvak I, Gor'kov PL, Brey WW, Schepkin VD. (39) K and (23) Na relaxation times and MRI of rat head at 21.1 T. NMR Biomed. 2016 Jun;29(6):759-66.
41. Snyder CJ, Delabarre L, Moeller S, Tian J, Akgun C, Van de Moortele PF, Bolan PJ, Ugurbil K, Vaughan JT, Metzger GJ. Comparison between eight- and sixteen-channel TEM transceive arrays for body imaging at 7 T. Magn Reson Med. 2012 Apr;67(4):954-64.
42. Orzada S, Bitz AK, Kraff O, Oehmigen M, Gratz M, Johst S, Völker MN, Rietsch SHG, Flöser M, Fiedler T, Shooshtary S, Solbach K, Quick H, Ladd ME. A 32-channel integrated body coil for 7 Tesla whole-body imaging. Proceeedings of ISMRM 2016; #167.
43. Wald LL, Wiggins GC, Potthast A, Wiggins CJ, Triantafyllou C. Design considerations and coil comparisons for 7 T brain imaging. Appl Magn Reson 2005;29:19–37.
44. Ladd ME. High-field-strength magnetic resonance: potential and limits. Top Magn Reson Imaging 2007;18:139–152.
45. Vinding MS, Guerin B, Vosegaard T, Nielsen NC. Local SAR, Global SAR, and Power-Constrained Large-Flip-Angle Pulses with Optimal Control and Virtual Observation Points. Magnetic Resonance in Medicine 2017; 77:374–384.
46. Wisse LE, Reijmer YD, ter Telgte A, Kuijf HJ, Leemans A, Luijten PR, Koek HL, Geerlings MI, Biessels GJ; Utrecht Vascular Cognitive Impairment (VCI) Study Group. Hippocampal disconnection in early Alzheimer's disease: a 7 tesla MRI study. J Alzheimers Dis. 2015;45(4):1247-56. doi: 10.3233/JAD-142994.
47. Koning W, de Rotte AA, Bluemink JJ, van der Velden TA, Luijten PR, Klomp DW, Zwanenburg JJ. MRI of the carotid artery at 7 Tesla: quantitative comparison with 3 Tesla. J Magn Reson Imaging. 2015 Mar;41(3):773-80. doi: 10.1002/jmri.24601.
48. Marrakchi-Kacem L, Vignaud A, Sein J, Germain J, Henry TR, Poupon C, Hertz-Pannier L, Lehéricy S, Colliot O, Van de Moortele PF, Chupin M. Robust imaging of hippocampal inner structure at 7T: in vivo acquisition protocol and methodological choices. MAGMA. 2016 Jun;29(3):475-89. doi: 10.1007/s10334-016-0552-5.
49. Harrison DM, Li X, Liu H, Jones CK, Caffo B, Calabresi PA, van Zijl P. Lesion Heterogeneity on High-Field Susceptibility MRI Is Associated with Multiple Sclerosis Severity. doi: 10.3174/ajnr.A4726
50. Li X, Harrison DM, Liu H, Jones CK, Oh J, Calabresi PA, van Zijl PC. Magnetic susceptibility contrast variations in multiple sclerosis lesions. doi: 10.1002/jmri.24976
51. Cronin MJ, Wharton S, Al-Radaideh A, Constantinescu C, Evangelou N, Bowtell R, Gowland PA. A comparison of phase imaging and quantitative susceptibility mapping in the imaging of multiple sclerosis lesions at ultrahigh field. MAGMA. 2016 Jun;29(3):543-57. doi: 10.1007/s10334-016-0560-5.
52. Schmalbrock P, Prakash RS, Schirda B, Janssen A, Yang GK, Russell M, Knopp MV, Boster A, Nicholas JA, Racke M, Pitt D. Basal Ganglia Iron in Patients with Multiple Sclerosis Measured with 7T Quantitative Susceptibility Mapping Correlates with Inhibitory Control. AJNR Am J Neuroradiol. 2016 Mar;37(3):439-46. doi: 10.3174/ajnr.A4599.
Figures