5666
Cardiovascular Event Prediction by Machine Learning: The Multi-Ethnic Study of Atherosclerosis1Radiology, Johns Hopkins University, Baltimore, MD, United States, 2George Washington University, Washington DC, DC, United States, 3National Institutes of Health, Bethesda, MD, United States, 4Wake Forest University Health Sciences, Winston-Salem, NC, United States, 5UCLA School of Medicine, Los Angeles, CA, United States, 6Johns Hopkins University, Baltimore, MD, United States
Synopsis
Event prediction has been the cornerstone of cardiovascular epidemiology and have allowed us to characterize sub-clinical disease processes and target key risk factors for modification. Epidemiological studies used to derive such predictive models frequently contain hundreds of variables from multiple tests. Random survival forests may be an effective machine learning strategy for incident event prediction in large populations with large phenotypic datasets. These methods do not require a priori assumptions regarding causality and may thus be suitable to defining the role of novel biomarkers and tests (such as imaging, biomarker panels, ECG, etc) for cardiovascular disease prediction. We explore the role of MRI in the prediction of incident heart failure and all-cause death.
Introduction
Machine learning may be useful to predict outcomes and identify biomarkers in large population studies with extensive phenotyping. We used random survival forests (RF), a machine learning technique, to predict heart failure (HF) and death in comparison to Cox regression, and identify the usefulness of MRI.Methods
6814 participants free of any cardiovascular disease at baseline from the Multi-Ethnic Study of Atherosclerosis (MESA) were used to predict HF and all-cause death over 10 years of follow-up. 168 measurements from traditional cardiovascular risk assessment, electrocardiography, MRI, chest computed tomography, carotid ultrasonography, questionnaires and biomarker panels were obtained as part of MESA (Figure 1). As a training dataset, 66.6% of the dataset was randomly selected from the overall group of participants; the remaining 33.3% were used for validation. The training dataset was used for internal validation wherein models were constructed and optimized to reduce prediction error and maximize prediction ability. These models were then tested on the validation dataset to examine model performance and identify the best predictors. We tested four different models in our analysis. The first model used the RF algorithm on all available variables, while the second used the RF algorithm on all variables except the MRI variables. Similarly, the third and fourth models used Cox regression with and without MRI variables included respectively.
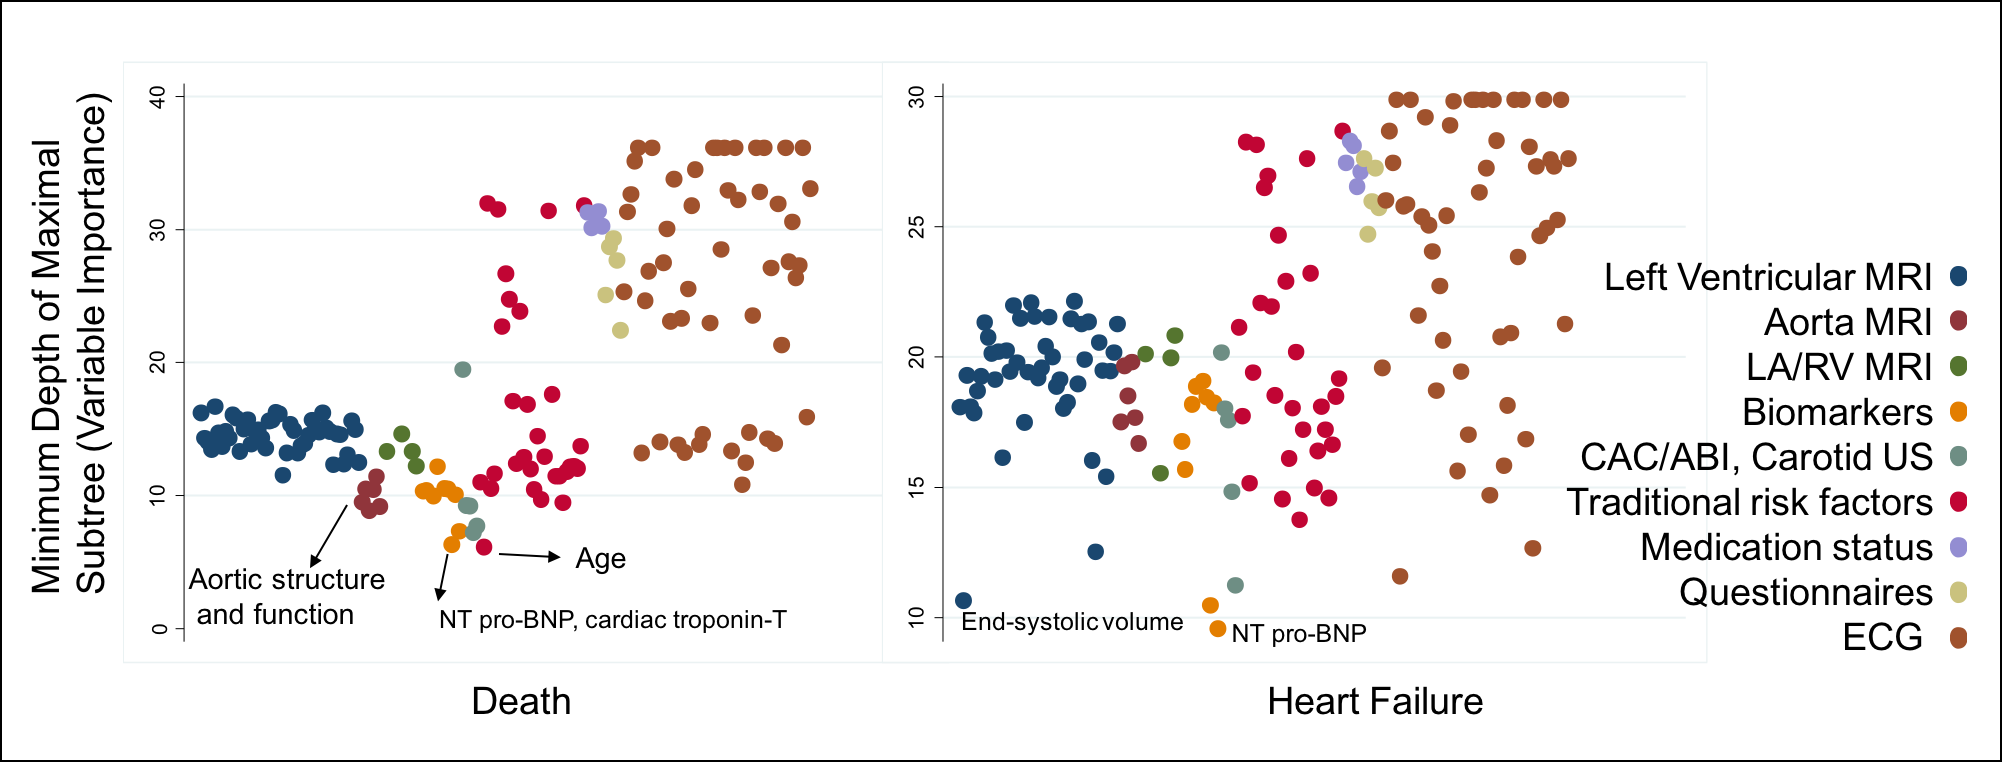
RF is an ensemble tree method for analysis of right-censored data. In short, trees are grown by binary recursive splitting of data. At each split, a candidate variable that maximizes the difference in cumulative hazard between the daughter nodes (and the cut-off that identifies this maximum difference) is chosen. The splitting stops at the terminal nodes when the data at hand can no longer be split such that each terminal node has at least one unique outcome. For each tree, the cumulative hazard rate of a case is determined based on the terminal node that contains it. An ensemble hazard function (and survival probability) is estimated by averaging over all trees in a forest. For variable importance, the variables were ranked by the mean of the minimal depth of the maximal subtree (highest point in the tree of a variable) over the entire forest (averaged over 1000 trees). Variables appearing higher on the tree have a higher rank.
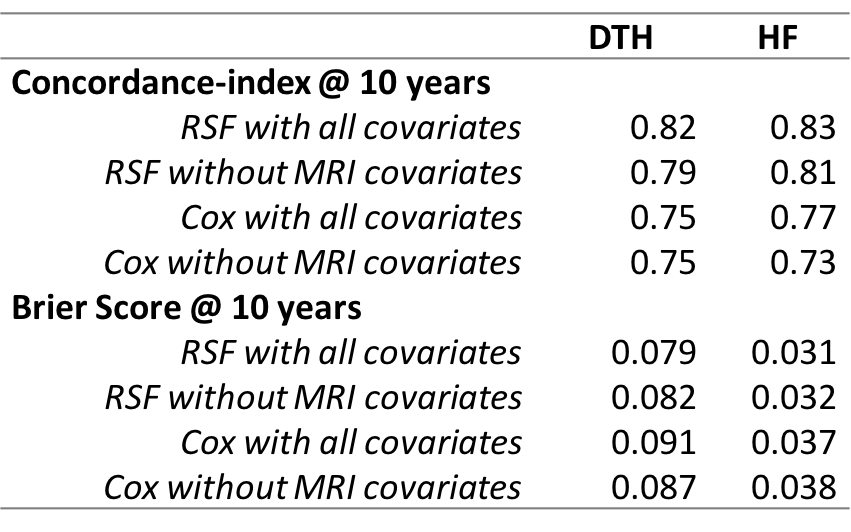
We assessed the performance of each prediction model to discriminate outcomes using Harrell’s concordance index (C-index), and the accuracy of prediction (mean squared distance between the predicted probabilities and actual outcomes) using the Brier score (BS). Higher C-index and lower BS indicate better prediction performance.
Results
A total of 6814 participants are included in the analysis. The average age was 62 years with 53% women. 13% of the participants were diabetic, 45% were hypertensive, and 50% were current or former smokers. Over a median of 11.2 years (IQR: 10.6 – 11.7), MESA identified 831 all-cause deaths and 259 incident HF events.
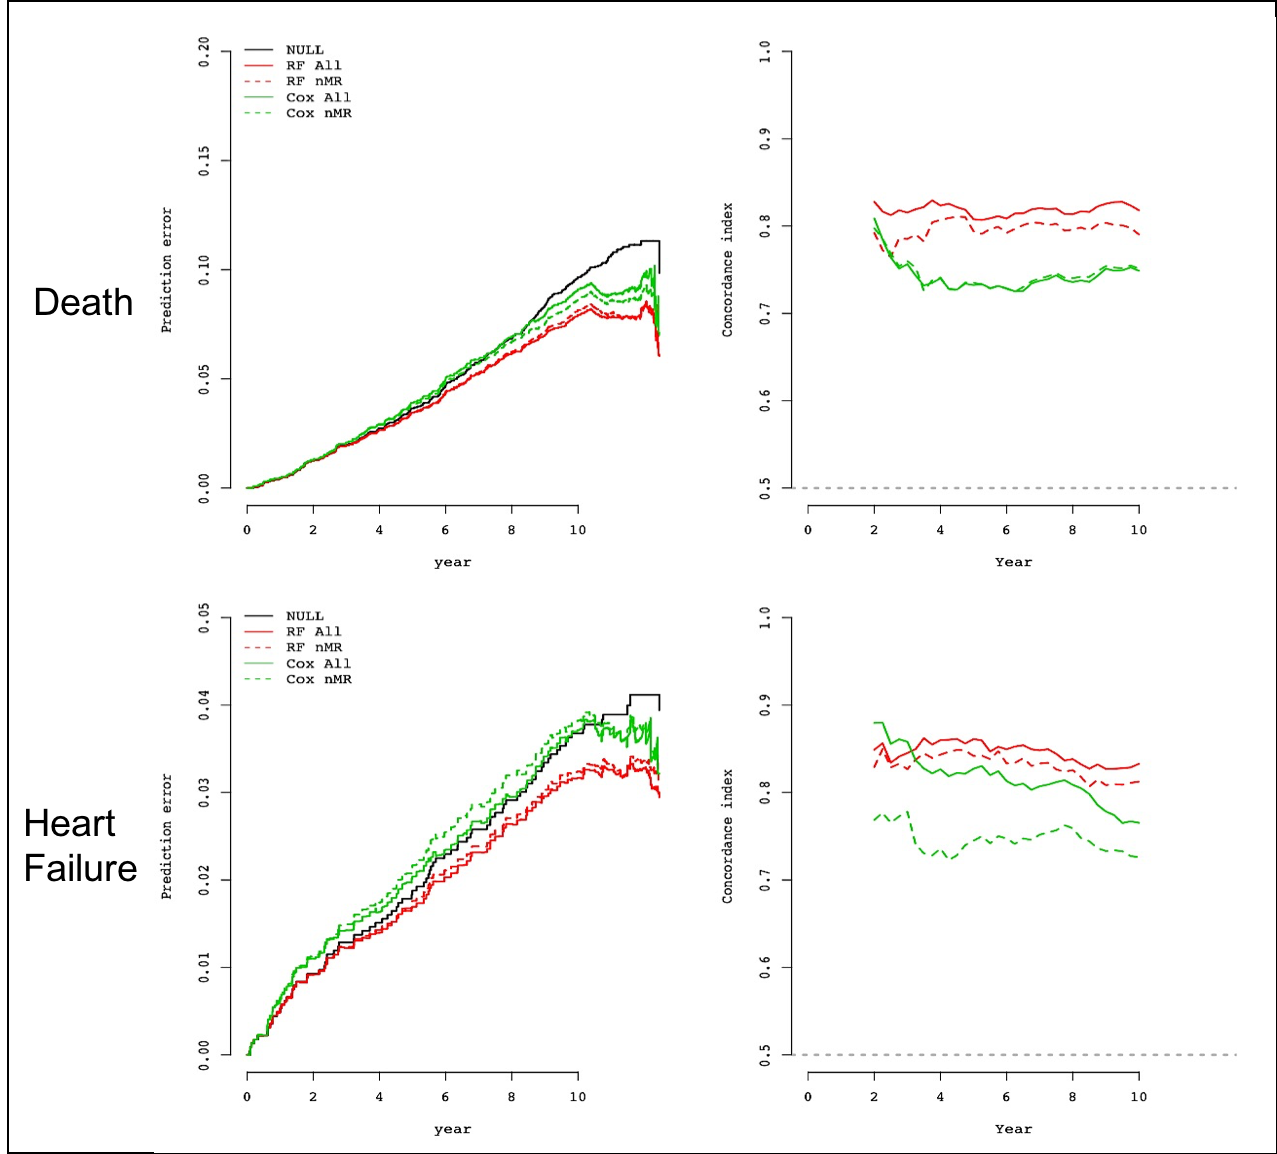
For both outcomes of interest, the RF model with MRI covariates showed the highest C-index and lowest BS (Table 1). The C-index values were higher and BS values lower when MRI variables were included, and the RF method was superior to Cox regression (Figure 2).
Discussion
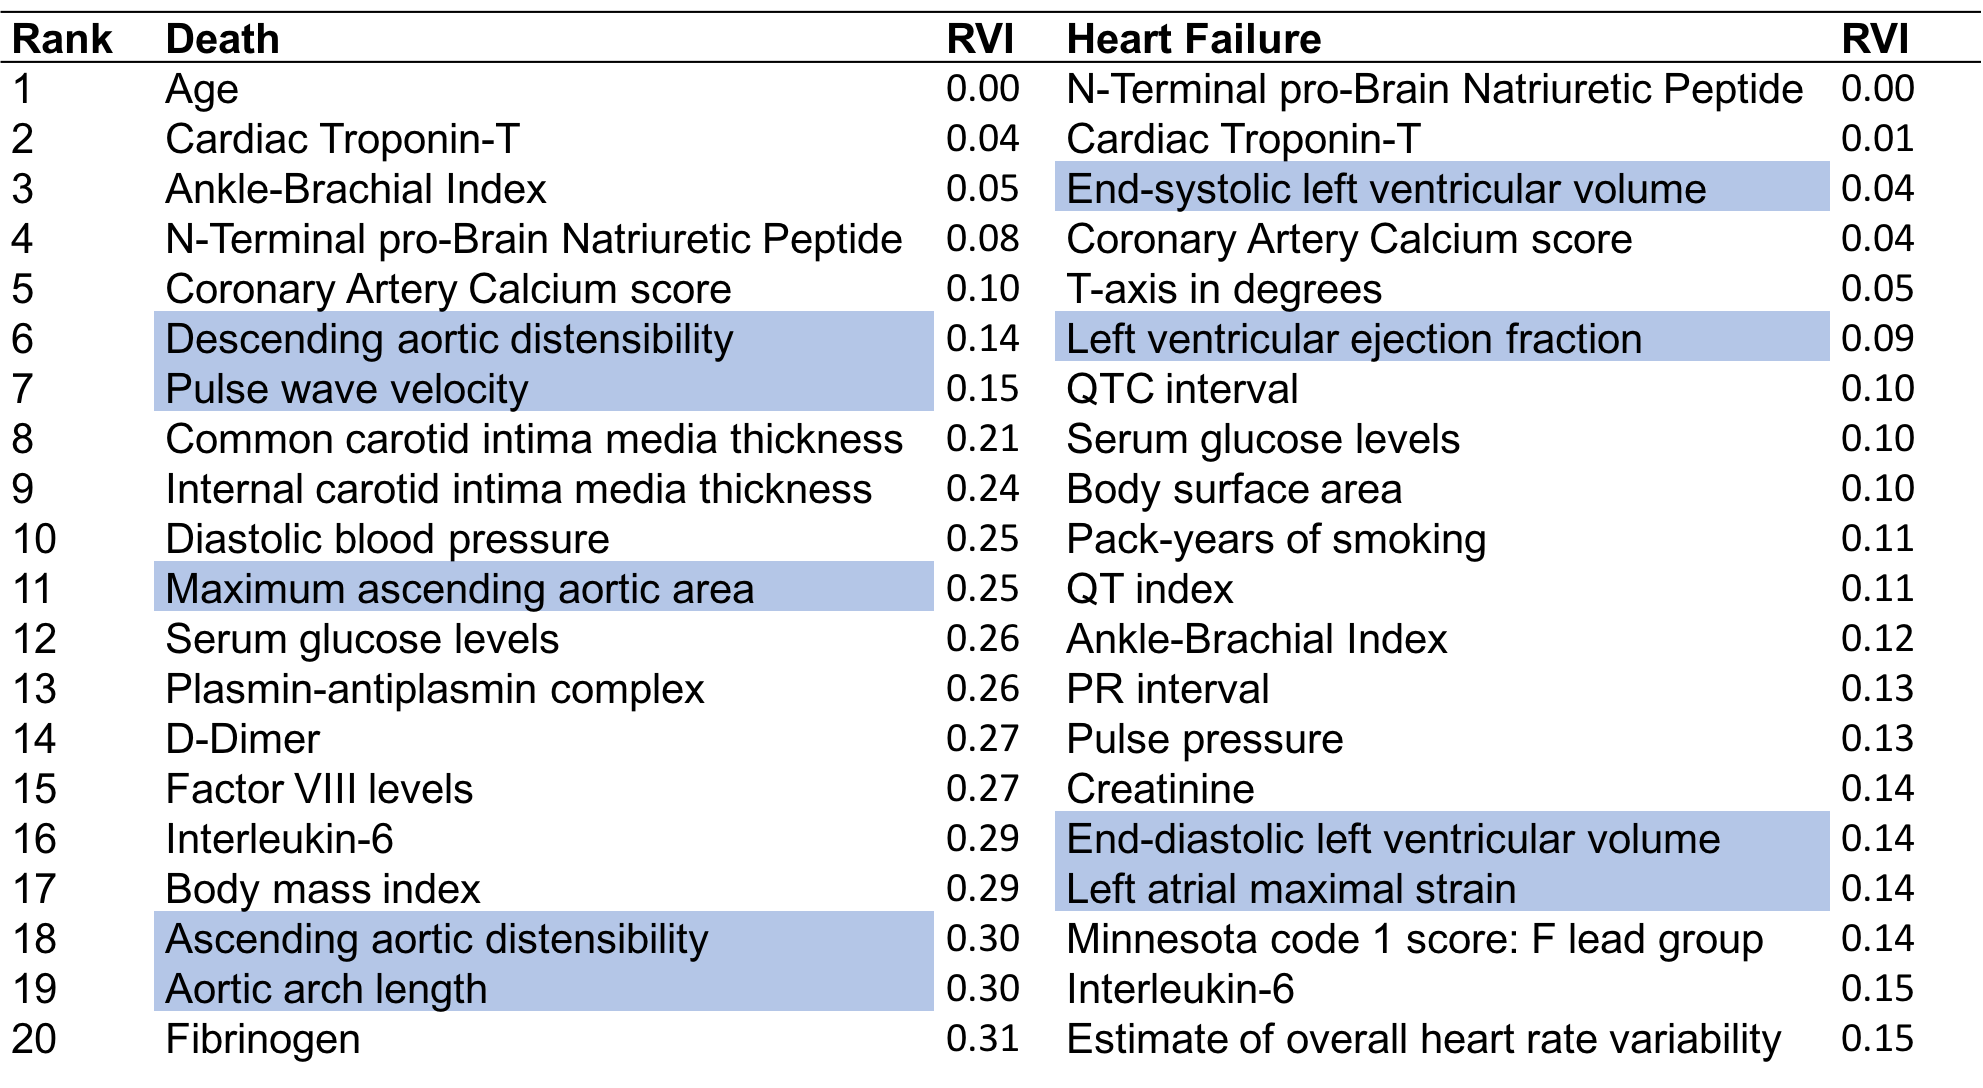
Age was the most important marker of all-cause death. MRI markers of aortic structure and function (distensibility, pulse wave velocity, cross-sectional area, and arch distance) featured prominently in the top-20 list. Markers of inflammation and thrombosis as well as myocyte stress and death also featured prominently. Traditional risk factors of obesity (body mass index), diabetes (serum glucose levels) and hypertension (blood pressure) were also among the top-20 markers. Subclinical atherosclerosis was also an important predictor of death. (see Table 2, Figure 3).
For incident HF as the endpoint, cardiac chamber stress (increased left ventricular (LV) volume, and increased N-Terminal-proBrain Natriuretic Peptide levels), markers of myocyte death (troponin-T levels), and decreased ejection fraction were the most important markers. A lengthened QT interval indicating increased risk for tachyarrythmias, increased atherosclerosis (coronary artery calcium and ankle-brachial index), and inflammation markers were also among the top predictors for HF. Increased pulse pressure, glucose levels and body surface area were also among the top risk factors for incident HF reflecting the role of obesity, diabetes, and hypertension on HF development.
Conclusion
MRI measurements of LV structure and function were important markers of HF while aortic structure and function were important markers of all-cause death. MRI added to prediction models even when accounting for biomarkers and other diagnostic tests. Machine learning in conjunction with deep phenotyping improve event prediction accuracy in an initially asymptomatic population.Acknowledgements
This research was supported by contracts N01-HC-95159, N01-HC-95160, N01-HC-95161, N01-HC-95162, N01-HC-95163, N01-HC-95164, N01-HC-95165, N01-HC-95166, N01-HC-95167, N01-HC-95168 and N01-HC-95169 from the National Heart, Lung, and Blood Institute and by grants UL1-TR-000040 and UL1-TR-001079 from NCRR. The information contained herein (for the MESA Columbia Field Center) was derived in part from data provided by the Bureau of Vital Statistics, New York City Department of Health and Mental Hygiene. The authors thank the other investigators, the staff, and the participants of the MESA study for their valuable contributions. The MESA protocol, including information about the populations from which recruitment occurred, detailed exclusion criteria, investigators, and other information, is available at www.mesa-nhlbi.org. A full list of participating MESA investigators and institutions can also be found.
The views expressed in this abstract are those of the authors and do not necessarily represent the views of the National Heart, Lung, and Blood Institute; the National Institutes of Health; or the U.S. Department of Health and Human Services.
References
1. Gorodeski EZ, Ishwaran H, Kogalur UB, et al. Use of Hundreds of Electrocardiographic Biomarkers for Prediction of Mortality in Postmenopausal Women The Women's Health Initiative. Circulation: Cardiovascular Quality and Outcomes 2011: CIRCOUTCOMES. 110.959023.
2. Bild DE, Bluemke DA, Burke GL, et al. Multi-ethnic study of atherosclerosis: objectives and design. Am J Epidemiol 2002; 156(9): 871-81.
3. Ishwaran H, Kogalur UB, Blackstone EH, Lauer MS. Random survival forests. The Annals of Applied Statistics 2008: 841-60.
4. Harrell FE, Califf RM, Pryor DB, Lee KL, Rosati RA. Evaluating the yield of medical tests. Jama 1982; 247(18): 2543-6. 8.
5. Brier GW. Verification of forecasts expressed in terms of probability. Monthly weather review 1950; 78(1): 1-3.
Figures