5661
Direct Pseudo-CT Image Synthesis Using Deep Learning for Pelvis PET/MR Attenuation Correction1Radiology and Biomedical Imaging, University of California San Francisco, San Francisco, CA, United States, 2University of California San Francisco, San Francisco, CA, United States, 3GE Global Research, Bangalore, India, 4GE Global Research, Munich, Germany
Synopsis
A deep learning model with fully-convolutional networks was used to directly synthesize pseudo-CT images from MR images. The pseudo-CT images were used for MR-based attenuation correction (MRAC) of PET reconstruction in PET/MRI. The effects of the MRAC on high-uptake volumes are evaluated quantitatively. We demonstrate that the deep learning-based MRAC significantly improves PET uptake quantification.
Introduction
Current MR-based attenuation correction strategies for PET/MR neglect bone [1], require atlas-registration [2], or require segmentation [3]. Recently, deep learning models have been used to generate synthetic CT images from corresponding T1- or T2-weighted MR images [4], [5].
In this work, we use a deep learning model to directly generate pseudo-CT images from zero echo-time (ZTE) and Dixon MR images. This method eliminates the need for atlas-registration and segmentation when generating pseudo-CT images. The deep learning-based pseudo-CT images are used in PET/MR MR-based attenuation correction (MRAC) and quantitatively compared with Dixon MRAC [1].
Methodology
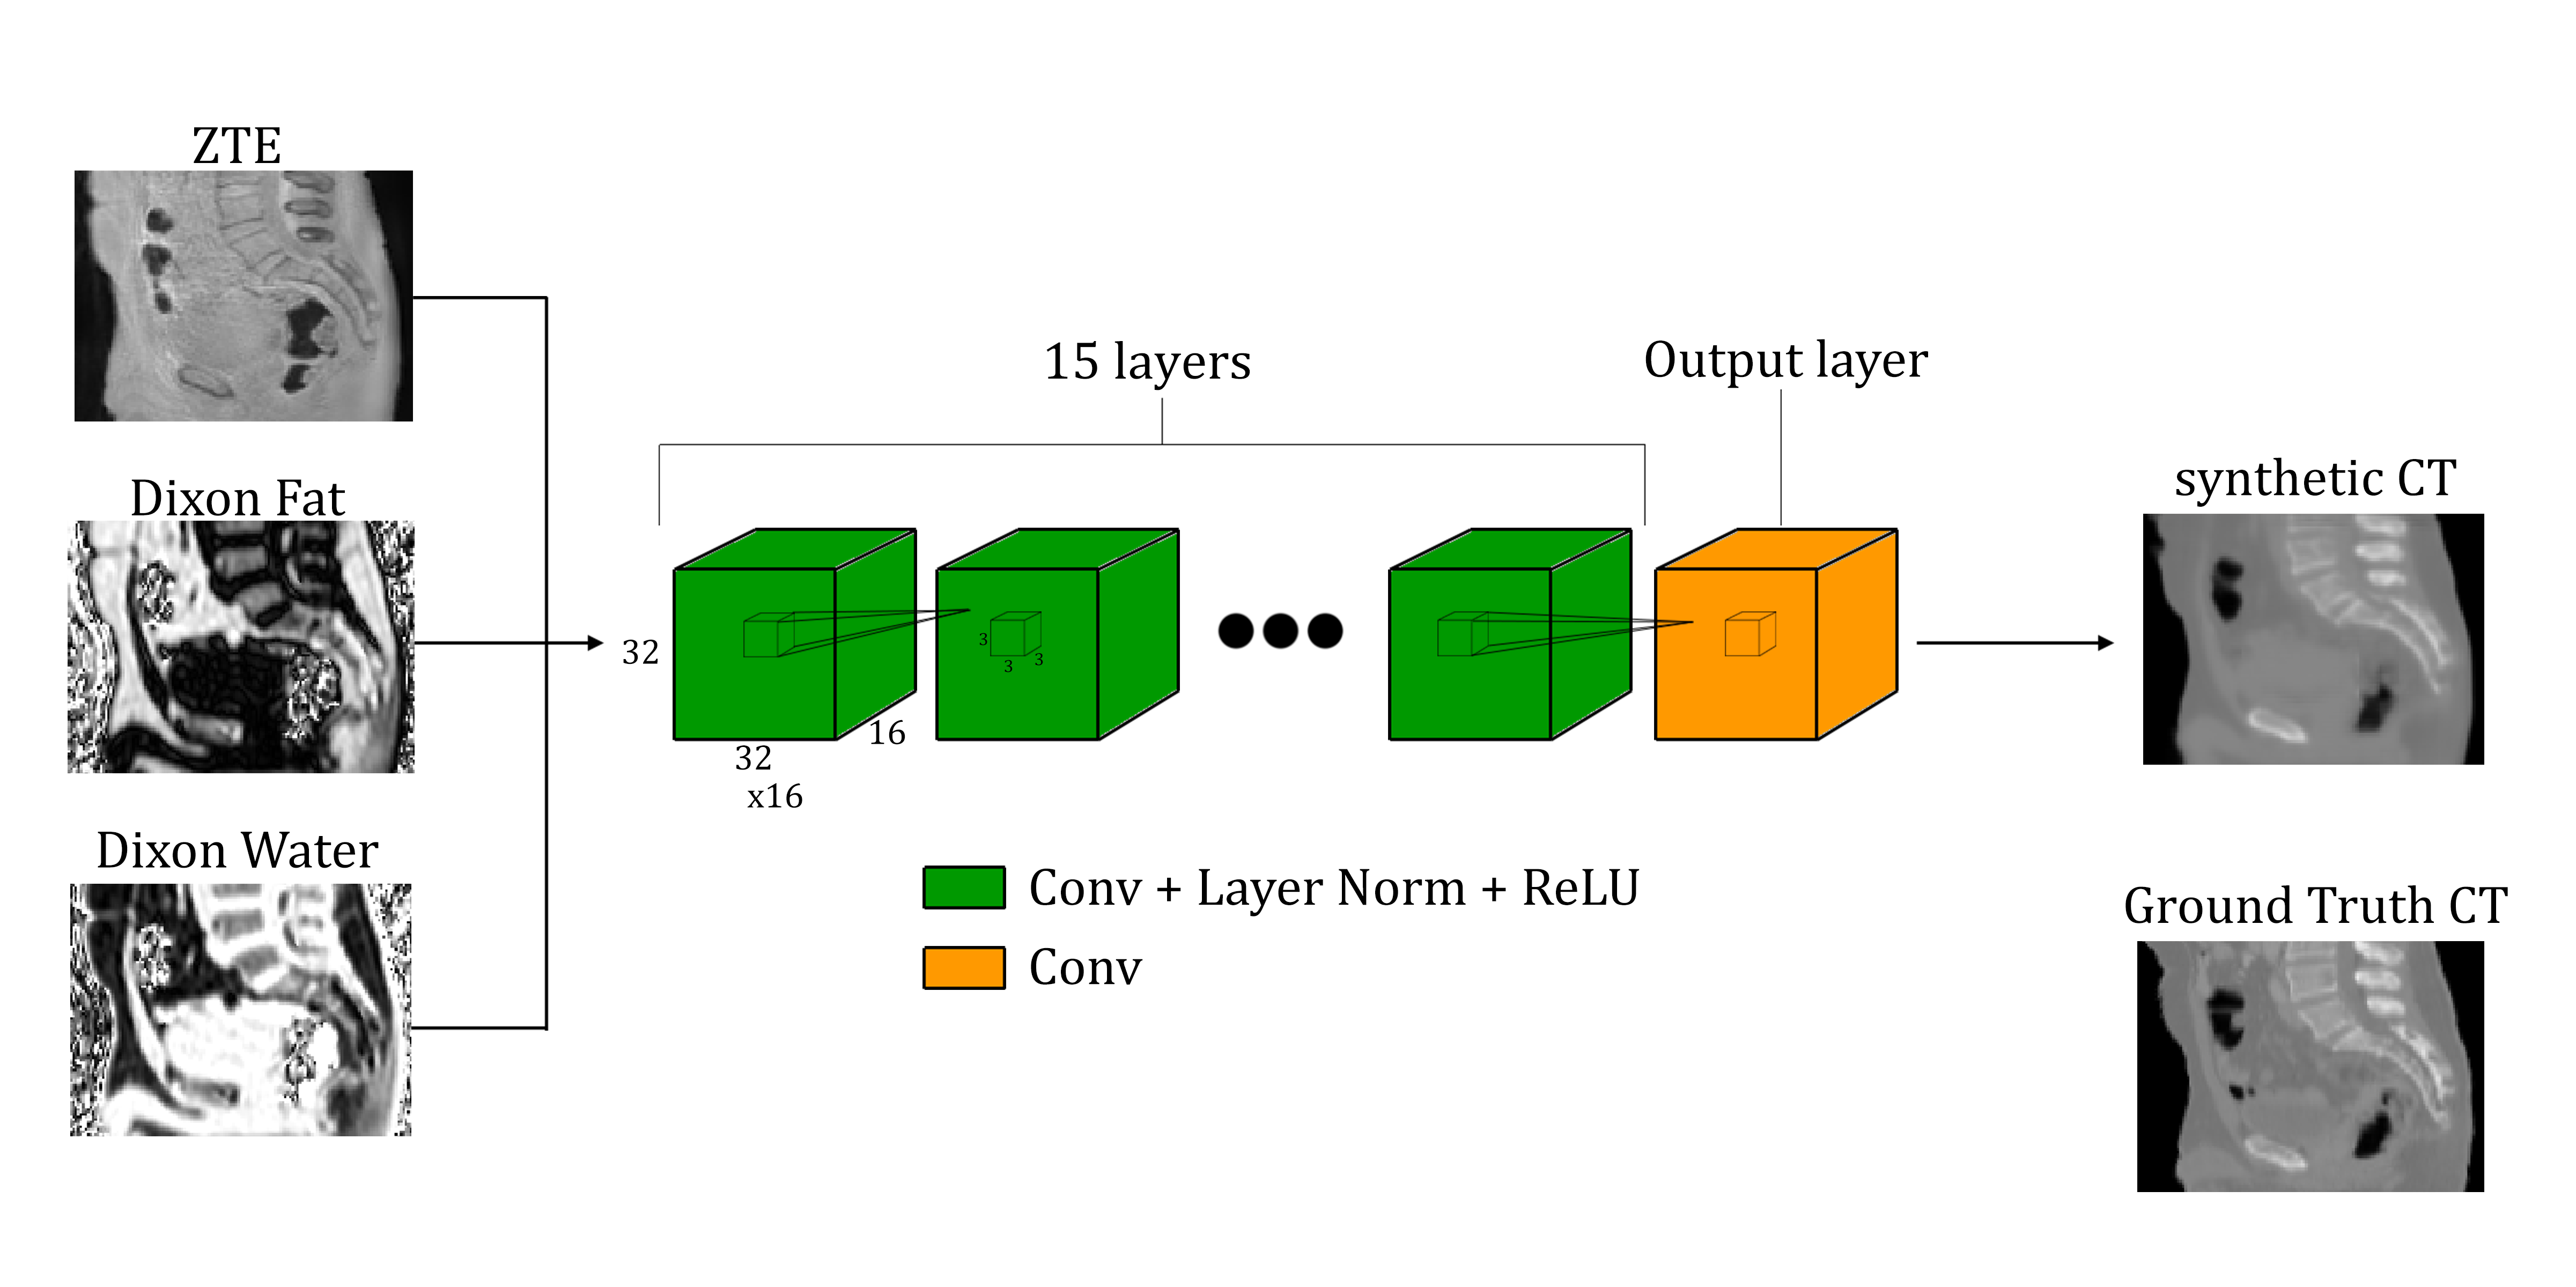
The deep learning model consists of 16 fully-convolutional networks: the first 15 layers use convolutions, layer normalization [6], and rectified linear unit (ReLU) activations; the final output layer only has convolutions. Each layer uses sixteen 3×3×3 convolutions with a stride of 1 and a padding of 1 to yield layer sizes of 32×32×16. Figure 1 illustrates the deep learning model used.
The input to the model is a 32×32×16×3 (height×width×depth×channels) volume where the ZTE MRI, Dixon Fat, and Dixon Water images are each channel respectively. The MRI protocol is the same as used in [3]. The output of the model is a 32×32×16 volume.
To train the models, overlapping patches of ZTE, Dixon Fat, Dixon Water, and co-registered ground-truth CT are used and shuffled randomly. CT images from a low-dose 120kV PET/CT attenuation correction protocol was used for training. Patches that consist of mostly air (patch mean < -800HU) are excluded from the training. Three patient datasets were used for training the model, providing a total of approximately 200,000 training patches.
The model was evaluated on a six patient datasets that were distinct from the training datasets. The deep learning-based pseudo-CT images were generated by evaluating sequential overlapping volumes from the MR images, using the average of the overlapping regions.
PET images were reconstructed using time-of-flight ordered subsets expectation maximization including a point-spread function model (FOV = 600mm, 2 iterations, 28 subsets, matrix size = 192×192, 89 slices of 2.78mm thickness) using the Dixon MRAC and deep learning-based MRAC. To remove any differences due to bowel air, air in the CT and pseudo-CT images were filled in (<-200 HU) with the corresponding HU values from the Dixon-based pseudo-CT.
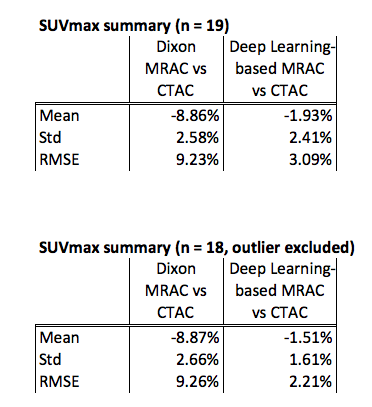
Volumes with high uptake were identified on the PET images and the SUVmax is measured. The root-mean-squared error (RMSE) is measured for each high-uptake location as follows:
$$RMSE=\sqrt{\mu^2 + \sigma^2}$$
where $$$\mu$$$ is the mean and $$$\sigma$$$ is the standard deviation.
Results
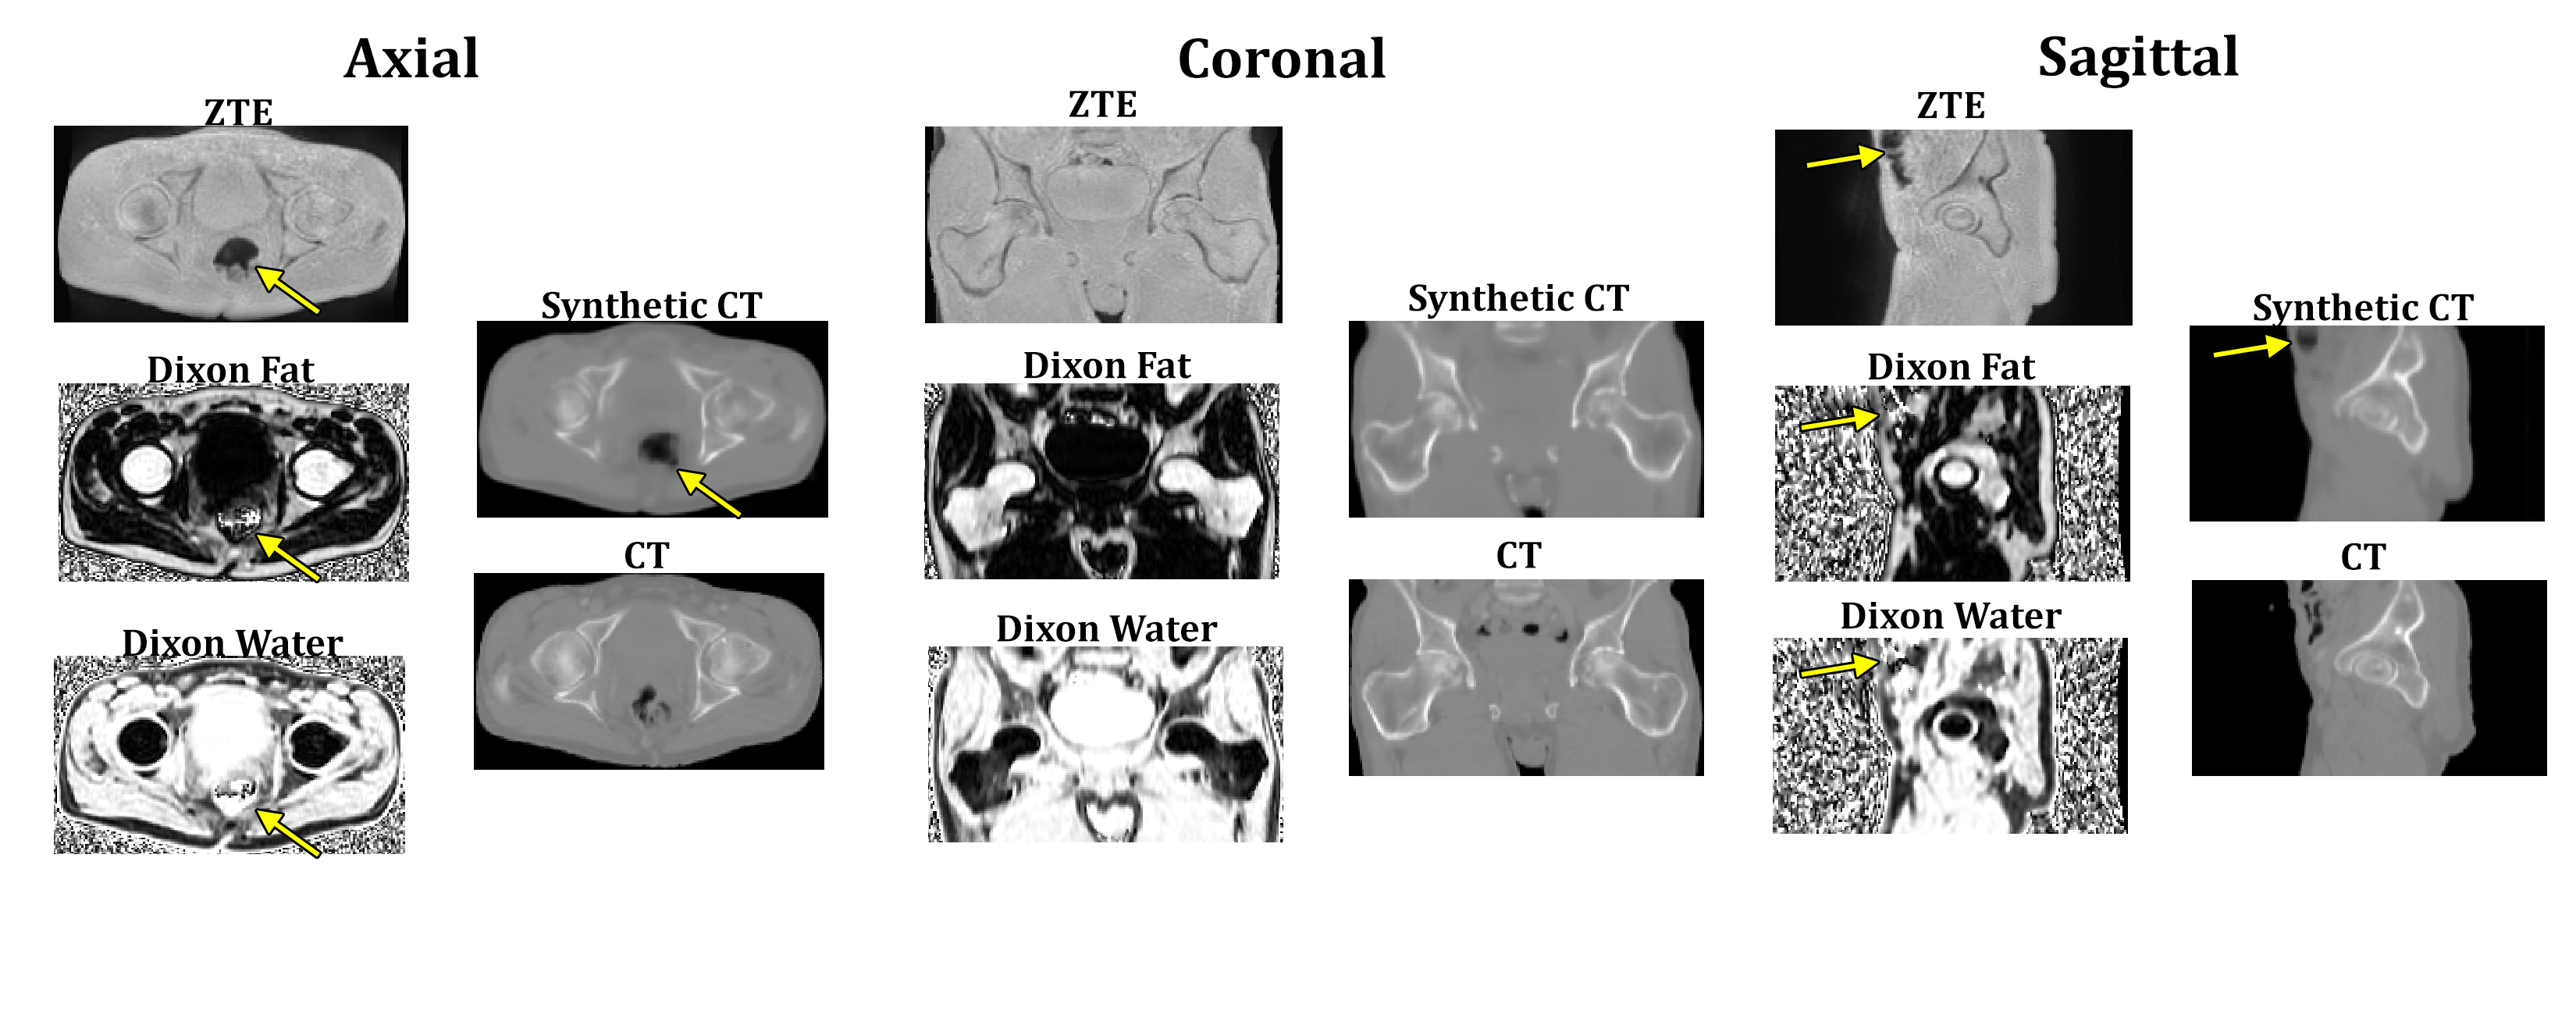
Training for the model was stopped after approximately one day of training time. Figure 2 shows a representative pseudo-CT image from the test set with the corresponding input MR images alongside the ground truth CT. The ground truth CT has different bowel air distribution due the different acquisition date.
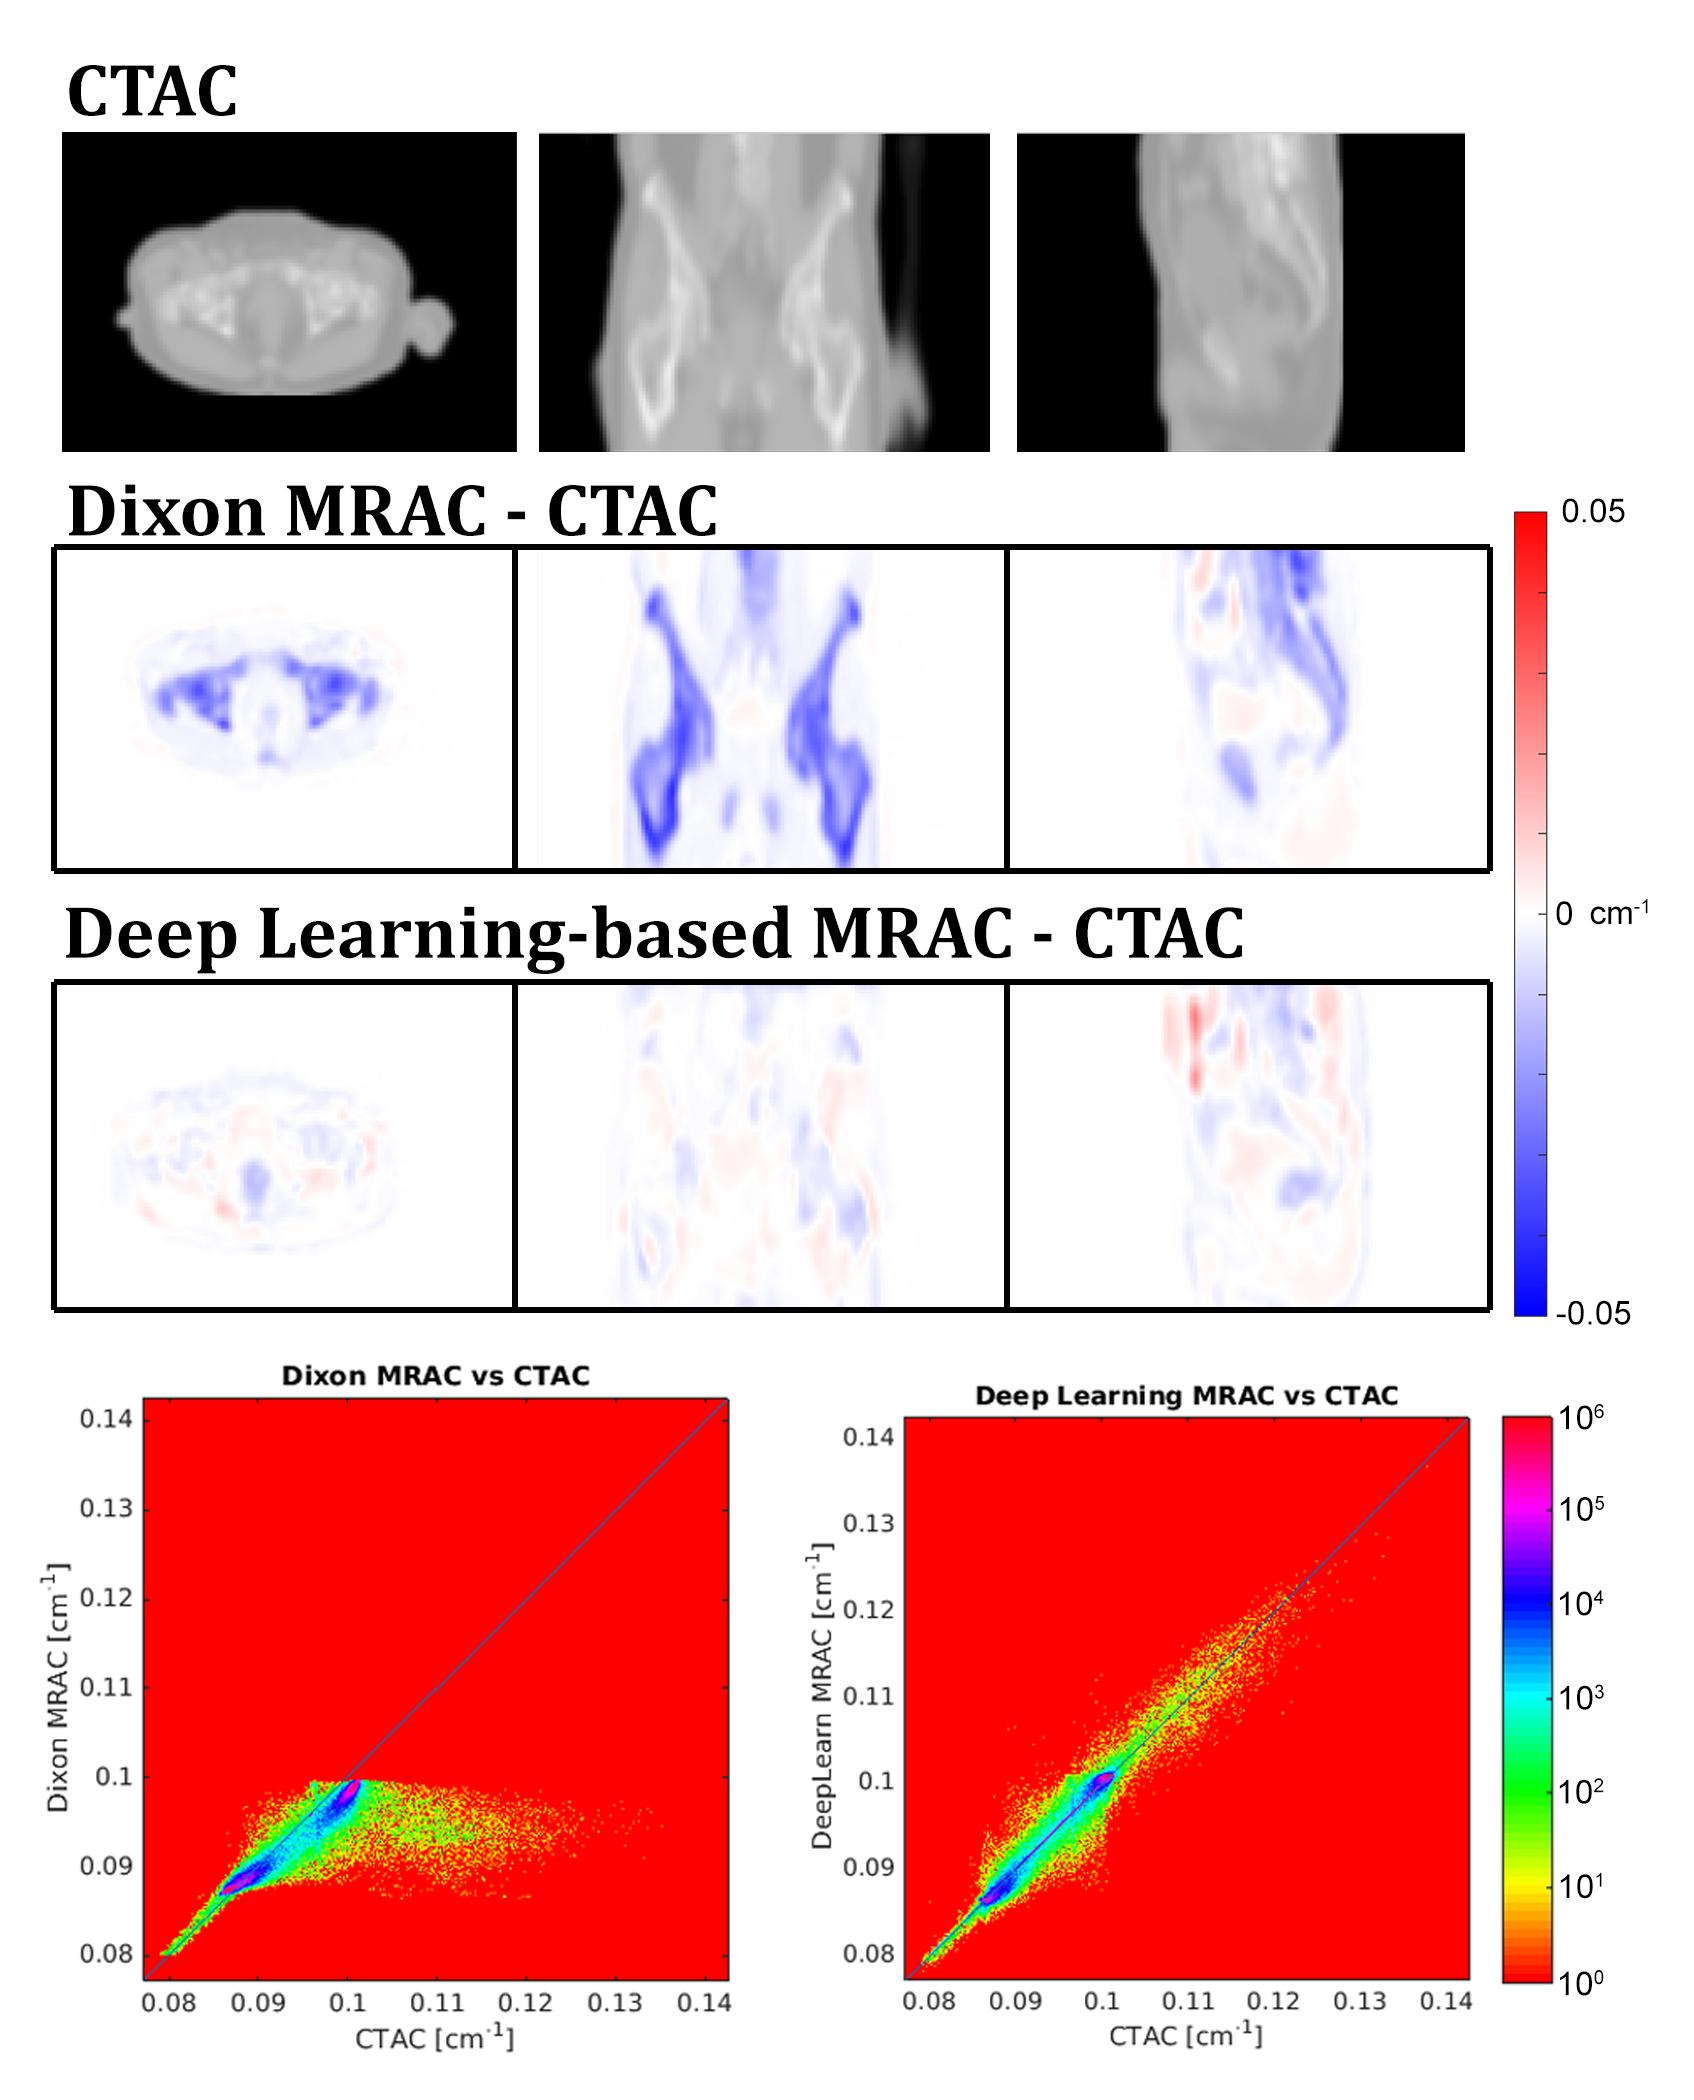
Figure 3 shows attenuation coefficient (AC) images and difference maps of the Dixon-based MRAC, and deep learning-based MRAC, respectively, with CTAC. The deep learning-based MRAC has much better agreement with CTAC.
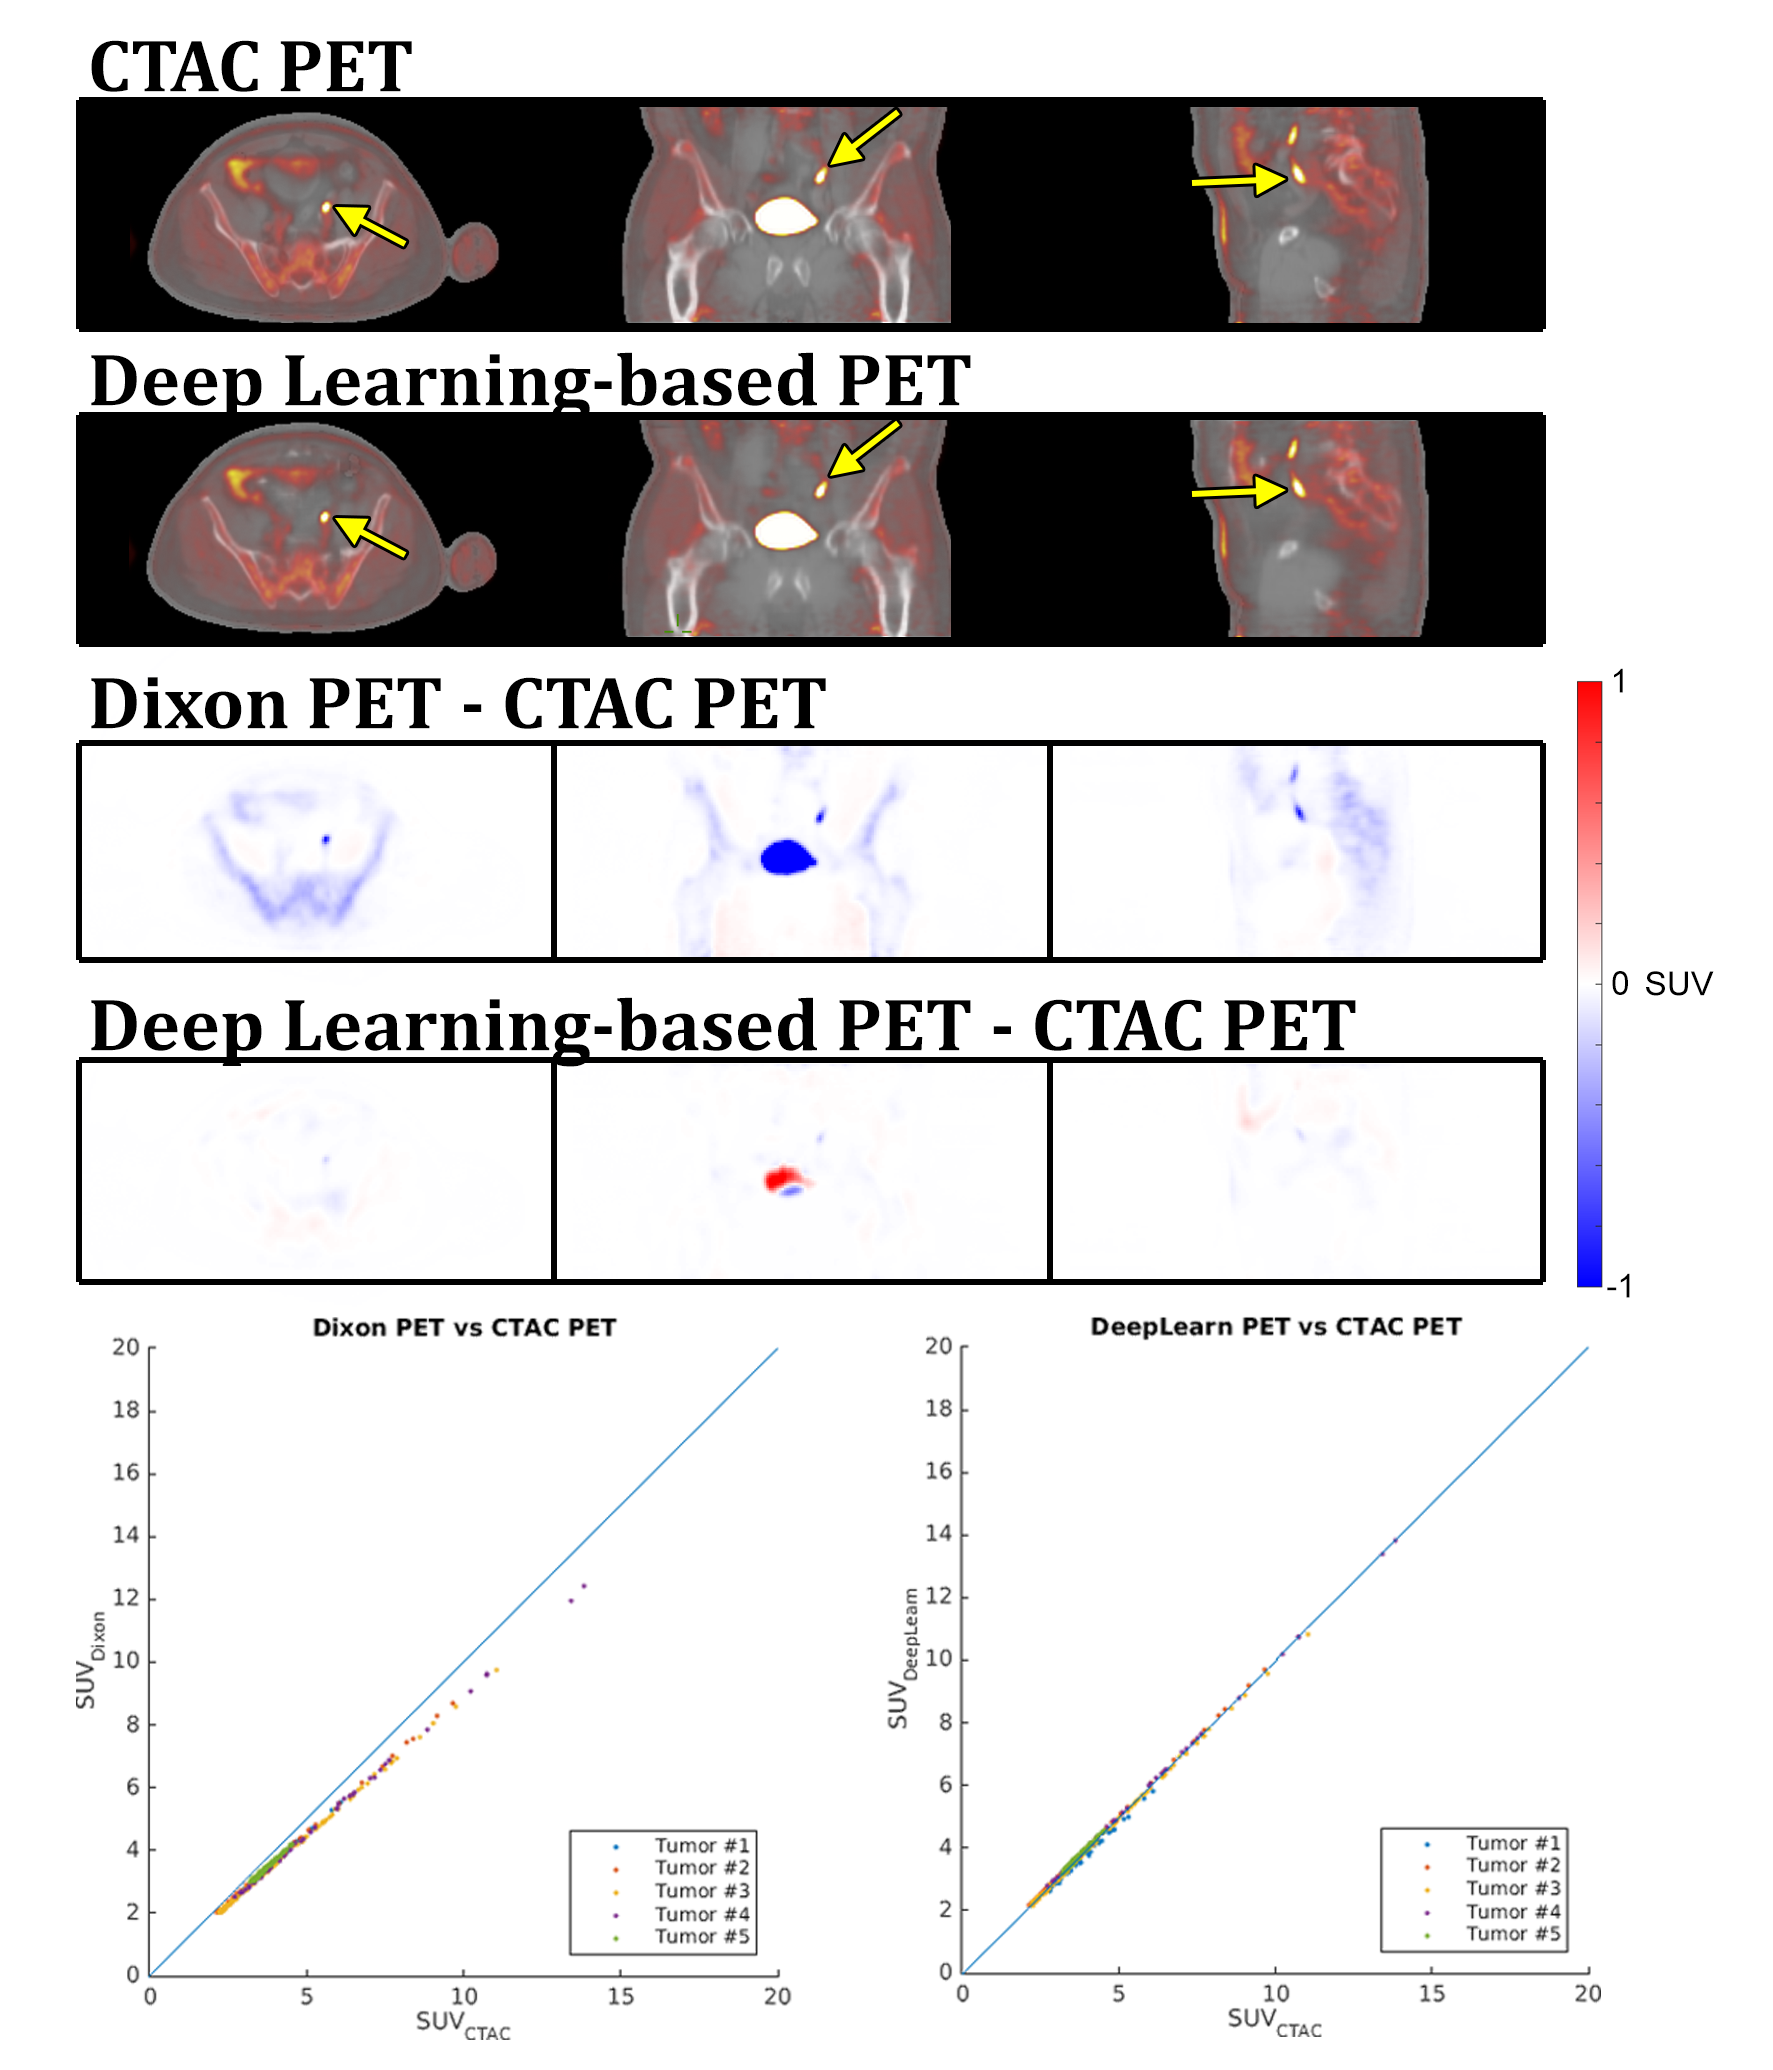
Figure 4 shows the resulting PET images and difference images. Similar to the AC difference maps, the differences are greatly reduced with the deep learning-based MRAC.
Figure 5 contains the summary of the SUVmax. One high-uptake volume located near the superior end of the PET field-of-view is excluded. With this outlier excluded, the deep learning-based MRAC reduced the RMSE for high-uptake regions to 2.21% from 9.26% with the Dixon MRAC.
Discussion
A major improvement of this method over previous methods is that the pseudo-CT images are directly generated using the patient MRI allowing for patient-specific information without needing any additional segmentation or atlas-registration. The deep learning-based results are also comparable to or better than the method that we have previously developed for pelvis PET/MR attenuation correction based on ZTE and Dixon MR [3]. This previous method requires bone segmentation, which is eliminated by the deep learning method.
The current model can be significantly improved with more diverse training sets or with the use of more complex models such as generative adversarial networks [5]. Additionally, the deep learning approach can also be applied to different anatomies (head, lung, or knee) and easily evaluated on different combinations of MR pulse sequences.
Conclusion
A deep learning model was successfully used to directly generate pseudo-CT images for PET/MR MR-based attenuation correction. We demonstrate that the deep learning-based MRAC significantly improves PET uptake quantification.Acknowledgements
No acknowledgement found.References
[1] S. D. Wollenweber et al., “Comparison of 4-Class and Continuous Fat/Water Methods for Whole-Body, MR-Based PET Attenuation Correction,” IEEE Trans. Nucl. Sci., vol. 60, no. 5, pp. 3391–3398, Oct. 2013.
[2] D. H. Paulus et al., “Whole-Body PET/MR Imaging: Quantitative Evaluation of a Novel Model-Based MR Attenuation Correction Method Including Bone,” J. Nucl. Med., vol. 56, no. 7, pp. 1061–1066, Jul. 2015.
[3] A. P. Leynes et al., “Hybrid ZTE/Dixon MR-based Attenuation Correction for Quantitative Uptake Estimation of Pelvic Lesions in PET/MRI,” Med. Phys., p. n/a-n/a, Jan. 2017.
[4] D. Nie, X. Cao, Y. Gao, L. Wang, and D. Shen, “Estimating CT Image from MRI Data Using 3D Fully Convolutional Networks,” in Deep Learning and Data Labeling for Medical Applications, 2016, pp. 170–178.
[5] D. Nie, R. Trullo, C. Petitjean, S. Ruan, and D. Shen, “Medical Image Synthesis with Context-Aware Generative Adversarial Networks,” ArXiv161205362 Cs, Dec. 2016.
[6] J. L. Ba, J. R. Kiros, and G. E. Hinton, “Layer Normalization,” ArXiv160706450 StatML, Jul. 2016.
Figures