5660
Predicting Osteoarthritis Radiographic Incidence by Coupling Quantitative Compositional MRI and Deep Learning1University of California, San Francisco, San Francisco, CA, United States
Synopsis
In this study quantitative compositional MRI and deep learning were coupled to discover latent feature representations, non-linear aggregation among elementary features able to characterize relaxation maps for Osteoarthritis diagnosis and progression prediction. 1,348 subjects from the Osteoarthritis Initiative (OAI) public dataset were considered. T2 relaxation map were automatically analyzed to build a 2D feature map used to train a convolutional neural network for the classification of subjects in OA, control and progression groups. The proposed method was able to detect OA subjects with 95.2% accuracy, and to detect controls subjects that demonstrated OA signs 4 years later with 80.7% accuracy.
Introduction
Quantitative compositional MRI
biomarkers, such as T2 relaxation time mapping, play a central role
in Osteoarthritis(OA) research, probing the biochemical composition of the
articular cartilage1. Current
standard is to measure averages T2 values in manually defined
cartilage compartments2, however
there is growing interest in exploring techniques for the automatic analysis of
spatial distribution and extraction of relaxometry patterns able to
characterize subjects and predict disease progression3.
Recently, deep learning has
dramatically improved some of the most challenging artificial intelligence and
medical informatics tasks including drug discovery and genomics4.
Deep learning computational models are composed of multiple processing layers
and learn representations of data with multiple levels of abstraction using
the tendency that many natural patterns are compositional hierarchies. In this
study we coupled T2 relaxation time compositional imaging and deep convolutional
neural networks with the aim to automatically extract relaxometry patterns and data-driven
features able to: (i) distinguish OA subjects from controls (ii) predict
incidence of OA 4 years before any radiographic signs.Method
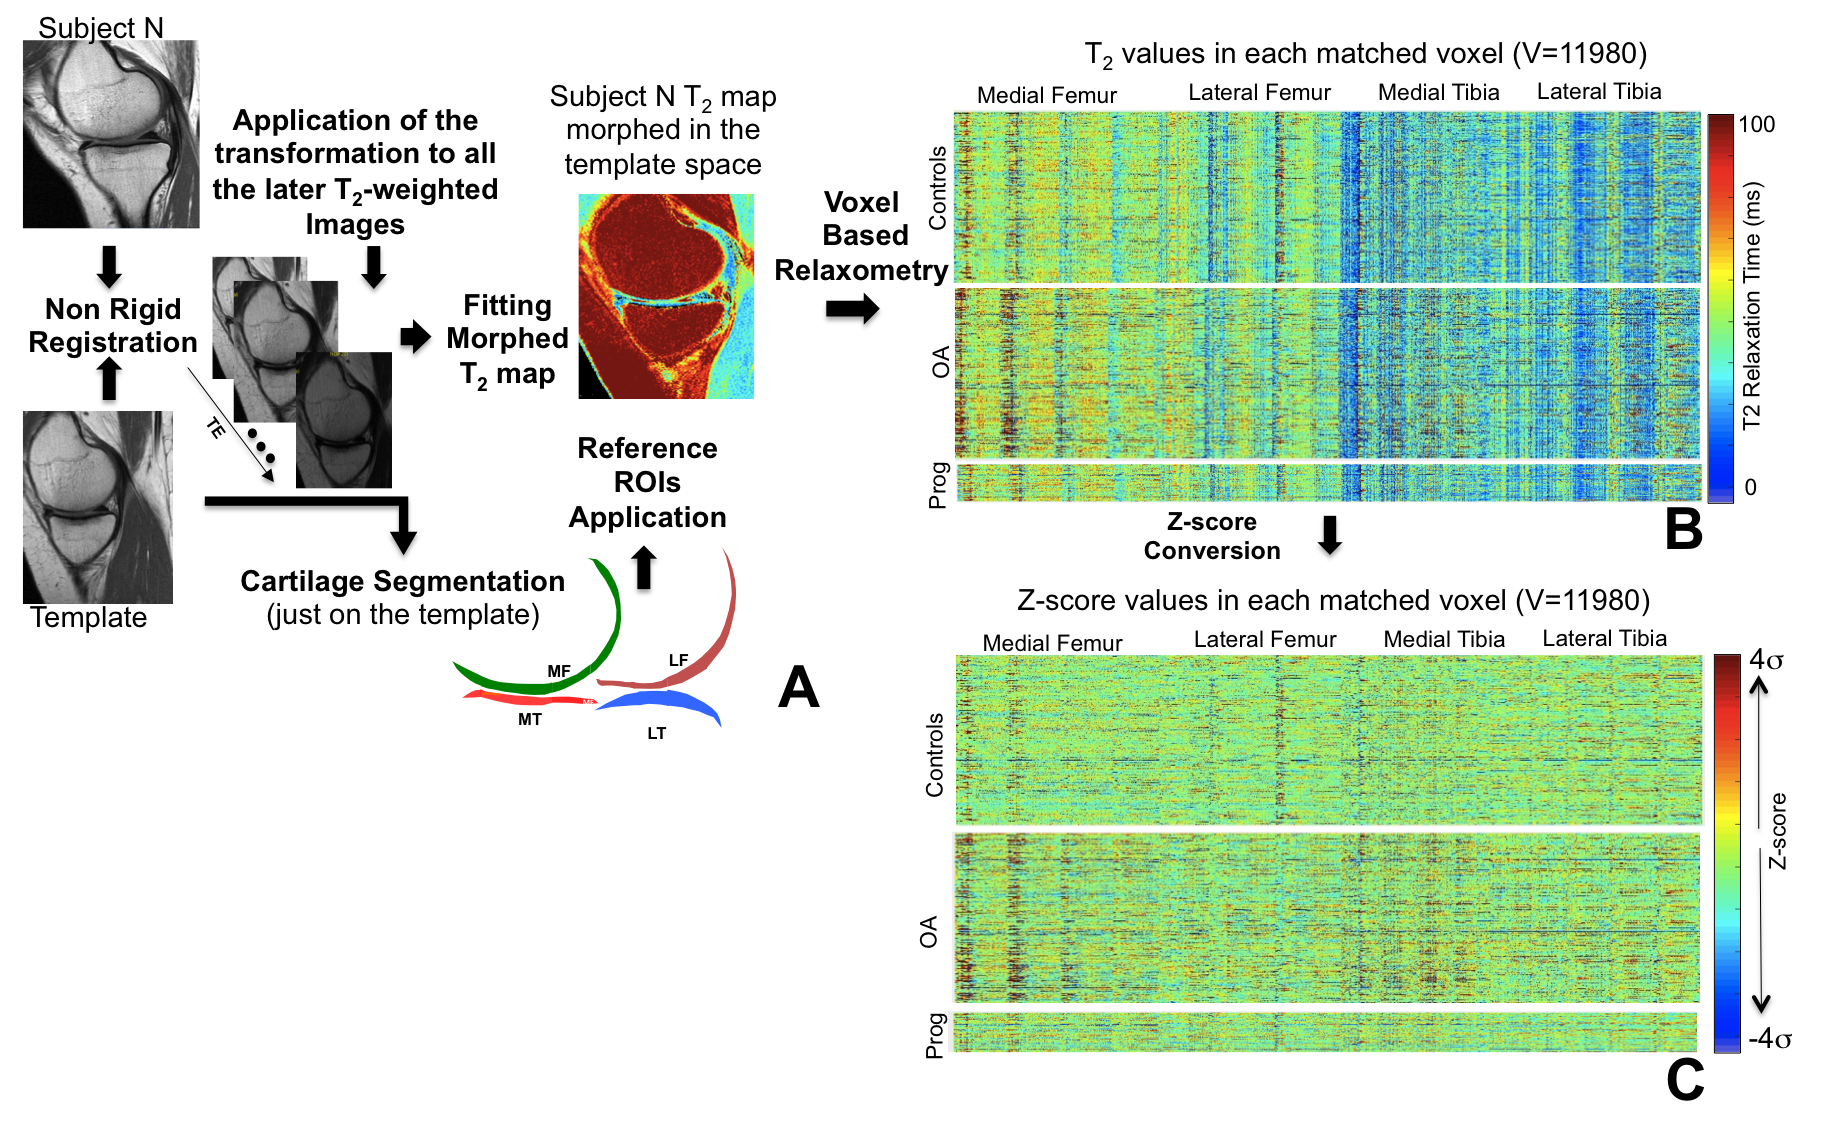
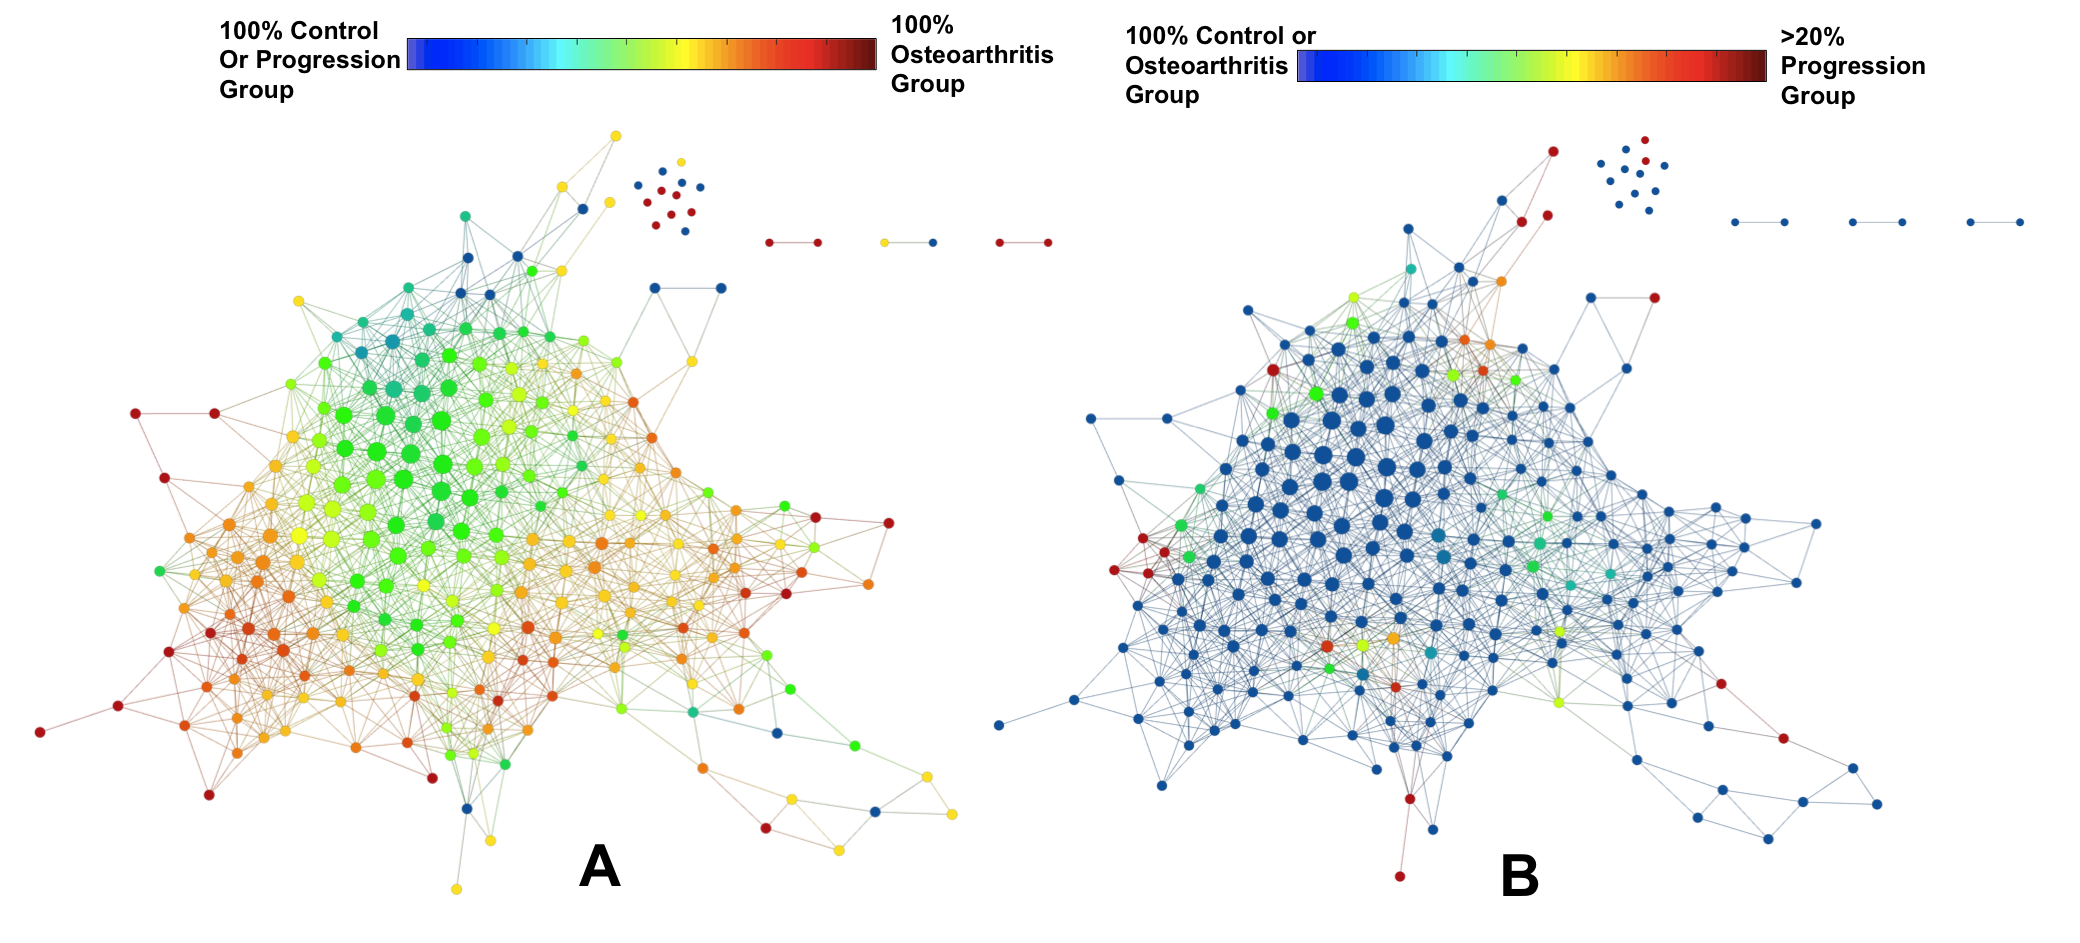
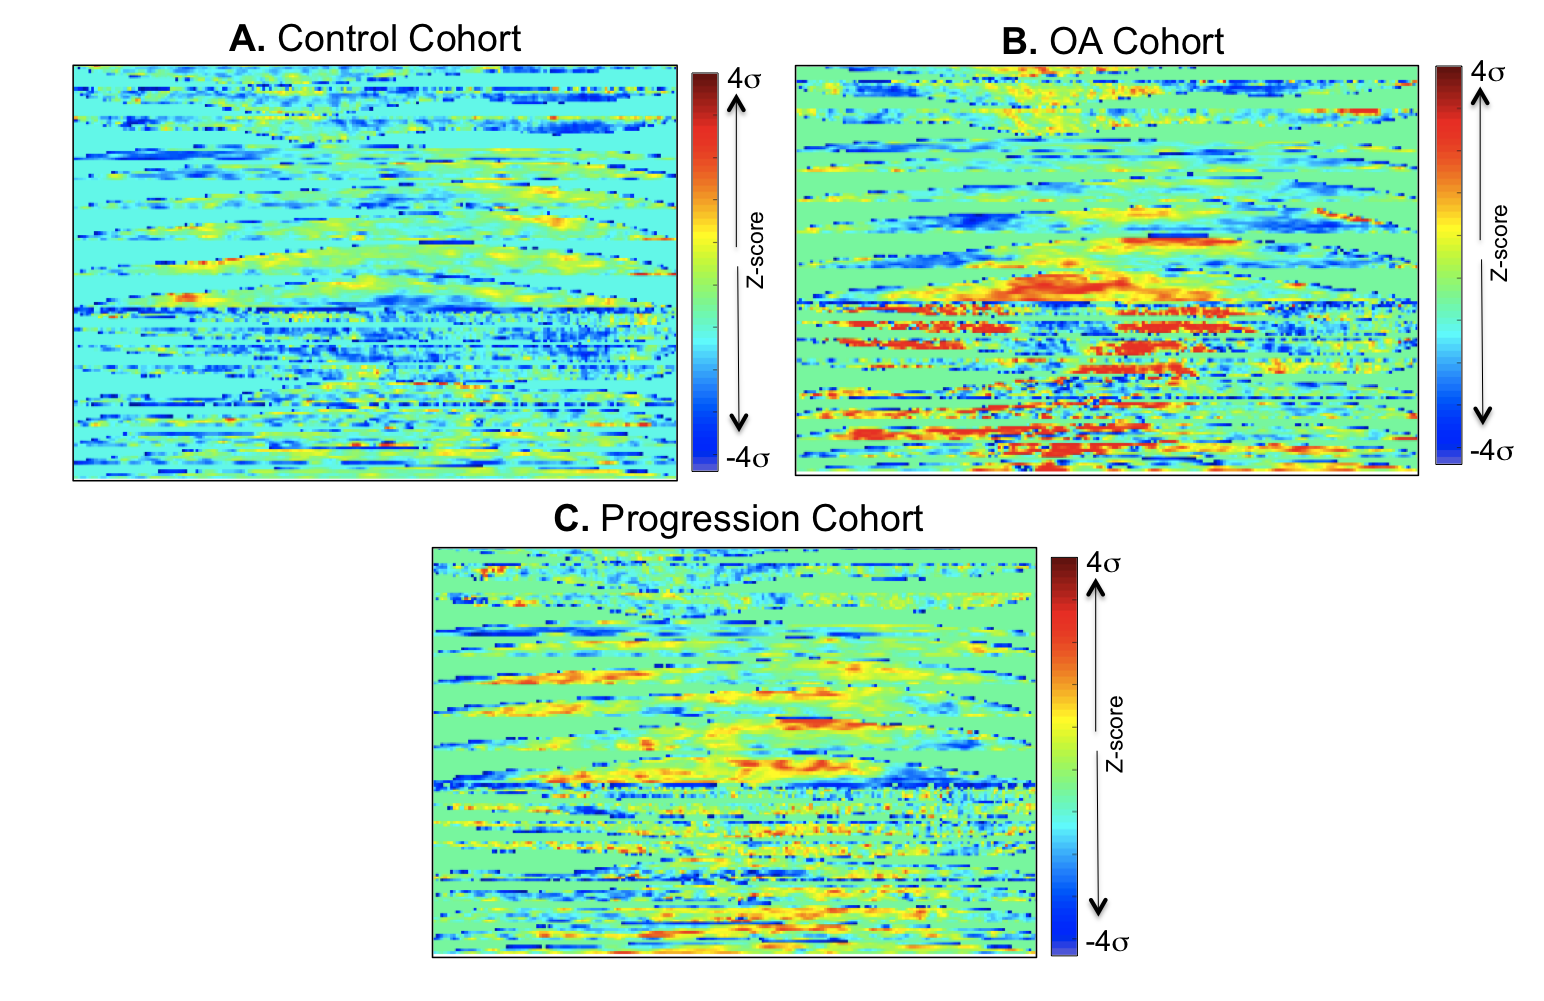
1,348 subjects from the Osteoarthritis Initiative (OAI) public dataset were considered in this study. 3 groups were defined by the evaluation of Kellgren and Lawrence (KL) scores at baseline (V0) and 4 year (V4) time points: the Control Cohort V0 KL 0-1; V4 KL 0-1 (N=612(48.29%), age 58.39 years, BMI 27.94 Kg/m2, 310 female), the OA Cohort V0 KL ≥2; V4 KL ≥2 (N=651(45.4%), age 63.48 years BMI 30.34 Kg/m2, 438 female) and the Progression Cohort V0 KL 0-1; V4 KL ≥2 (N=85(6.3%), age 59.28 years, BMI 29.84 Kg/m2, 54 female). Sagittal 2-D multi-echo spin-echo images were used for the quantification of the T2 relaxation time. All the T2 maps were morphed to a common standard space, performing a fully automatic atlas based cartilage segmentation previously described5 (Figure 1A). The morphing of all the T2 relaxation time maps allowed the description of each map with a matched vector of 11,980 components building a multidimensional signature that capture all the cartilage compositional information included in each T2 map (Figure 1B). Each vector was then locally normalized considering matched controls groups, obtaining a description invariant to demographics covariates and global spatial pattern that captures just anomalies (Figure 1C). Unsupervised data exploration based on Topological Data Analysis (TDA)6 was performed for the multidimensional visualization of the dataset with the aim of evaluating the voxel based T2 relaxation time N-Dimensional description as a valid osteoarthritis feature space (Figure 2). All the normalized maps were then converted in 2D images (Figure 3) by mapping the T2 values using a cartilage flattening technique aimed to preserved the structural information included in the maps (cartilage layers, directional heterogeneity). These 2D maps were used for the training of a deep convolutional neural network described in Figure 4. Due to the small number of subjects in the progression group, simplified feature maps including either medial or lateral information were explored to accomplish the second aim of this study. 25% of the subjects in each class were randomly selected as validation set and not used in the training phase. Principal Component Analysis (PCA)-based technique was used for data augmentation7 of the remaining 75% with the aim of synthetizing feasible maps and to increase the sample size to 13,480 samples.Results
The automatic method adopted in this study produced T2 compartmental averages strongly correlated to the ones obtained by manual segmentation processing (R =0.84, Figure 5). The binary classification between OA and controls subjects showed a classification accuracy of 95.2% when applied in the validation test. As a comparison, when the 4 compartmental averages obtained from manual process (LF, MF, LT, MT) were considered to train a Support Vector Machine (SVM) the accuracy was just 59.18%, showing the power of applying a deep learning model and extracting data driven features from the overall map. The progression prediction showed the best performances when applied on the medial femur compartment alone with a percentage of correct classification in the validation set equal to 80.7%.Discuss and Conclusion
In this study we provide a proof of concept that the coupling of cutting edge technologies in quantitative compositional MRI and deep learning fields can successfully discover latent feature representations, non-linear aggregation among elementary features able to accurately characterize disease status and predict progression. The data-driven extraction of features from T2 maps can exploit the real potential of this quantitative MRI technique, to date still hampered by tedious and time-consuming manual image post-processing pipelines; and deeply underused due to the handcrafting of too simplistic image representations, such as relaxation averages or first order texture information.Acknowledgements
P50 AR060752 (SM), R01AR046905 (SM), H. Neilsen Foundation (JH and ARF), R01NS067092 (ARF), R01NS088475 (ARF), Wings for Life (ARF),References
1. Li X, Majumdar S. Quantitative MRI of articular cartilage and its clinical applications. Journal of magnetic resonance imaging 2013;38:991-1008. 2. Joseph GB, McCulloch CE, Nevitt MC, et al. A reference database of cartilage 3 T MRI T2 values in knees without diagnostic evidence of cartilage degeneration: data from the osteoarthritis initiative. Osteoarthritis and Cartilage 2015;23:897-905. 3. Pedoia V, Russell C, Randolph A, Li X, Majumdar S. Principal component analysis-T1r Voxel based relaxometry of the articular cartilage: a comparison of biochemical patterns in osteoarthritis and anterior cruciate ligament subjects. Quant Imaging Med Surg. 2016 Dec; 6(6):623-633. 4. LeCun Y, Bengio Y, Hinton G. Deep learning. Nature 2015;521:436-44. 5 Pedoia V, Li X, Su F, Calixto N, Majumdar S. Fully automatic analysis of the knee articular cartilage T1rho relaxation time using voxel-based relaxometry. Journal of magnetic resonance imaging : JMRI 2016;43:970-80 6. Lum PY, Singh G, Lehman A, et al. Extracting insights from the shape of complex data using topology. Nature Scientific reports 2013;3:1236. 7. A Krizhevsky, I Sutskever, GE Hinton ImageNet Classification with Deep Convolutional Neural Networks Advances in neural information processing systems, 1097-1105Figures
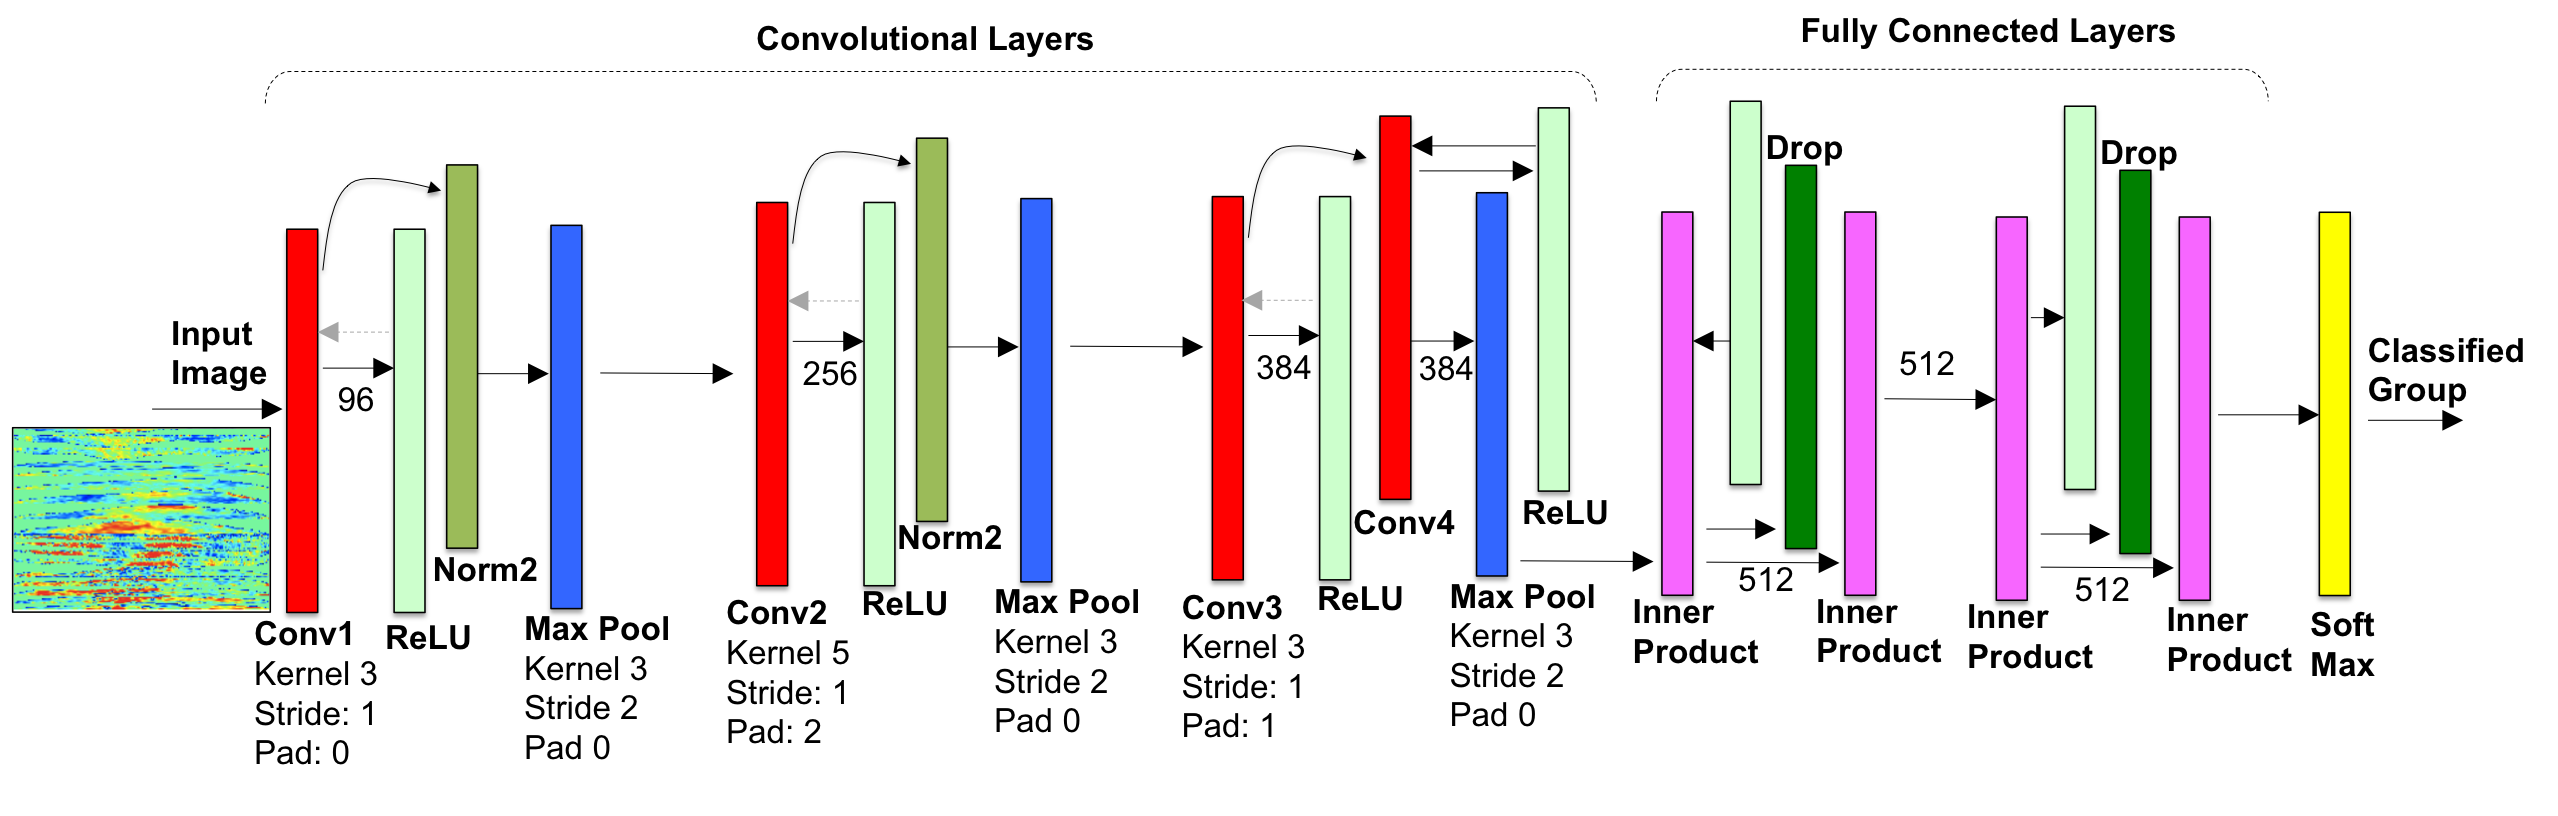
Network Architecture: we adopted a modified version of AlexNet7 with 4 convolutional and 2 fully connected layers. The first convolutional layer has a kernel of 3x3 and stride 1 to maximize the details extracted from the input image. The output was computed with two fully connected layers with size of 512, 4 times smaller then the original architecture. Training: The network was trained for 40 epochs (3hrs), with standard stochastic gradient decent, 3rd degree Polynomial Decay as learning policy and initial learning rate of 0.01. Hardware: The network was trained using an Nvidia Devbox with 4 GTX TitanX GPUs
