5655
Investigation of long-term effect of a high-fat diet using quantitative MRI and 1H MRS for assessing body and liver fat, and muscle mass1Institute for Clinical Diabetology, German Diabetes Center, Leibniz Institute for Diabetes Research, Heinrich Heine University, Düsseldorf, Germany, 2Lee Gil Ya Cancer and Diabetes Institute, Gachon University, Incheon, Korea, Republic of
Synopsis
Repetitive and noninvasive MR examinations of fat content can provide indispensable information for longitudinal metabolic studies. It is of great interest to understand how obesity in youth affects the fat metabolism later in life. Thus we longitudinally examined mice with/without a high-fat diet [HFD] for 8 weeks from 13 to 67 weeks old using MRI and 1H MRS. As a result, visceral fat restored normalcy in 10 weeks after the termination of HFD, subcutaneous and liver fat returned to normalcy in ~ 16 - 20 weeks as compared to controls.
PURPOSE:
Noninvasive and quantitative assessment of whole body fat by MR provides indispensable information for longitudinal metabolic studies.1-3 Accurate quantification of muscle mass is also of interest. High-fat feeding on animals is routinely employed to induce obesity for metabolic studies. However, it is rare to find data on long-term effects of a limited duration of high-fat diets [HFD] in youth. Thus the goals of this study were 1) to quantitatively assess body muscle, subcutaneous and visceral fat, and liver fat using MRI and 1H MRS in mice on an 8-week HFD diet, and 2) to examine long-term effects of this limited duration of HFD.METHODS:
A total of 12 mice were studied after approval by IACUC (6 mice on a HFD [20% PTN; 20% CHO; 60% FAT]; 6 mice on a normal chow diet [CON]) from 13 to 67 weeks old [CON: 27.8±4.0 vs. HFD: 28.5±1.9 g at 13 weeks]. Right after the baseline studies at 13 weeks old, HFD started and lasted for 8 weeks, and then a normal chow diet was fed to the HFD group. Just before the HFD, during and after the HFD, MR studies were continuously performed from 13 weeks till 67 weeks old at 16 various time Points.Experimental:
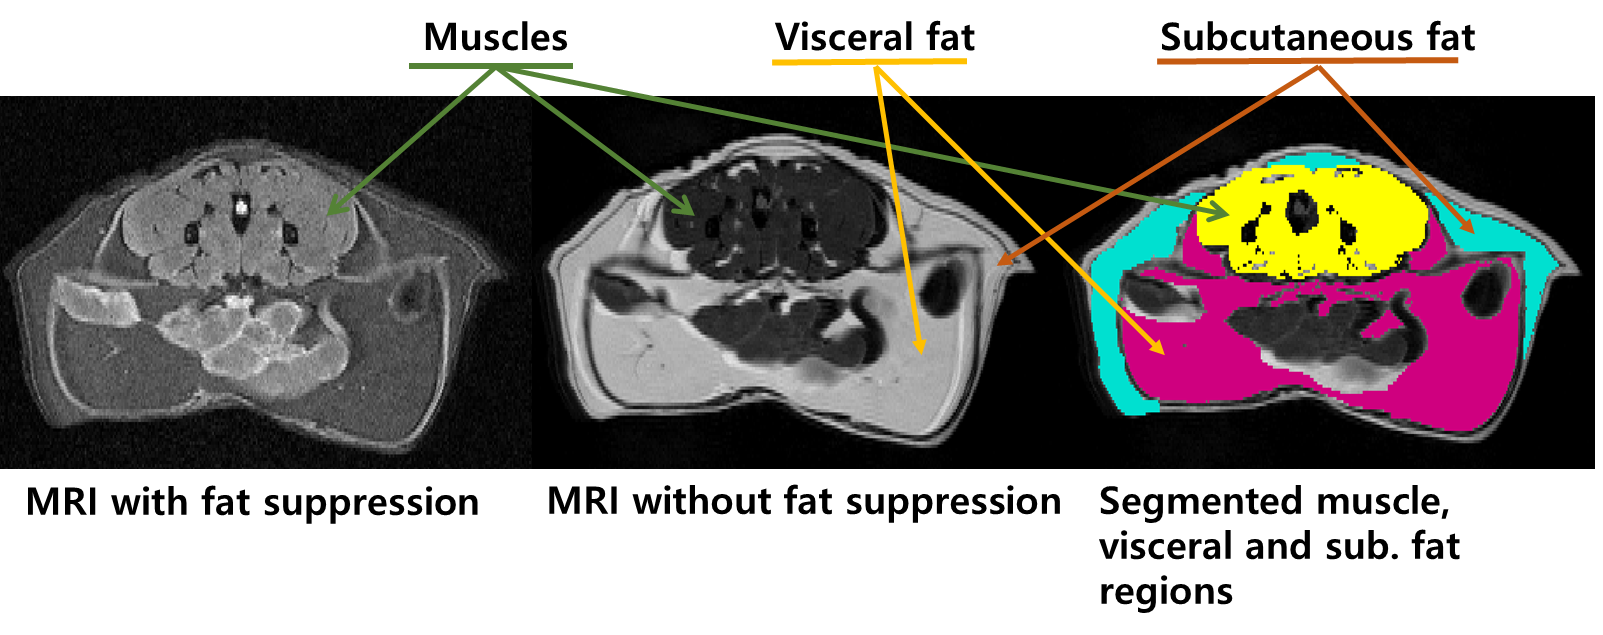
MRI: Using an I.D. 7.2 cm volume coil on a 9.4T Bruker scanner, transverse multi-slice spin-echo images were acquired for whole body. Two sets of images with and without fat-suppression were acquired. Parameters were, TR/TE=1500/20 ms, slice thickness/inter-slice distance=1.2/1.5 mm, and FOV=4.2 x 4.2 cm2 with the matrix size of 342*192. The whole body of a mouse was fully covered with approximately 52 slices, and each slice of with and without fat-suppressed and MRI are shown in Fig 1.
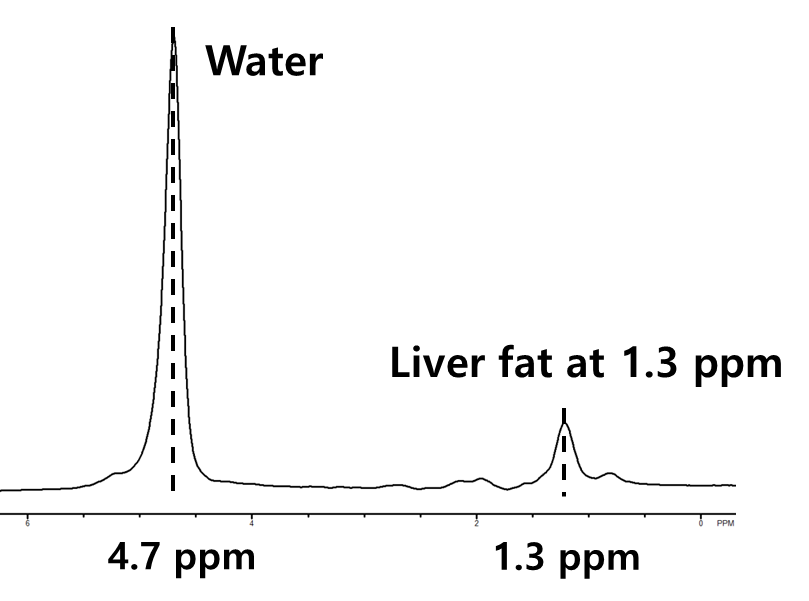
MRS: In order to quantify hepatic lipids [HTG], STEAM spectra were obtained with and without water suppression (TR/TE= 6000/3 ms). Water 1H MRS was employed as an internal reference for quantification [Fig 2].
Data Analysis:
1H MRS: All MRS spectra were processed using NUTS®(Acorn NMR, CA, USA), liver fat percentage (%) was calculated by the methylene peak at 1.3 ppm in water suppressed MRS, relative to the water peak at 4.7 ppm as previously described.4
MRI: All data were quantified using SliceOmatic® program (Tomovision, Canada). Each slice was segmented into muscles, subcutaneous [SFAT] and visceral fat [VFAT], and other tissues. All slices of SFAT, VFAT and muscles were summed to provide the total amount for each mouse.
Statistics: All data were expressed as mean±standard deviation [SD]. Group comparisons were evaluated by unpaired t-test.
RESULTS:
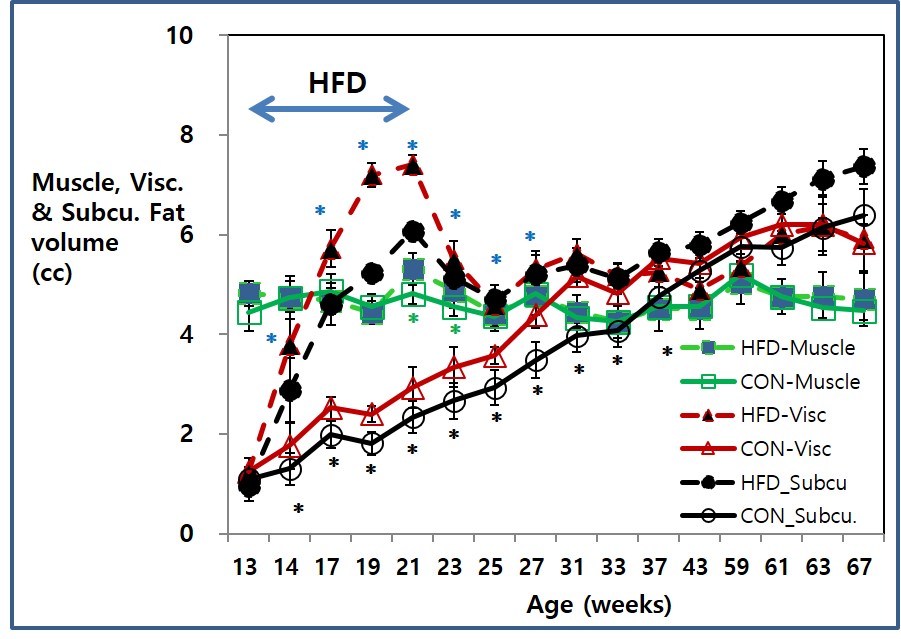
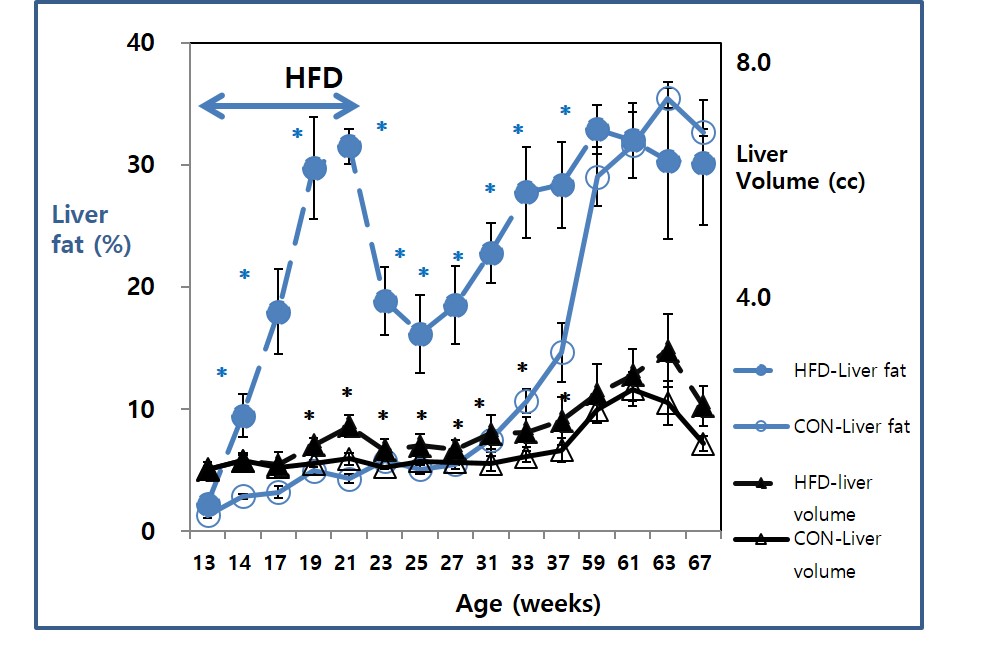
At the baseline, it was found to be no difference in body weight, muscle, VFAT and SFAT in CON vs. HFD in the 2 groups [muscle: 4.45±0.60 vs. 4.82±0.74 cc, VFAT: 1.25±0.56 vs. 1.23±0.56 cc, SFAT: 1.09±0.50 vs 0.96±0.50 cc, respectively]. With the initiation of HFD, VFAT and SFAT, HTG were significantly increased in HDF group together with weight gain, however, muscle mass slightly changed [Fig 3]. At the 8th week of HFD, muscle mass also exhibited a statistical difference as compared to CON [CON vs. HFD: 4.81±0.19 vs. 5.31±0.42 cc, p=0.01]. As shown in Fig 3, the statistical difference in VFAT vanished in 10 weeks after the termination of HFD. Differences in SFAT lasted till up to 43 weeks old [Fig 3]. HTG in HFD group rose up to above 30% at the last week of HFD [CON vs. HFD: 4.3±0.8% vs. 31.5±2.8%, p<0.01], and significantly higher HTG lasted till 37 weeks old [Fig 4].
DISCUSSION:
Long-term effects of a limited duration HFD diet in youth was longitudinally examined in mice as a model for obesity up to 67 weeks old. SFAT, liver volume, and HTG returned to normalcy at ~ 37-43 weeks old (16 - 20 weeks after the termination of HFD), while the difference in muscle mass waned quickly [Fig 3 and 4].CONCLUSION:
Using MRI and 1H MRS, it was found that obesity in youth induced by HFD can have impact on the content of HTG, VFAT and SFAT for a long-term (up to ~ 16 - 20 weeks for HTG and SFAT) even after the termination of HFD.Acknowledgements
This study was supported by the National Research Foundation (NRF of Korea:NRF-2015R1C1A2A01051461).References
1. Stefan N, Ramsauer M, Jordan P, Nowotny B, Kantartzis K, Machann J, et al. Inhibition of 11beta-HSD1 with RO5093151 for non-alcoholic fatty liver disease: a multicentre, randomised, double-blind, placebo-controlled trial. Lancet Diabetes Endocrinol. 2014;2(5):406-16.
2. Makrogiannis S, Serai S, Fishbein KW, Schreiber C, Ferrucci L, Spencer RG. Automated quantification of muscle and fat in the thigh from water-, fat-, and nonsuppressed MR images. J Magn Reson Imaging. 2012;35(5):1152-61.
3. Muller HP, Niessen HG, Kaulisch T, Ludolph AC, Kassubek J, Stiller D. MRI allows for longitudinal quantitative analysis of body fat composition in rats: an analysis of sibutramine-associated changes at the group level. Magn Reson Imaging. 2013;31(7):1150-5.
4. Machann J, Thamer C, Stefan N, Schwenzer NF, Kantartzis K, Haring HU, et al. Follow-up whole-body assessment of adipose tissue compartments during a lifestyle intervention in a large cohort at increased risk for type 2 diabetes. Radiology. 2010;257(2):353-63.
Figures