5654
Enhanced detection of weak metabolites with short initial echo time 2D L-COSY1University of Newcastle, Newcastle, Australia, 2John Hunter Hospital, Australia, 3Hunter Medical Research Institute, Australia, 4HMRI Imaging centre, Hunter Medical Research Institute, Australia, 5University of California Los Angeles, CA, United States, 6University of Newcastle, Australia
Synopsis
The detection of weak neurometabolites such as g-aminobutyric acid (GABA), glutathione (GSH), glycerophosphocholine (GPC), phosphorylethanolamine (PE) with 2D L-COSY can be challenging due to lower concentrations. Moreover, the standard initial echo time (TEinitial) of 30ms yields suboptimal SNR due to shorter T2*. In this study, we compared short TEinitial of 20ms vs 30ms to evaluate improved detection of low concentration metabolites. Our results show a significant increase in SNR with TEinitial of 20ms compared to 30ms. Short TEinitial of 20ms has increased potential in the detection of peaks from weak neurometabolites.
Purpose
2D L-COSY has been found to be a promising spectroscopic tool in the measurement of in-vivo metabolite activity in the assessment of neurological disorders1 and cancer2. In L-COSY, cross peaks from metabolites such as glutamine+glutamate (Glu+Gln=Glx), glutathione (GSH), glycerophosphocholine (GPC), phosphorylethanolamine (PE), N-acetylaspartate(NAA) play an important role in the quantitation in many disease activities. The reliable detection of these metabolites is challenging due to their complex inherent chemical structure and low physiological concentrations3. The latter leads to poor and low cross peak signal intensities. With standard initial echo times (TE), evaluation of these weak metabolites with adequate signal to noise ratio (SNR) can be difficult due to their very short T2*. Although 2D L-COSY technique is able to provide improved spectral dispersion owing to the addition of second dimension to improve spectral separation4, shorter TE can yield higher SNR and increase the sensitivity of detecting a larger number of weak overlapping metabolites5. The purpose of this study was therefore to determine if L-COSY with initial short TE (20ms) can improve the detectability of weak metabolites compared with standard initial TE of 30ms in 2D L-COSY experiments thus enabling of improved detection of weak metabolites.Methods
This study was approved by the local ethics review board and all
subjects were consented in writing. Both in-vitro and in-vivo measurements using initial
TE values of 20 and 30ms 2D L-COSY were performed in the same session without
moving the table on a 3 Tesla MR system (Magnetom Prisma, Siemens Healthcare, VD13D)
equipped with 64 Channel brain coil. Brain MRS phantom6, MRS-HD sphere (GE
Medical Systems, Milwaukee, WI), was used for sequence optimization. It consisted
of the following chemicals: NAA (12.5 mM), creatine hydrate (Cr, 10 mM),
choline chloride (Cho, 3 mM), myo-inositol (mI, 7.5 mM), L-glutamic acid (Glu, 12.5
mM), DL-lactic acid (Lac, 5 mM), sodium azide (0.1%), potassium phosphate
monobasic (KH2PO4, 50 mM), sodium hydroxide (NaOH, 56 mM) and 1 ml/l Gd-DPTA
(Magnevist). Data from three healthy volunteers were obtained for in-vivo evaluation.
2D L-COSY MRS was acquired from the posterior cingulate gyrus (PCG) with 3x3x3
cm3 voxel employing first TEinitial of 30ms and followed
by TEinitial of 20ms, TR 1.5sec, eight averages per increment,
bandwidth 2000Hz, t1 increment of 0.8ms, vector size of 2048 points, RF offset
frequency was set on 2.3ppm, and number of increments was 96. Raw spectral data was taken offline and signals
from different coil elements were combined and concatenated to produce a 2D
time-domain array (96x2048) which was then processed and analysed with Felix
2007 software (Accelrys, San Diego, CA).
The signal intensity of selected diagonal and cross peaks as well as
background noise at (0,0) ppm (noise region dimensions were 0.135 ppm in F2 and 0.019ppm in F1) were
measured for each experiment. Mean SNR of selected peaks (peak intensity/noise)7, as well as % SNR differences,
were calculated.Results and Discussion
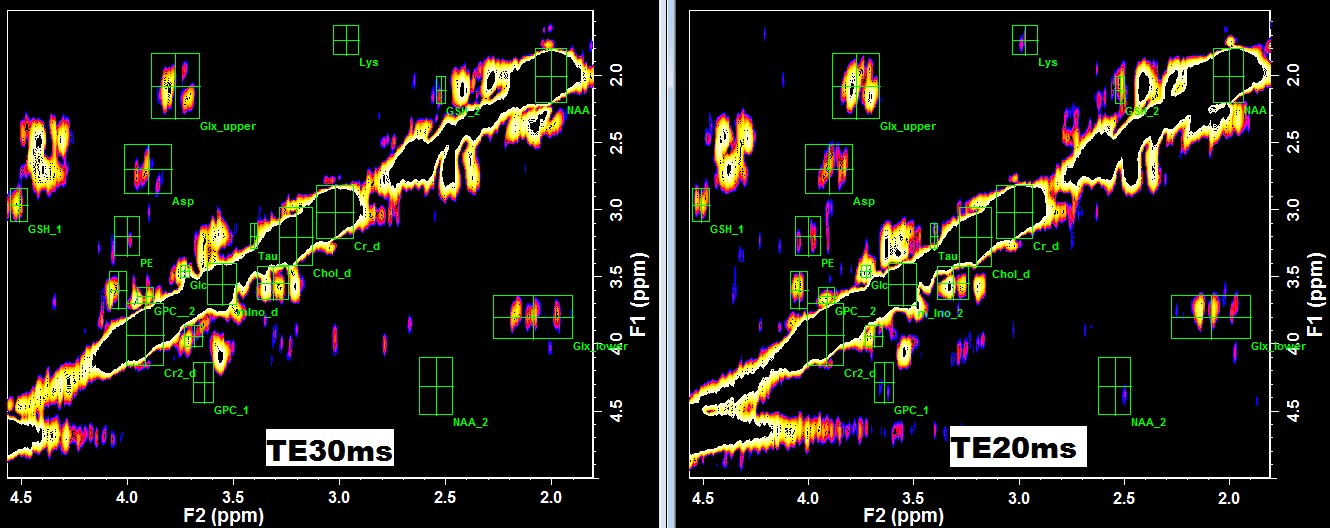
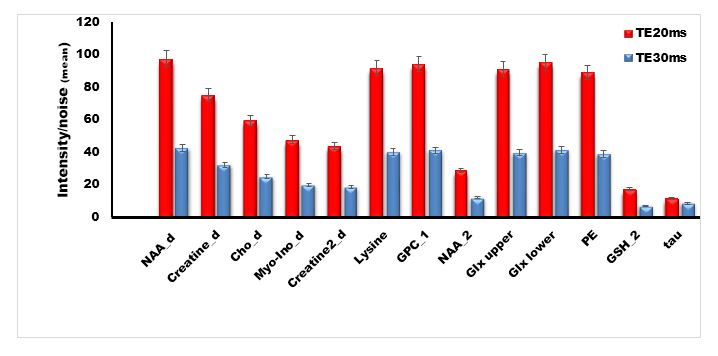
Figure 1 shows a COSY spectrum from a healthy subject using TE20ms and TE30ms. The mean and the percentage mean difference in peak SNR betweenTE20 and TE30 showed remarkable increase (min increase= 35% for tau, max increase=141% for NAA) in SNR (Figure 2) for TE20, both for the diagonal peaks (NAA, Cr, Cho, mI and lipid) and cross peaks (Glx upper/lower, lysine, GSH_2, GPC_1, PE, NAA_2). In vitro experiments also showed similar trend in increasing SNR for all major diagonal and cross peaks, but to lesser extent than in vivo results. Initial TE is an important parameter in L-COSY and it determines the extent of signal loss depending on characteristic T2* values. SNR determines the amount of signal that is available for the optimum detection of metabolites that have low concentrations. In this study, the SNR for all peaks increased with short TE of 20ms. This is clearly evident (Figure 1) in cross peaks of lysine, NAA_2, GPC_1, taurine (tau) and PE as these are hardly detected with TE 30ms. In summary, 2D L-COSY with short TE of 20ms has potential in the improved detection of cross peaks from weak metabolites which is helpful in the evaluation of complex diseases processes.Acknowledgements
References
1. Ramadan S, Andronesi OC, Stanwell P, et al. Use of in vivo two-dimensional MR spectroscopy to compare the biochemistry of the human brain to that of glioblastoma. Radiology 2011;259(2):540-549.
2. Ramadan S, Arm J, Silcock J, et al. Lipid and Metabolite Deregulation in the Breast Tissue of Women Carrying BRCA1 and BRCA2 Genetic Mutations. Radiology 2015;275(3):675-682.
3. Fuchs AH, Boesiger, A P. Special COSY at 7T. Proceedings of the joint 18th annual scientific meeting of ISMRM and the 27th annual scientific meeting of ESMRMB, Stockholm, Sweden, May 1st-7th 2010: 92 2010.
4. Thomas MA, Hattori N, Umeda M, et al. Evaluation of two-dimensional L-COSY and JPRESS using a 3 T MRI scanner: from phantoms to human brain in vivo. NMR Biomed 2003;16(5):245-251.
5. Cianfoni A, Law M, Re TJ, et al. Clinical pitfalls related to short and long echo times in cerebral MR spectroscopy. J Neuroradiol 2011;38(2):69-75.
6. Schirmer T, Auer DP. On the reliability of quantitative clinical magnetic resonance spectroscopy of the human brain. NMR in biomedicine 2000;13:28-36.
7. Skelton NJ, Palmer AG, Akke M, et al. Practical Aspects of Two-Dimensional Proton-Detected 15N Spin Relaxation Measurements. Journal of Magnetic Resonance, Series B 1993;102(3):253-264.
Figures