5653
Microstructural dynamic changes in ischemic stroke in humans measured with diffusion-weighted magnetic resonance spectroscopy at 3 T1Brain and Spine Institute (ICM), Center for Neuroimaging Research (CENIR), Paris, France, 2UPMC Paris 6, INSERM, U1127; CNRS, UMR 7225, Paris, France, 3Service des Urgences Cérébrovasculaires, Hòpital Pitié-Salpétrière, Paris, France, 4Center for Magnetic Resonance Research and Department of Radiology, University of Minnesota, Minneapolis, MN, United States, 5C. J. Gorter Center for High Field MRI, Department of Radiology, Leiden University Medical Center, Leiden, Netherlands
Synopsis
Diffusion-weighted 1H magnetic resonance spectroscopy (DW-MRS) probes the diffusion properties of metabolites, which are differentially compartmentalized in brain tissue and are thus more specific than water molecules to the intra-cellular environment. The aim of this study was to measure water and metabolite diffusion in the human brain in the acute, sub-acute and choronic stage of ischemic stroke, in order to better characterize the microstructural dynamic changes ongoing at different stages of the disease, in both infarcted and periferal regions, by disentangling neuronal, glial and extra-cellular pathological processes.
Purpose
Diffusion-weighted
imaging is a major tool for detection and characterization of ischemic stroke1.
However, the specific mechanisms underlying the severe changes of water
apparent diffusion coefficient (ADC) in stroke remain unclear2. Diffusion-weighted
1H magnetic resonance spectroscopy (DW-MRS) probes the diffusion
properties of metabolites, which are differentially compartmentalized in brain
tissue, and are thus more specific than water to the intra-cellular environment3-6.
The goal of this study is to elucidate the pathological phenomena
involved in the acute, sub-acute, and chronic stage of the disease, by
disentangling glial, neuronal and extra-cellular processes. To achieve this
goal, we investigate water and metabolite ADC changes in the human brain at
different time points following ischemic stroke, in both infarcted and non-infarcted
hemispheres.Methods
Patients: Five patients with ischemic stroke (mean age = 62yrs) were scanned on a 3T whole body Siemens scanner. Of these, two patients were scanned at visit 1 (V1: between day 2 and 14 post-stroke) and at V2 (between day 21 and day 35), one was scanned at V2 and at V3 (between day 90 and 120), and two were scanned at V1.
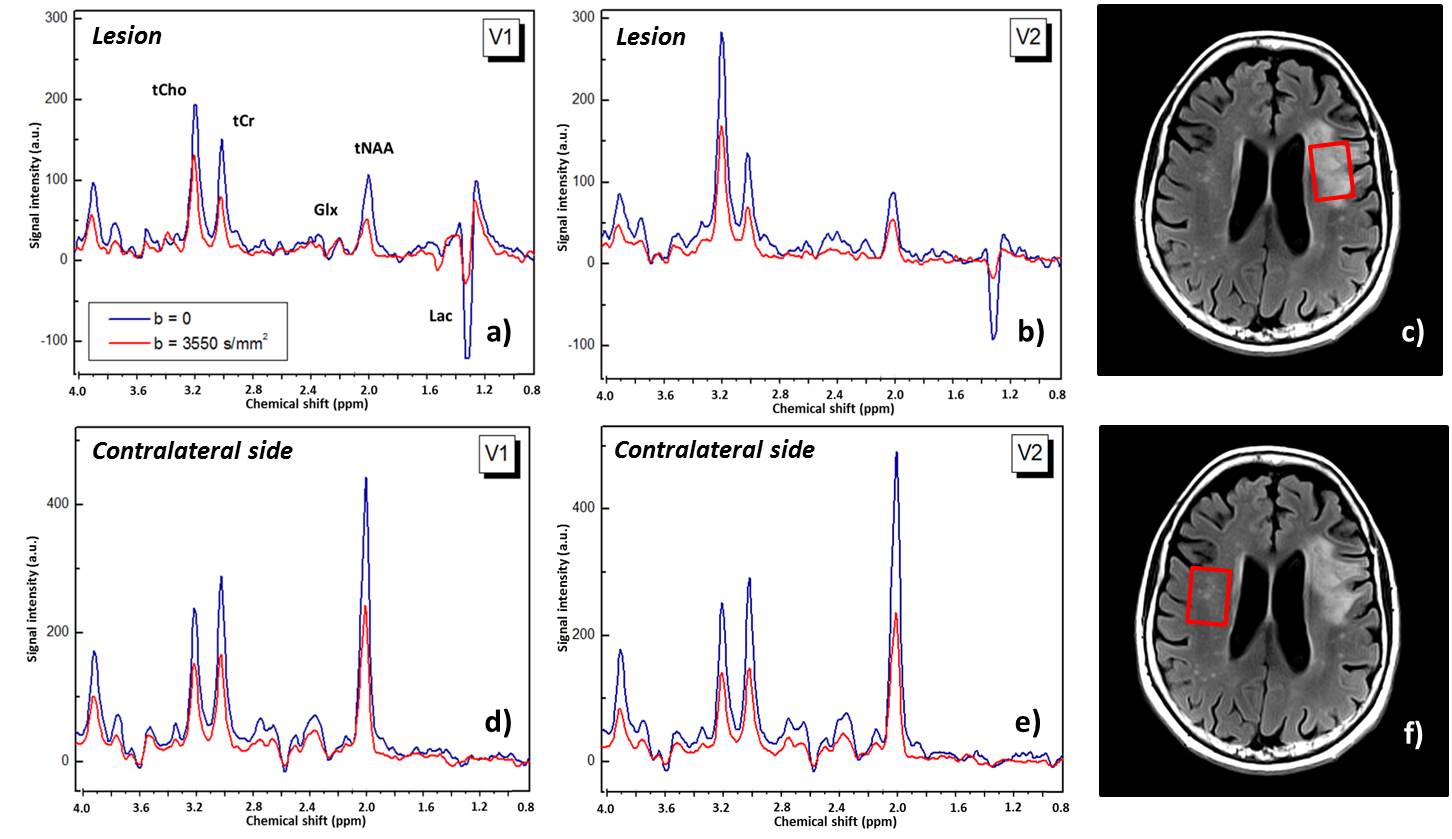
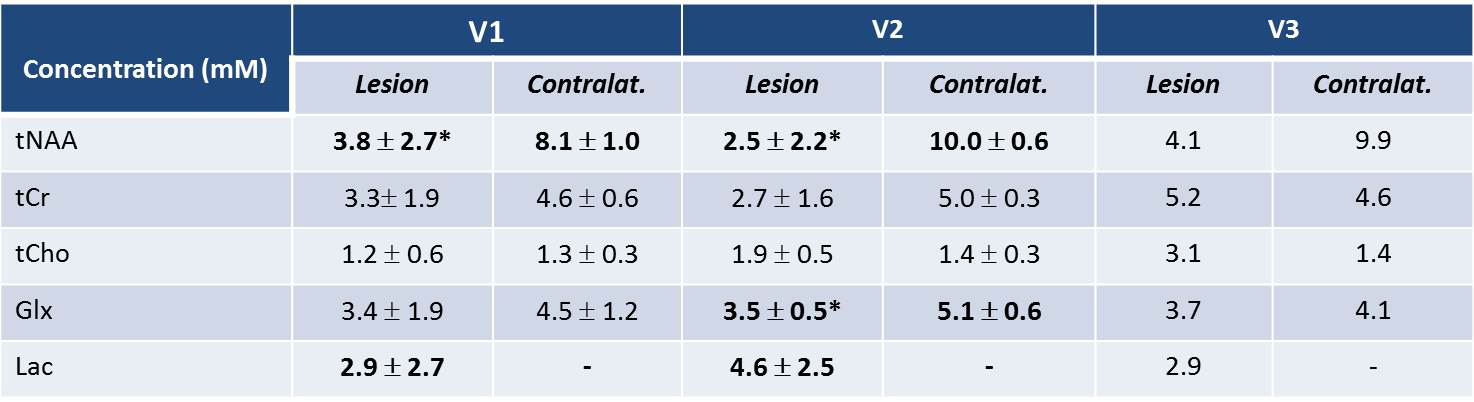
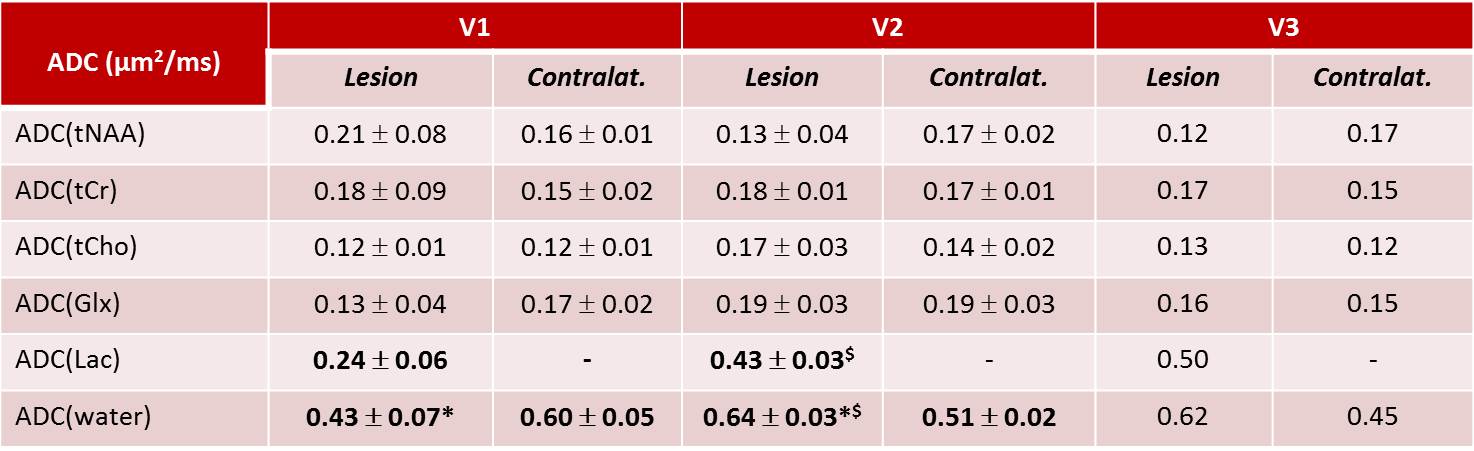
DW-MRS protocol: A single voxel diffusion-weighted semi-LASER sequence was employed to acquire DW-MRS data from which concentrations and ADCs of N-acetylaspartate+N-acetylaspartylglutamate (tNAA), total creatine (tCr), choline compounds (tCho), glutamate + glutamine (Glx), lactate (Lac), and water were obtained. Acquisition parameters: diffusion time 50ms, gradient strength 60mT/m, TE/TR 100ms/3 cardiac cycles, 16 averages. Three VOIs of dimensions 25(AP)x20(RL)x20(FH) mm3 were located respectively within the lesion (Fig.1c), in the contralateral side (Fig.1f), and in the ipsilateral side outside the visible lesion. Diffusion gradients were applied in three orthogonal directions with b = 3550 s/mm2. Phase and frequency corrections on individual scans were performed before summation using NAA or tCho peak. Metabolite and water ADCs were estimated from signal decay induced by the diffusion weighting, averaged on the 3 directions. Metabolite concentrations were quantified with LCModel7 using the water reference. Paired t-tests were used to evaluate preliminary differences between DW-MRS metrics.
Results
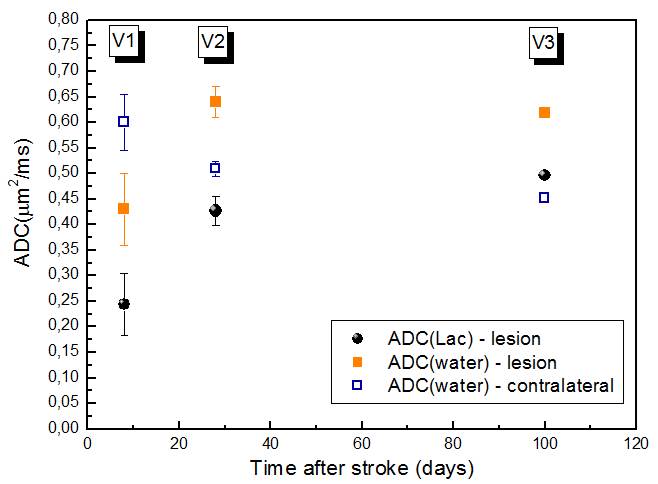
Fig.1 shows spectra measured within the lesion (a, b) and in the contralateral side (d, e) of one patient, without and with diffusion-weighting, and for two examinations V1 and V2. At V1 and V2, a significant decrease in the tNAA concentration (p=0.020 and p=0.018, respectively) and an increase in the Lac concentration were confirmed8 in the lesion compared to contralateral VOI (Table1). Lac was not detectable outside the visible lesions. At V2, a decrease in the tNAA concentration was observed also in the ipsilateral VOI (p=0.077) (data not shown), and a decrease in the Glx concentration was detected in the lesion (p=0.013). ADC(water) was significantly lower in the lesion compared to contralateral region (p=0.008) at V1, and was higher at V2 (p=0.005) and V3. ADC(Lac) was higher than the ADC of all other metabolites (Table2), consistent with the presence of this metabolite also in the extra-cellular space9,10. Interestingly, ADC(Lac) in the lesion showed a significant increase of about 80% at V2 compared to V1 (p=0.006), and its value remained stable at V3. A trend towards an increase of ADC(tCr) and ADC(tCho) in lesion was observed at V2 and V3. No significant changes in ADC(NAA) or ADC(Glx) were detectable, possibly due to the small group size.Discussion
Our preliminary results show evidence for the first time of an increase of ADC(Lac) within the ischemic lesion in the subacute compared to the acute phase of the disease, compatible with a shift of this metabolite from the intra- to the extra-cellular space due to membrane breakdown. The behavior of ADC(Lac) with time is similar to that of ADC(water) (Fig.2), suggesting common mechanisms for the abnormal diffusion of the two molecules, such as initial axonal beading2, apoptosis, and increased tortuosity of extra-cellular space, followed by inflammation and necrosis in a later stage of the disease. The increase of ADC(tCr) and ADC(tCho), if confirmed, would also be compatible with inflammation and cellular leaking due to necrosis11. The full study will include 24 patients. We expect that the behavior of ADCs of tNAA and of tCho, mainly compartmentalized in neurons and glial cells respectively, will shed light on the specific mechanisms underlying the time course of water and Lac diffusion. All the metrics will be correlated with clinical scores and outcome.Conclusion
Cerebral vascular disorder is one of the most fatal diseases. By monitoring the metabolite diffusion properties, we will be able to follow the temporal evolution of the ongoing cellular damage, with the aim of translating a better understanding of the disease pathogenesis to beneficial treatment strategies.Acknowledgements
The research leading to these results received funding from the programs 'Institut des neurosciences translationnelle' ANR-10-IAIHU-06 and 'Infrastructure d’avenir en Biologie Santé' ANR-11-INBS-0006. MM acknowledges support of following NIH grants: BTRC P41 EB015894, and P30 NS076408.References
1. Schlaug G et al, Neurology. 1997; 49(1):113-9; 2. Budde M and Frank JA, Proc Natl Acad Sci U S A. 2010; 107(32):14472-7; 3. Nicolay K et al, NMR Biomed. 2001;14(2):94-111; 4. Abe O et al, J Cereb Blood Flow Metab. 2000;20(4):726-35; 5. Van der Toorn et al, Magn Reson Med. 1996;36(6):914-22; 6. Wick et al, Stroke. 1995;26:1930-1934; 7. Provencher SW, NMR Biomed. 2001; 14(4): 260-4; 8. Munoz Maniega S et al, Neurology. 2008;71(24):1993-9; 9. Pfeuffer J et al. J Cereb Blood Flow Metab. 2000 Apr;20(4):736-46; 10. Harada M et al, NMR Biomed. 2002 Feb;15(1):69-74; 11. Zheng DD et al, AJNR Am J Neuroradiol. 2012 Mar;33(3):563-8.
Figures