5648
Identification of Prostate Cancer with MR Spectroscopic Imaging and Diffusion-weighted Imaging at 3 Tesla1Medical Physics, Memorial Sloan Kettering Cancer Center, New York, NY, United States, 2Medical Physics, Memorial Sloan Kettering Cancer Center, 3Epidemiology and Biostatistics, Memorial Sloan Kettering Cancer Center, 4Pathology, Memorial Sloan Kettering Cancer Center, 5Radiology, Memorial Sloan Kettering Cancer Center
Synopsis
The aims of our study were to retrospectively measure metabolite ratios and apparent diffusion coefficient values for benign and malignant PZ tissue at 3T, develop statistically-based rules for classifying benign and malignant PZ tissue, and assess the rules’ performance, using whole-mount step-section pathology as the reference standard.
PURPOSE: To retrospectively measure metabolic ratios from MR spectroscopic imaging (MRSI) and mean apparent diffusion coefficient (ADC) values from diffusion-weighted imaging (DWI) in benign and malignant peripheral zone (PZ) tissue at 3.0 Tesla (T), to assess the associations between imaging parameters and malignancy, and to develop and test a model for classifying benign and malignant PZ tissue using whole-mount step-section pathology as the reference standard.
METHODS: This HIPAA-compliant, IRB-approved study included 67 men (median age, 61 years; range, 41–74 years) with biopsy-proven prostate cancer who underwent 3T endorectal MRI, including MRSI and DWI, before surgery and had whole-mount histopathology showing ≥1 PZ lesion >0.1 cm3. DW images were obtained by using single-shot spin-echo echo-planar imaging with a pair of rectangular gradient pulses along three orthogonal axes in transversal orientation to include the whole prostate with the following parameters: TR/TE=3500–6800/74.1–86.2 msec; section thickness, 3 mm; no intersection gap; FOV, 12–16 cm; and matrix, 128×128. The b-values were 0 and 1000 sec/mm2. MRSI data were acquired with the acquisition software (PROSE; General Electric Medical Systems, Milwaukee, WI) provided by GE under a research agreement, with a HIPAA-compliant, IRB-approved protocol. Prescription selection was performed on axial T2W images. Acquisition parameters were TR/TE=1300/85 msec; NEX=1; 12´8 phase encoding steps, FOV=11´5.5 cm2, 6.9-mm acquisition slice thickness, and 2.17-cm3 nominal spatial resolution. To address J-modulation of the citrate signal measured at 3T, the MLEV-PRESS sequence proposed by Chen et al. was used (1), which resulted in the citrate signal being upright at TE=85 msec. Choline/citrate, polyamines/choline, polyamines/creatine, and (choline+polyamines+creatine)/citrate ratios from voxels in regions of benign or malignant PZ tissue (identified from pathological slides) were averaged for each region. ADC values were also averaged at the same locations used for MRSI in benign and malignant PZ regions. Areas assigned Gleason grades 3 were outlined in green, and areas assigned Gleason grade 4 (and above) were outlined in black. The fraction (expressed as a percentage) of the area of Gleason grade ≥4 disease to the total area of the lesion was measured on histopathology maps. The values ranged from 0 (for 3+3 lesions) to 100% for (≥4+4 lesions). Patients were randomly split into training and test sets; using classification and regression tree (CART) analysis, classification rules were generated for separating benign from malignant regions and assessed on the testing set using sensitivity and specificity. Associations between imaging metrics and cancer were also evaluated using generalized estimating equations (GEE) and the area under the receiver operating characteristic curve (AUC).
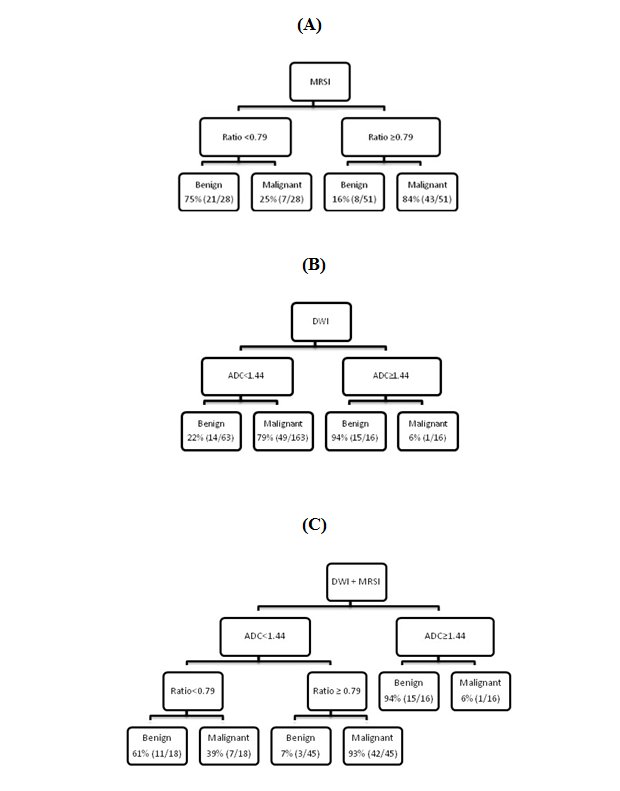
RESULTS: In CART analysis, all MRSI parameters were entered and the final tree contained the (choline+polyamines+creatine)/citrate ratio (Fig. 1a). The lesion was considered benign if the ratio was less than 0.79 and malignant if greater than or equal to 0.79. In the DWI only tree (Fig. 1b), a lesion was considered malignant if ADC was less than 1.44×10⁻³ mm2/s and benign if ADC was greater than or equal to 1.44×10⁻³ mm2/s. In the final tree both ADC and the MRSI ratio remained as splits (Fig. 1c). The sensitivity and specificity [95% confidence interval] for the test set were 0.81 [0.66-0.91] and 0.82 [0.66-0.93], respectively, with MRSI, 0.98 [0.89-1.00] and 0.51 [0.34-0.68], respectively, with DWI and 0.79 [0.64-0.89] and 0.90 [0.76-0.97], respectively, with MRSI+DWI. In the testing set, ADC alone was a significant predictor of cancer (OR: 0.83, 95% CI: 0.76-0.91, p<0.001). When MRSI ratio was added to the model, ADC remained significant (OR: 0.84, 95% CI: 0.77-0.91, p<0.001), and MRSI ratio was also significantly associated with cancer status (OR: 1.06, 95% CI: 1.03-1.10, p<0.001). In univariate analysis, all MRSI parameters and ADC were significantly associated with percentage of Gleason grade ≥4 tumor. Lesions with higher choline/citrate, polyamines/creatine, and (choline+polyamines+creatine)/citrate ratio and lower polyamines/choline, and lower ADC (negative Beta values) were more likely to have a greater percentage of Gleason grade ≥4 tumor (P<0.05 for all cases).
DISCUSSION: We found that DWI alone had very high sensitivity with low specificity. We also found that the specificity of MRSI in the detection of PZ cancer was high and MRSI + DWI had the highest combined sensitivity and specificity; this is consistent with the results of a study performed at 1.5T by Scheidler et al. (2), in which MRSI of definite cancer had reasonably good specificity (75%) but lower sensitivity (63%).
CONCLUSION: We developed classification rules benign and malignant PZ tissue at 3T using MRSI, DWI, and MRSI+DWI and demonstrated the potential usefulness of combining MRSI and DWI.
Acknowledgements
No acknowledgement found.References
1. Chen AP, Cunningham CH, Kurhanewicz J, et al. High-resolution 3D MR spectroscopic imaging of the prostate at 3 T with the MLEV-PRESS sequence. Magnetic resonance imaging. 2006; 24(7):825-32. 2. Scheidler J, Hricak H, Vigneron DB, et al. Prostate cancer: localization with three-dimensional proton MR spectroscopic imaging--clinicopathologic study. Radiology. 1999; 213(2):473-80.Figures