5643
Can we predict the chemotherapy outcomes and efficacy - metabolomics approach for predicting response to anticancer drugs: in vitro 1H MRS of living human melanoma and bladder carcinoma at 9.4T1Center for Biomedical Imaging, EPFL / CIBM, Lausanne, Switzerland
Synopsis
The number of patients diagnosed with cancer is increasing. Therefore the ability to predict tumor response to therapeutic agents remains a major challenge. Tumor cell metabolism is currently examined by 1H MRS with the aim of getting more insight into the differences between normal and neoplastic tissues, characterize their metastatic potential/finding prognostic markers, and monitoring the effect of therapies. In this study we demonstrate the feasibility of characterizing in-vitro living cells and present changes in the metabolic profile of WM793 and T24 cells lines subjected to chemotherapy. These results show promise for more personalized treatment protocols for cancer patients.
Purpose
The number of patients diagnosed with cancer is increasing. The ability to predict tumor response to therapeutic agents remains a major challenge and have clinical value. Emerging evidence implicates there is tumor-to-tumor/patient-to-patient variability in response to chemotherapy due to differing local environments.1 Treatment of an individual patient is a critical consideration in a physician’s choice of drug therapy.
Screening of patient’s biopsies derivate cells have potential for personal medicine. Unraveling the cell molecular interactions is of prime importance for understanding physiological processes. Magnetic resonance spectroscopy (MRS) of intact cells gives the possibility to revile information about cell-cell, cell-extracellular matrix and cell-drug interactions.2,3
To investigate whether a relationship between
chemotherapy-associated adverse events and treatment efficacy exists, we have
analyzed variability in response to chemotherapy in human melanoma WM793 and
bladder carcinoma T24 cells. Studies in intact cultured cells that maintain
cells under controlled conditions are a unique tool for highlighting aspects of
metabolism.
Methods
The WM793 and T24 cells were grown in 175cm2 TC flasks (Eppendorf) at 37oC in 95% humidified air containing 5% CO2 incubator. The applied culture medium was RPMI 1640 (pH 7.4) supplemented with 10% of Fetal Bovine Serum and 1% of antibiotics (50.5u/ml penicillin, 50.5μg/ml streptomycin, 101μg/ml neomycin) (Sigma).Each cell line was subjected to two anticancer drug for 30h.
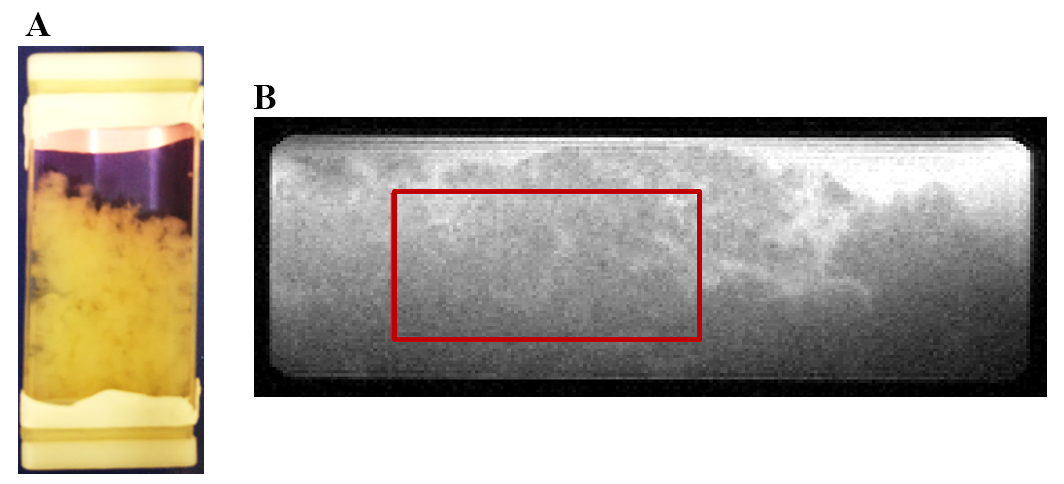
The drugs and doses were chosen based on the Drugs Approved for Different Types of Cancer published by National Cancer Institute.4 WM793 cells: Combimetinib 40nM and Dacarbazine 1.31mM, T24: Belinostat 20µM and Cisplatin 119.1µM.Cells were cultured at high density, trypsinized and transferred into 15mL tube and centrifuged at 2000RPM for 2min at RT. The cells pellet was transferred into the designed setup. The tube with cells was filled with the full RPMI medium (Figure 1A).
Experimental setup: 9.4T/26cm horizontal magnet with a 12cm gradient coil insert (400mT/m, 120µs) (Varian/Agilent). A home-built surface coil of 15mm-diameter was used as transceiver. Localization of cells was performed with a fast spin-echo image and used to place the 1H-MRS acquisition voxel (Figure 1B). Spectroscopy was acquired with the SPECIAL sequence.5 Field inhomogeneity was corrected using the FASTMAP protocol. Quantified with LCModel using water signal as reference.
Results
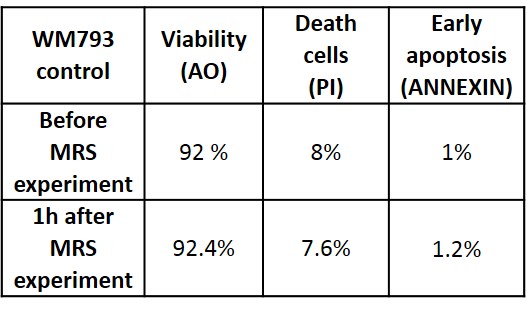
The acquisition time of 30min allowed to acquire high quality spectra of intact cells with S/N=26 and linewidth of 8Hz measured on the water resonance. The relatively short acquisition time is believed to minimize the eventual exposure of cells to high hypoxia. The viability test after MRS study confirmed high survival rate (Figure 2).
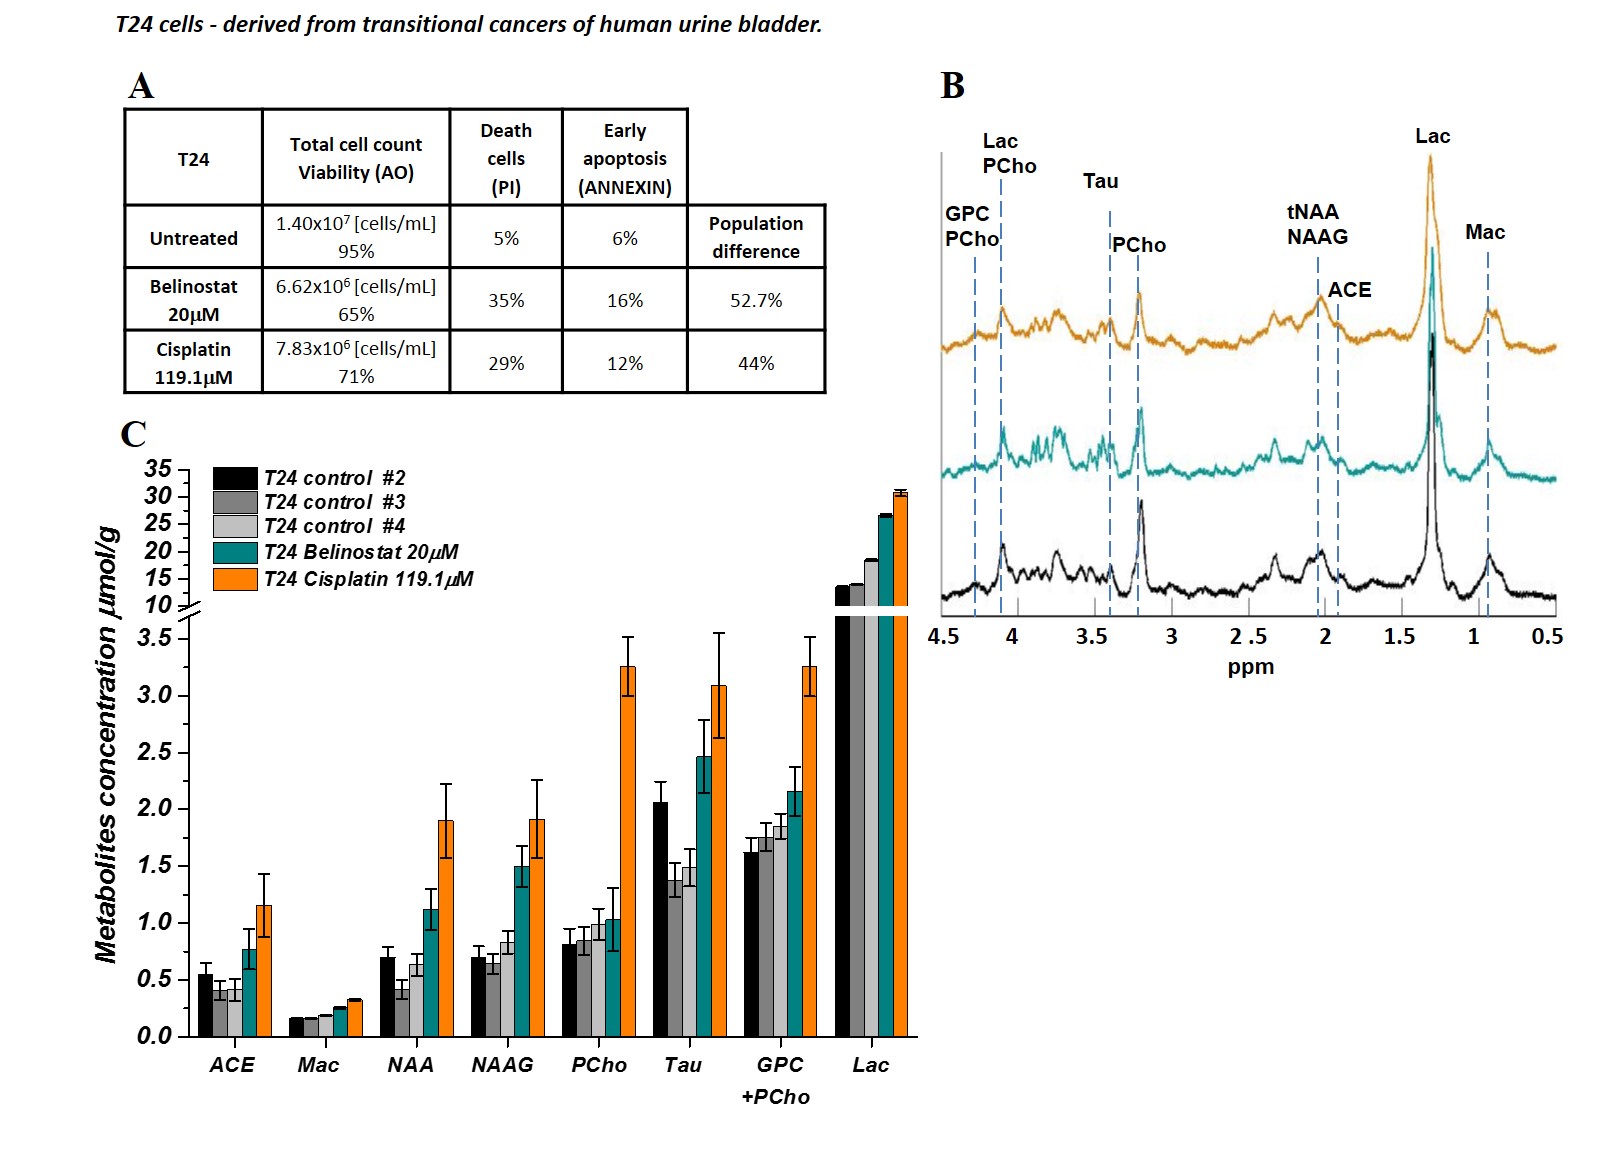
MRS signals intensity of NAA, NAAG, lactate and choline based metabolites of T24 cells treated with Cisplatin increased significantly. The NAA, NAAG, acetate and lactate levels increased by 2 and choline based metabolites 3 fold while in the presence of Belinostat increase of the NAA and NAAG concentration was less pronounced and choline remain unchanged (Figure 3C).
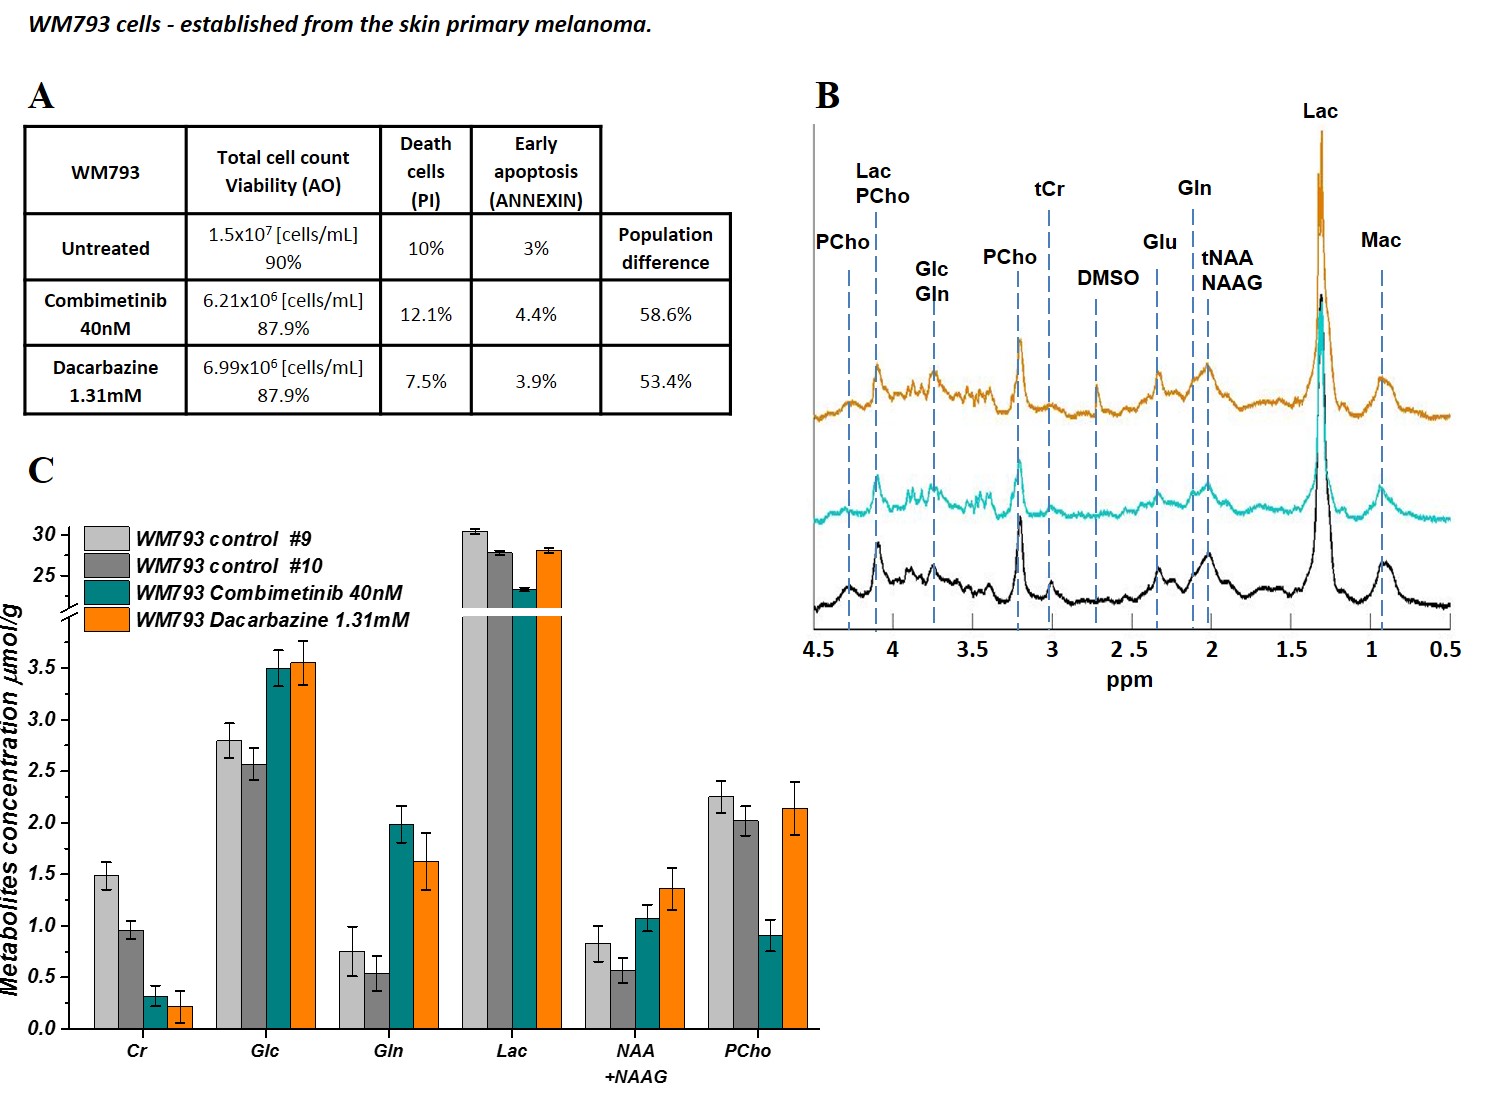
WM793 cells subjected to Combimetinib and Dacarbazine the NAA, NAAG, lactate and choline remain unchanged while Cr concentrations decreased ~3 fold. Glucose and glutamine levels increased significantly (Figure 4C). In parallel to MRS measurements the inhibition of cell growth was examined (Figure 3-4).
Discussion
Altered metabolism is an emerging hallmark essential to cancer’s biology.6 Many years, the efficacy of cancer drugs in cell culture has been measured via inhibition of cell growth or death induction but one cannot capture the underlying complexity of responses.
Recently NAA was reported as one of the potential marker of ovarian/prostate and lung cancer. Its elevated level may be associated with worsening prognosis.7-12Choline based metabolites are important for many cell functions including proliferation and cell membrane synthesis and is characteristically elevated in malignant tumors. The increased levels confers resistance in cancer cells and are associated with poor survival.13-15
Lactate may reflect tumor glucose metabolism. An increased glucose metabolism is an outstanding biochemical characteristic of cancer tissue. Glutamine is a nutrient required for the survival and growth of a potentially large subset of tumors.16 Therefore lactate and glutamine levels are associated with a high risk of metastasis.16-18
Conclusions
These results suggest that the surviving chemotherapy cancerous cells may become more invasive and metastatic. Therefore testing available anticancer drug on patient biopsies derived cells prior to subjecting patient to chemotherapy could revile the probable chemotherapy outcomes and avoid unnecessary patient toxification.Acknowledgements
Supported by the UNIL, UNIGE, HUG, CHUV, EPFL, Leenards and Jeantet Foundation.References
1. Kessler DA, Austin RH, Levine H. “Resistance to chemotherapy: patient variability and cellular heterogeneity.” Cancer Res. 2014 Sep 1;74(17):4663-70. doi: 10.1158/0008-5472.CAN-14-0118. (2014). 2. Miller G: Is pharma running out of brainy ideas? Science 2010,329:502-504.
3. Pampaloni F, Reynaud EG, Stelzer EHK: The third dimension bridges the gap between cell culture and live tissue. Nat Rev Mol Cell Biol 2007, 8:839-845.
4. https://www.cancer.gov/about-cancer/treatment/drugs/cancer-type
5. Mlynárik V, Gambarota G, Frenkel H, Gruetter R. Localized short-echo-time proton MR spectroscopy with full signal-intensity acquisition. Magn Reson Med. 2006 Nov;56(5):965-70.
6. D. Hanahan, R.A. Weinberg, Hallmarks of cancer: the next generation, Cell 144 (2011) 646-674. 7. Tzu-Fang Lou et al. Cancer-Specific Production of N-Acetylaspartate via NAT8L Overexpression in Non–Small Cell Lung Cancer and Its Potential as a Circulating Biomarker, CAPR-14-0287
8. Hascalik S, Celik O, Sarac K, Alkan A, Mizrak B. Clinical significance of Nacetyl-L-aspartate resonance in ovarian mucinous cystadenoma. Int J Gynecol Cancer 2006;16:423–6.
9. A. Sreekumar et al., Metabolomic profiles delineate potential role for sarcosine in prostate cancer progression, Nature 457 (2009) 910-914.
10. M.Y. Fong, J. McDunn, S.S. Kakar, Identification of metabolites in the normal ovary and their transformation in primary and metastatic ovarian cancer, PLoS One 6 (2011) e19963.
11. E. Kolwijck, R.A. Wevers, U.F. Engelke, J. Woudenberg, J. Bulten, H.J. Blom, L.F. Massuger, Ovarian cyst fluid of serous ovarian tumors contains largequantities of the brain amino acid N-acetylaspartate, PLoS One 5 (2010) e10293.
12. E.A. Boss, S.H. Moolenaar, L.F. Massuger, H. Boonstra, U.F. Engelke, J.G.de Jong, R.A. Wevers, High-resolution proton nuclear magnetic resonance spectroscopy of ovarian cyst fluid, NMR Biomed 13 (2000) 297-305.
13. E. Iorio, A. Ricci, M. Bagnoli, M.E. Pisanu, G. Castellano, M. Di Vito, E. Venturini, K. Glunde, Z.M. Bhujwalla, D. Mezzanzanica, S. Canevari, F. Podo, Activation of phosphatidylcholine cycle enzymes in human epithelial ovarian cancer cells, Cancer Res 70 (2010) 2126-2135.
14. A. Ramirez de Molina, R. Gutierrez, M.A. Ramos, J.M. Silva, J. Silva, F. Bonilla,J.J. Sanchez, J.C. Lacal, Increased choline kinase activity in human breastcarcinomas: clinical evidence for a potential novel antitumor strategy,Oncogene 21 (2002) 4317-4322.
15. E. Rysman et al., Denovo lipogenesis protects cancer cells from free radicals and chemotherapeutics by promoting membrane lipid saturation, Cancer Res 70(2010) 8117-8126.
16. Christopher T. Hensley, Ajla T. Wasti, and Ralph J. DeBerardinis, Glutamine and cancer: cell biology, physiology, and clinical opportunities, The Journal of Clinical Investigation, Volume 123, Number 9, Sept. 2013
17. . Schwickert G, Walenta S, Sundfør K, Rofstad KE, Mueller-Klieser W. Correlation of high lactate levels in human cervical cancer with incidence of metastasis. Cancer Res 1995;55:4757–4759.
18. Hajime Yokota et al., Lactate, Choline, and Creatine Levels Measured byVitro1H-MRS as Prognostic parameters in Patients With Non-Small-Cell Lung Cancer; JOURNAL OF MAGNETIC RESONANCE IMAGING 25:992–999 (2007)
Figures