5642
In vivo measurement of metabolic changes associated with chick embryo development using 1H-NMR spectroscopy at 14.1 TeslaAntoine Cherix1, Brodier Laurent2,3, Jean-Marc Matter2,3, and Rolf Gruetter1,4,5
1Laboratory for Functional and Metabolic Imaging (LIFMET), Ecole Polytechnique Fédérale de Lausanne, Lausanne, Switzerland, 2Department of Biochemistry, University of Geneva, Geneva, Switzerland, 3Department of molecular biology, University of Geneva, Geneva, Switzerland, 4Department of Radiology, University of Geneva, Geneva, Switzerland, 5Department of Radiology, University of Lausanne, Lausanne, Switzerland
Synopsis
1H-MRS was used to study the metabolic changes associated with development of the neural tissue in vivo longitudinally. Different tissues (yolk, eye and vitreous body) of developing chickembryos were scanned at three different stages (E3, E6 and E8) for metabolic quantification. As expected, results indicate that a critical juncture appears between stages E3 and E6 in terms of energetic status of the embryo.
Introduction
1H
Magnetic Resonance Spectroscopy (1H MRS) allows to investigate
metabolic status of living tissues in a non-invasive manner, which renders it suited
for studying development. Chick embryos have shown to be very useful tools to
study retinal development, given the high level of complexity of this organ in
these animals. Previous findings have suggested that a metabolic switch occurs
in the neural development of this model between embryonic stages E3 and E6 in
which mitochondria have been involved (unpublished data). The aim of the
present study was thus to investigate the different 1H-MRS metabolic
profiles present in the egg at early development and to quantify visible
metabolites.Methods
Hen eggs (n=3) were scanned at three embryonic stages (E3, E6 and E8) in a horizontal 14.1T/26cm Varian magnet (Agilent Inc., USA). Eggs were maintained at hatching temperature (37-37.5°C) during the scans using circulating water heating. A homemade 1H quadrature surface coil fitting the shape of the egg was placed as closest to the chick embryo (i.e. on the top surface). T2-weighted FSE images were used for localization and proton spectra were acquired with the STEAM sequence (TE/TR=2.8/4000ms) with OVS and VAPOR water suppression. Shimming was performed with FASTMAP and allowed reaching typical linewidth (FWHM) ranging between 5 and 10 Hz depending on the VOI size and position. The size of the volumes of interest were variable depending on the embryonic stage and the tissue: Egg yolk (3x6x4.5 mm3), vitreous body (E6: 1.6x1.6x1.6 mm3/ E8: 2.1x3.7x3 mm3) and full eye (E3: 1x1x1 mm3 / E6: 3.8x4.5x3.5 mm3/ E8: 4.5x7.3x6.8 mm3). Scan time ranged between 20 minutes for the big voxels and several hours for the small ones. Spectra were corrected for B0 drift, summed and quantified using LCModel and a homemade basis set including several metabolites as well as main lipid resonances. Quantification was done using the water as internal reference and assuming its concentration to be 55% in the egg yolk, 99% in the vitreous body and approximated as 80% in the full eye1,2. Different lipid composition indices were calculated as described in Soares et al3.Results
SNR was around 10 (E3), 15 (E6) and 27 (E8) for the full eye spectra, around 24 (E3), 50 (E6) and 38 (E8) for the egg yolk, and around 3 (E6) and 27 (E8) for the vitreous body. Lipids, lactate and glucose were reliably quantifiable (CRLB<20%) even in the spectra with low SNR. Images of the embryo (Fig1 A) allowed locating efficiently the eye, which was easily recognizable with its round shape and a dark spot corresponding to the lens. Metabolite quantification of the full eye indicated a strong reduction of lactate between (E3 and E6) which tended to increase again at E8 stage (Fig1 B-C), possibly due to its accumulation in the vitreous body, as it was included in the voxel (Fig2). Analysis of the yolk, the energy reservoir of the embryo, indicated an increase in lipid concentration mainly between E3 and E6 with only slight reduction of glucose concentration (Fig 3-4). Yolk lipid concentration increase have been reported previously at these stages with no total increase of lipid content probably due to yolk volume reduction2. However, the saturation composition of lipid and mainly omega3 (Ω3) content decreased strongly between E3 and E6. This indicates that energetic support from the yolk consist mainly in glucose and lactate that are consumed by the embryo, in accordance with lipid consumption occuring at later stages preferentially (from E15)2.Discussion
The B0 homogeneity in the samples led to a very sharp linewidth (around 5 Hz) at 14 Tesla in almost every region investigated in the hen egg. For this reason, together with the ability to scan the embryos for a very long period without altering its biology, we were able to investigate for the first time some in vivo metabolic changes associated with chick embryo development longitudinally in different parts of the egg. Yolk metabolic changes suggest that consumption of glucose and lactate occurs strongly between embryonic stages E3 and E6. This effect coincides with the appearance of the oxidative phosphorylation (OXPHOS) activity in the neural tissue and could explain the lactate decrease in the full eye at E6. These observations will allow better understanding the metabolic changes occurring during development of the retina in chick embryogenesis.Acknowledgements
Authors want to thank Dr. A. F. Soares and V. Rackayová for their help in the lipid and metabolic modelling analyses respectively. This work was supported by the CIBM of the UNIL, UNIGE, HUG; CHUV, EPFL and Leenaards and Louis-Jeantet Foundations.References
1Kokavex et al. Clin Exp Ophthalmol (2016); 2Yadgary et al. Poult Sci (2010); 3Soares, et al. NMR Biomed (2015).Figures
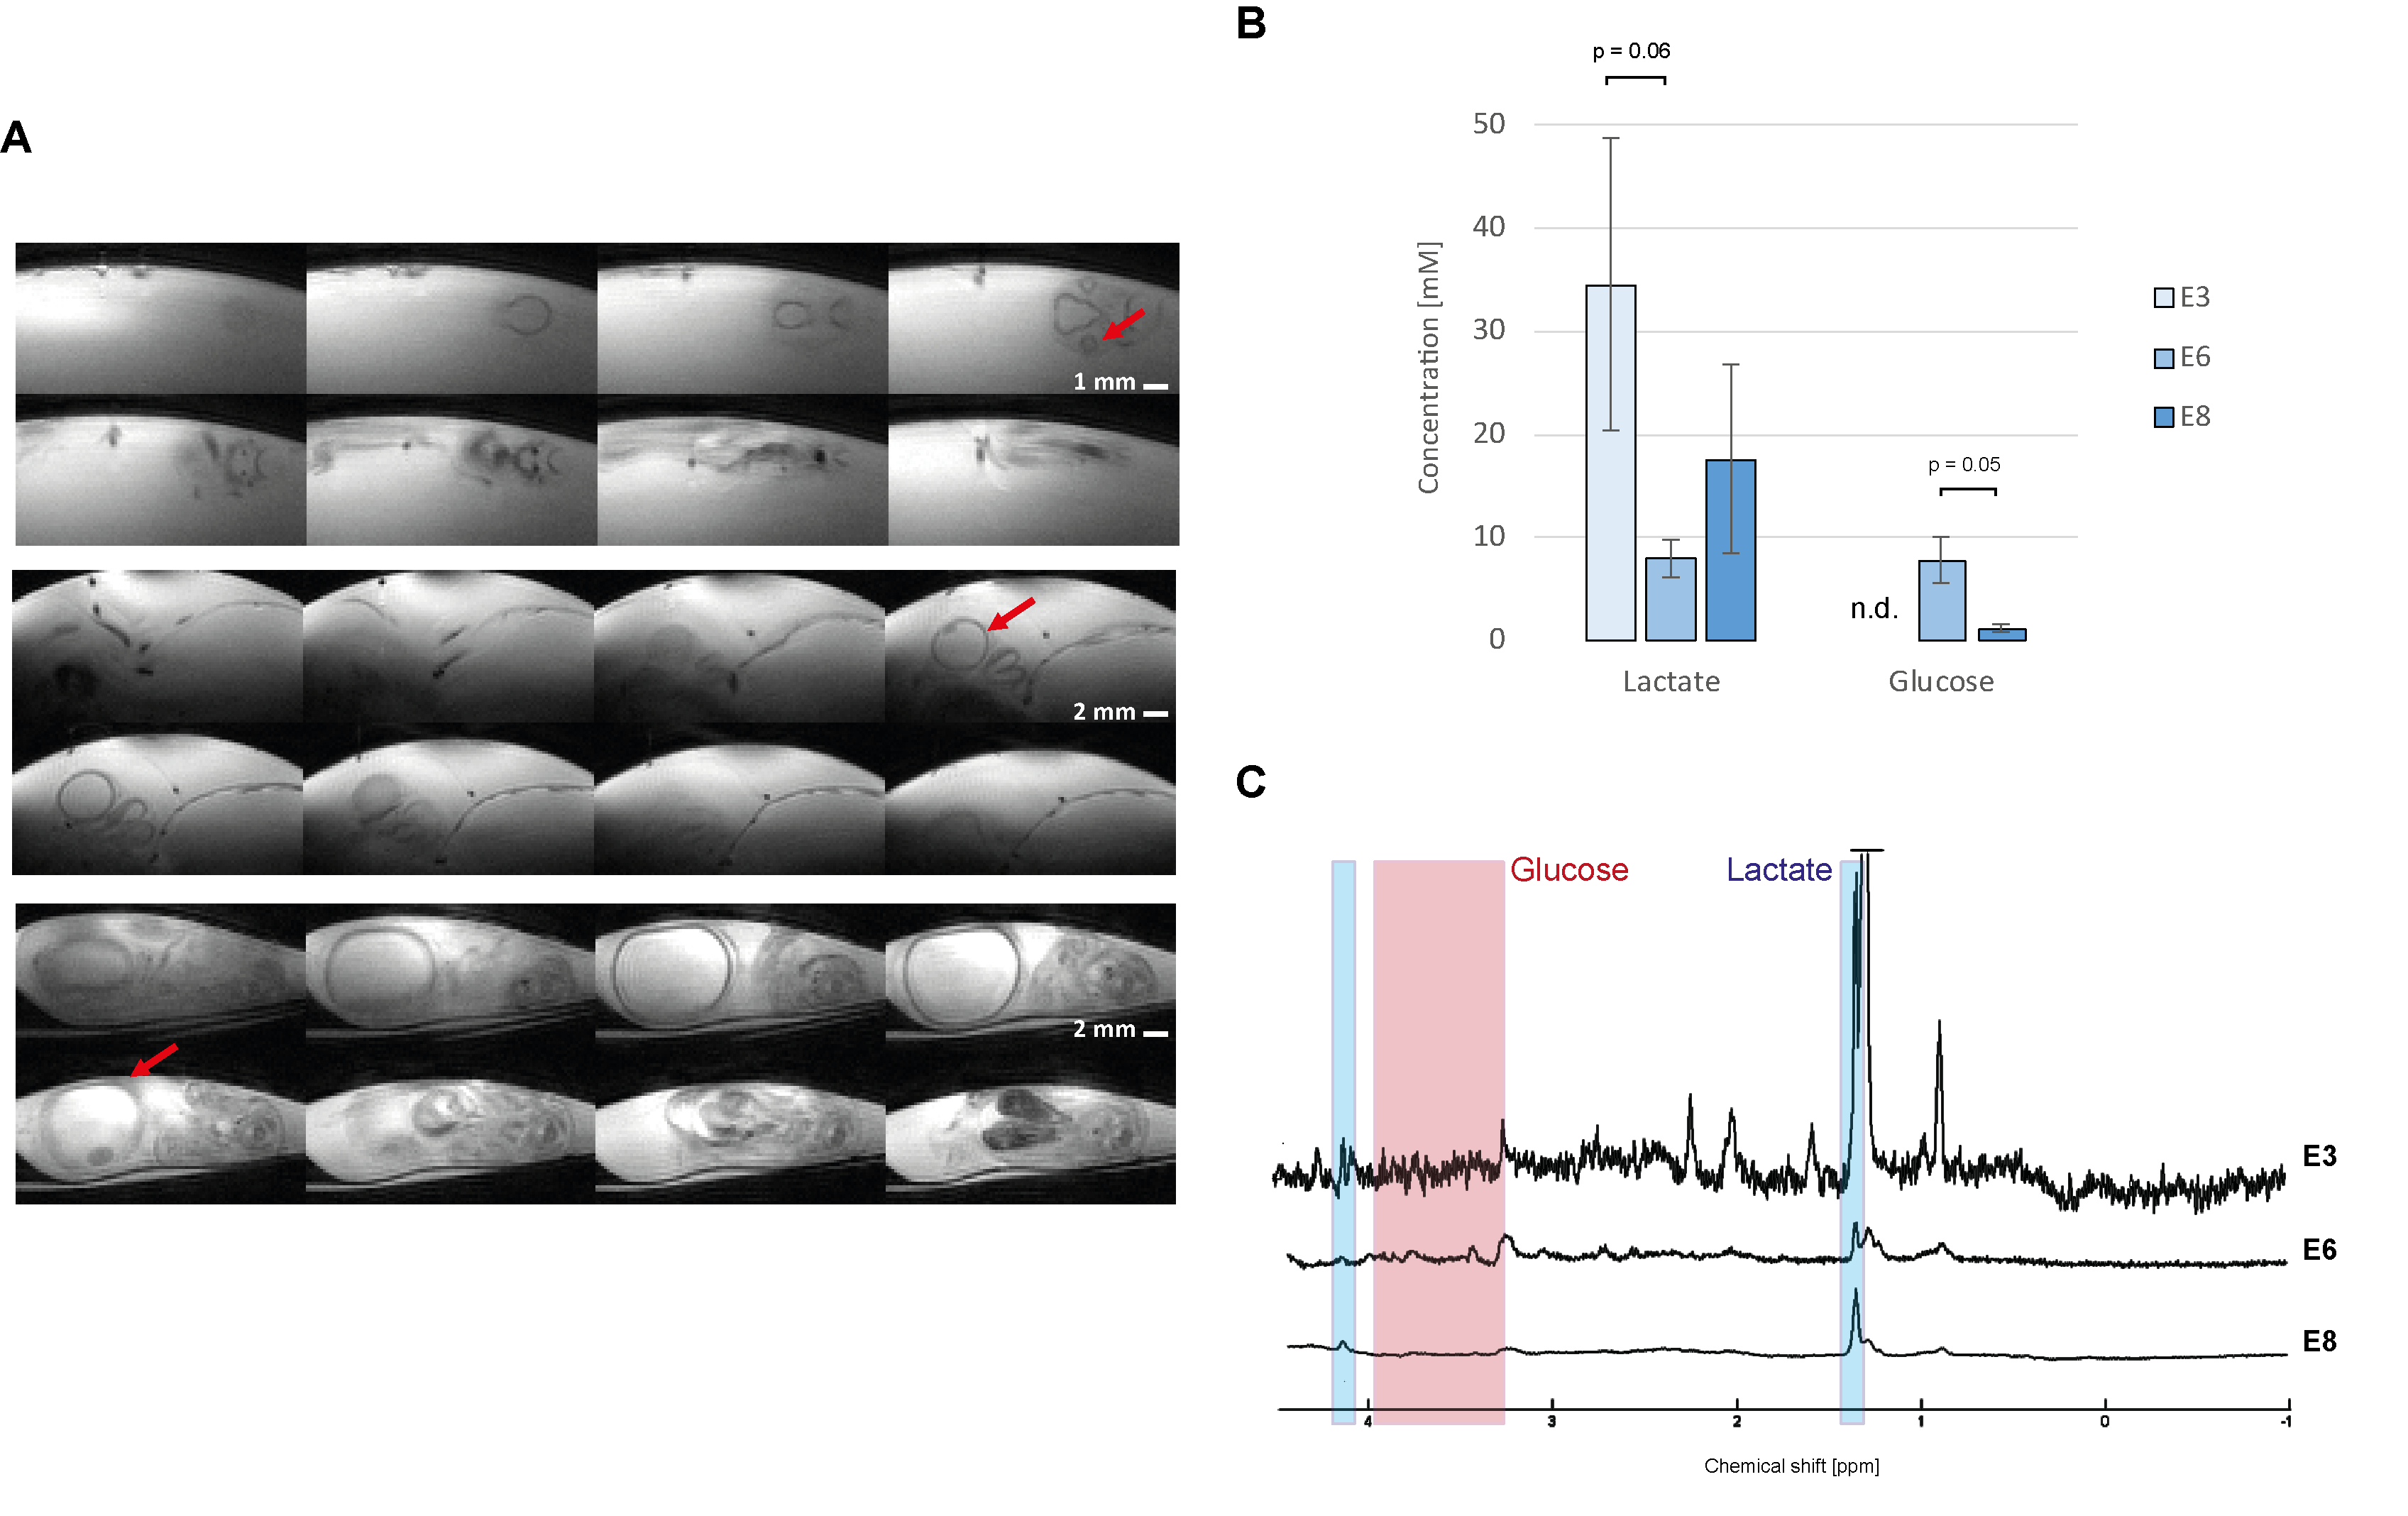
A. typical fsems images obtained from E3 (top), E6
(middle) and E8 (bottom) embryos. B.
Evolution of the lactate and glucose composition of the full eye. C. Typical spectra obtained from the
full eyes. Spectra are represented as
normalized to the water signal. Spectra represented with 2Hz linebroadening.
Averages±SD. P value was determined with a paired t-test. (n.d= not detectable).
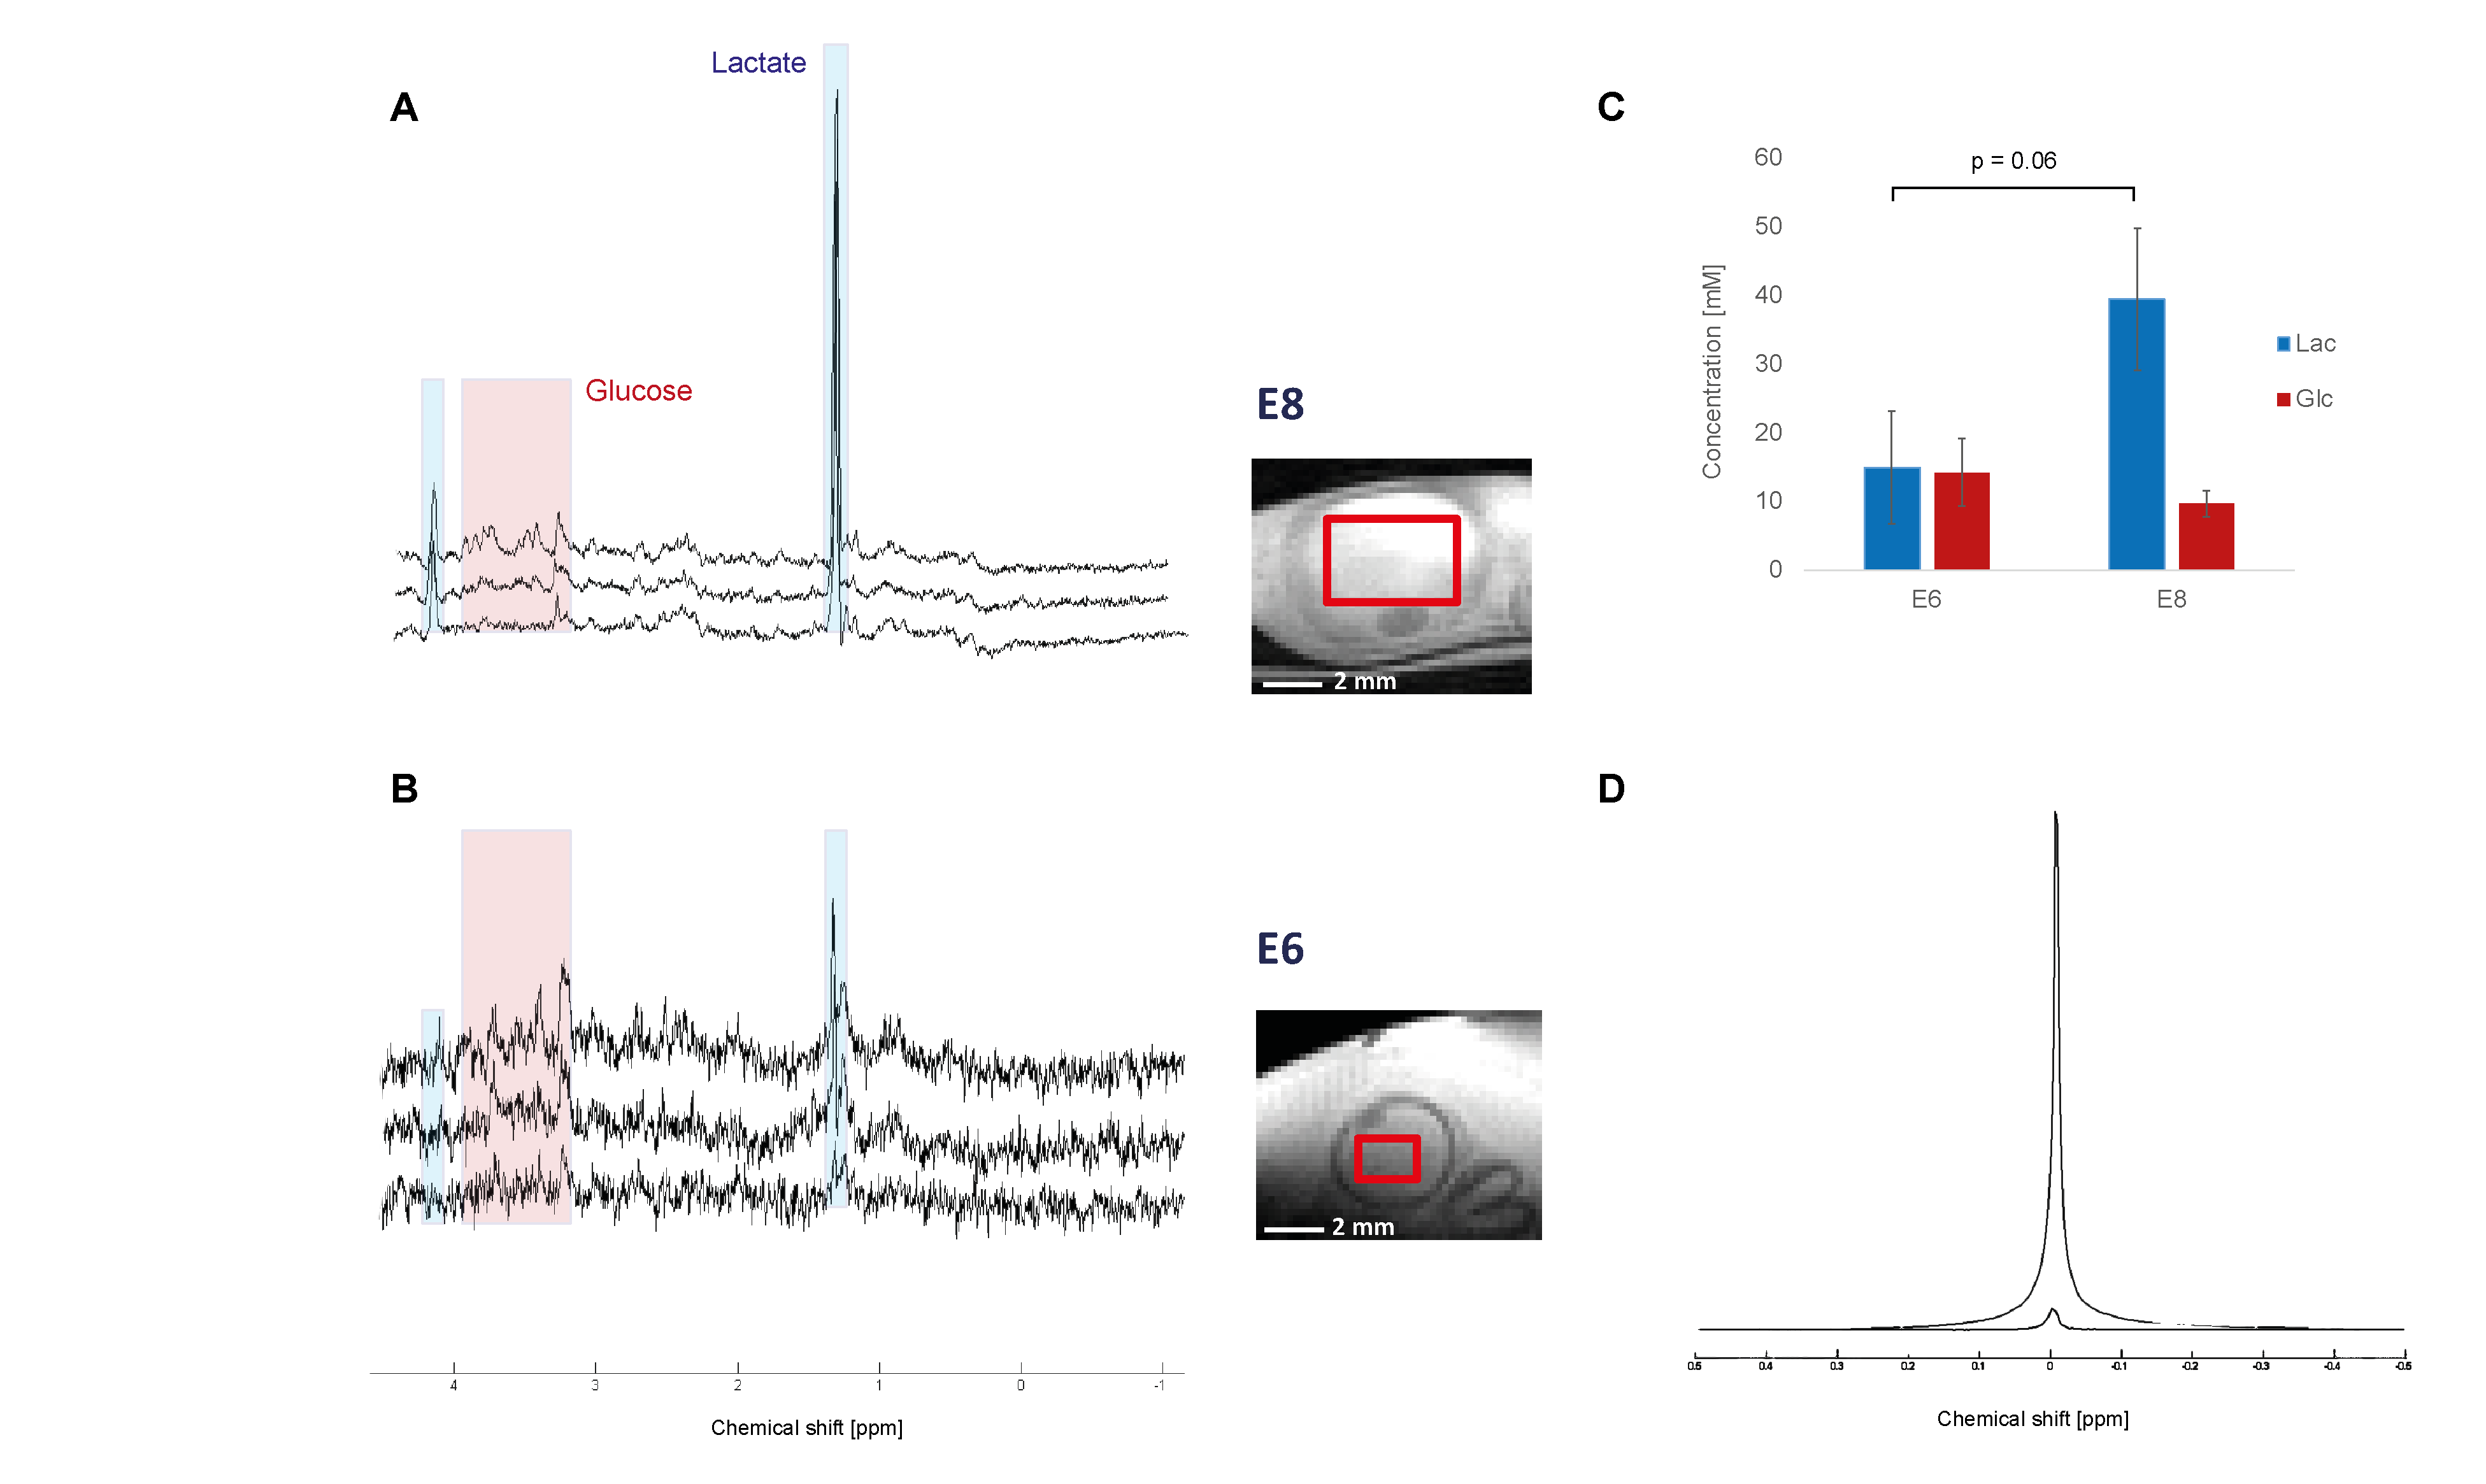
Typical spectra and voxel
position of vitreous body at A. E8
and B. E6 with associated glucose
and lactate concentrations in C. The
difference in water signal in the two voxel is represented in D. Spectra represented with 2Hz
linebroadening. Averages±SD.
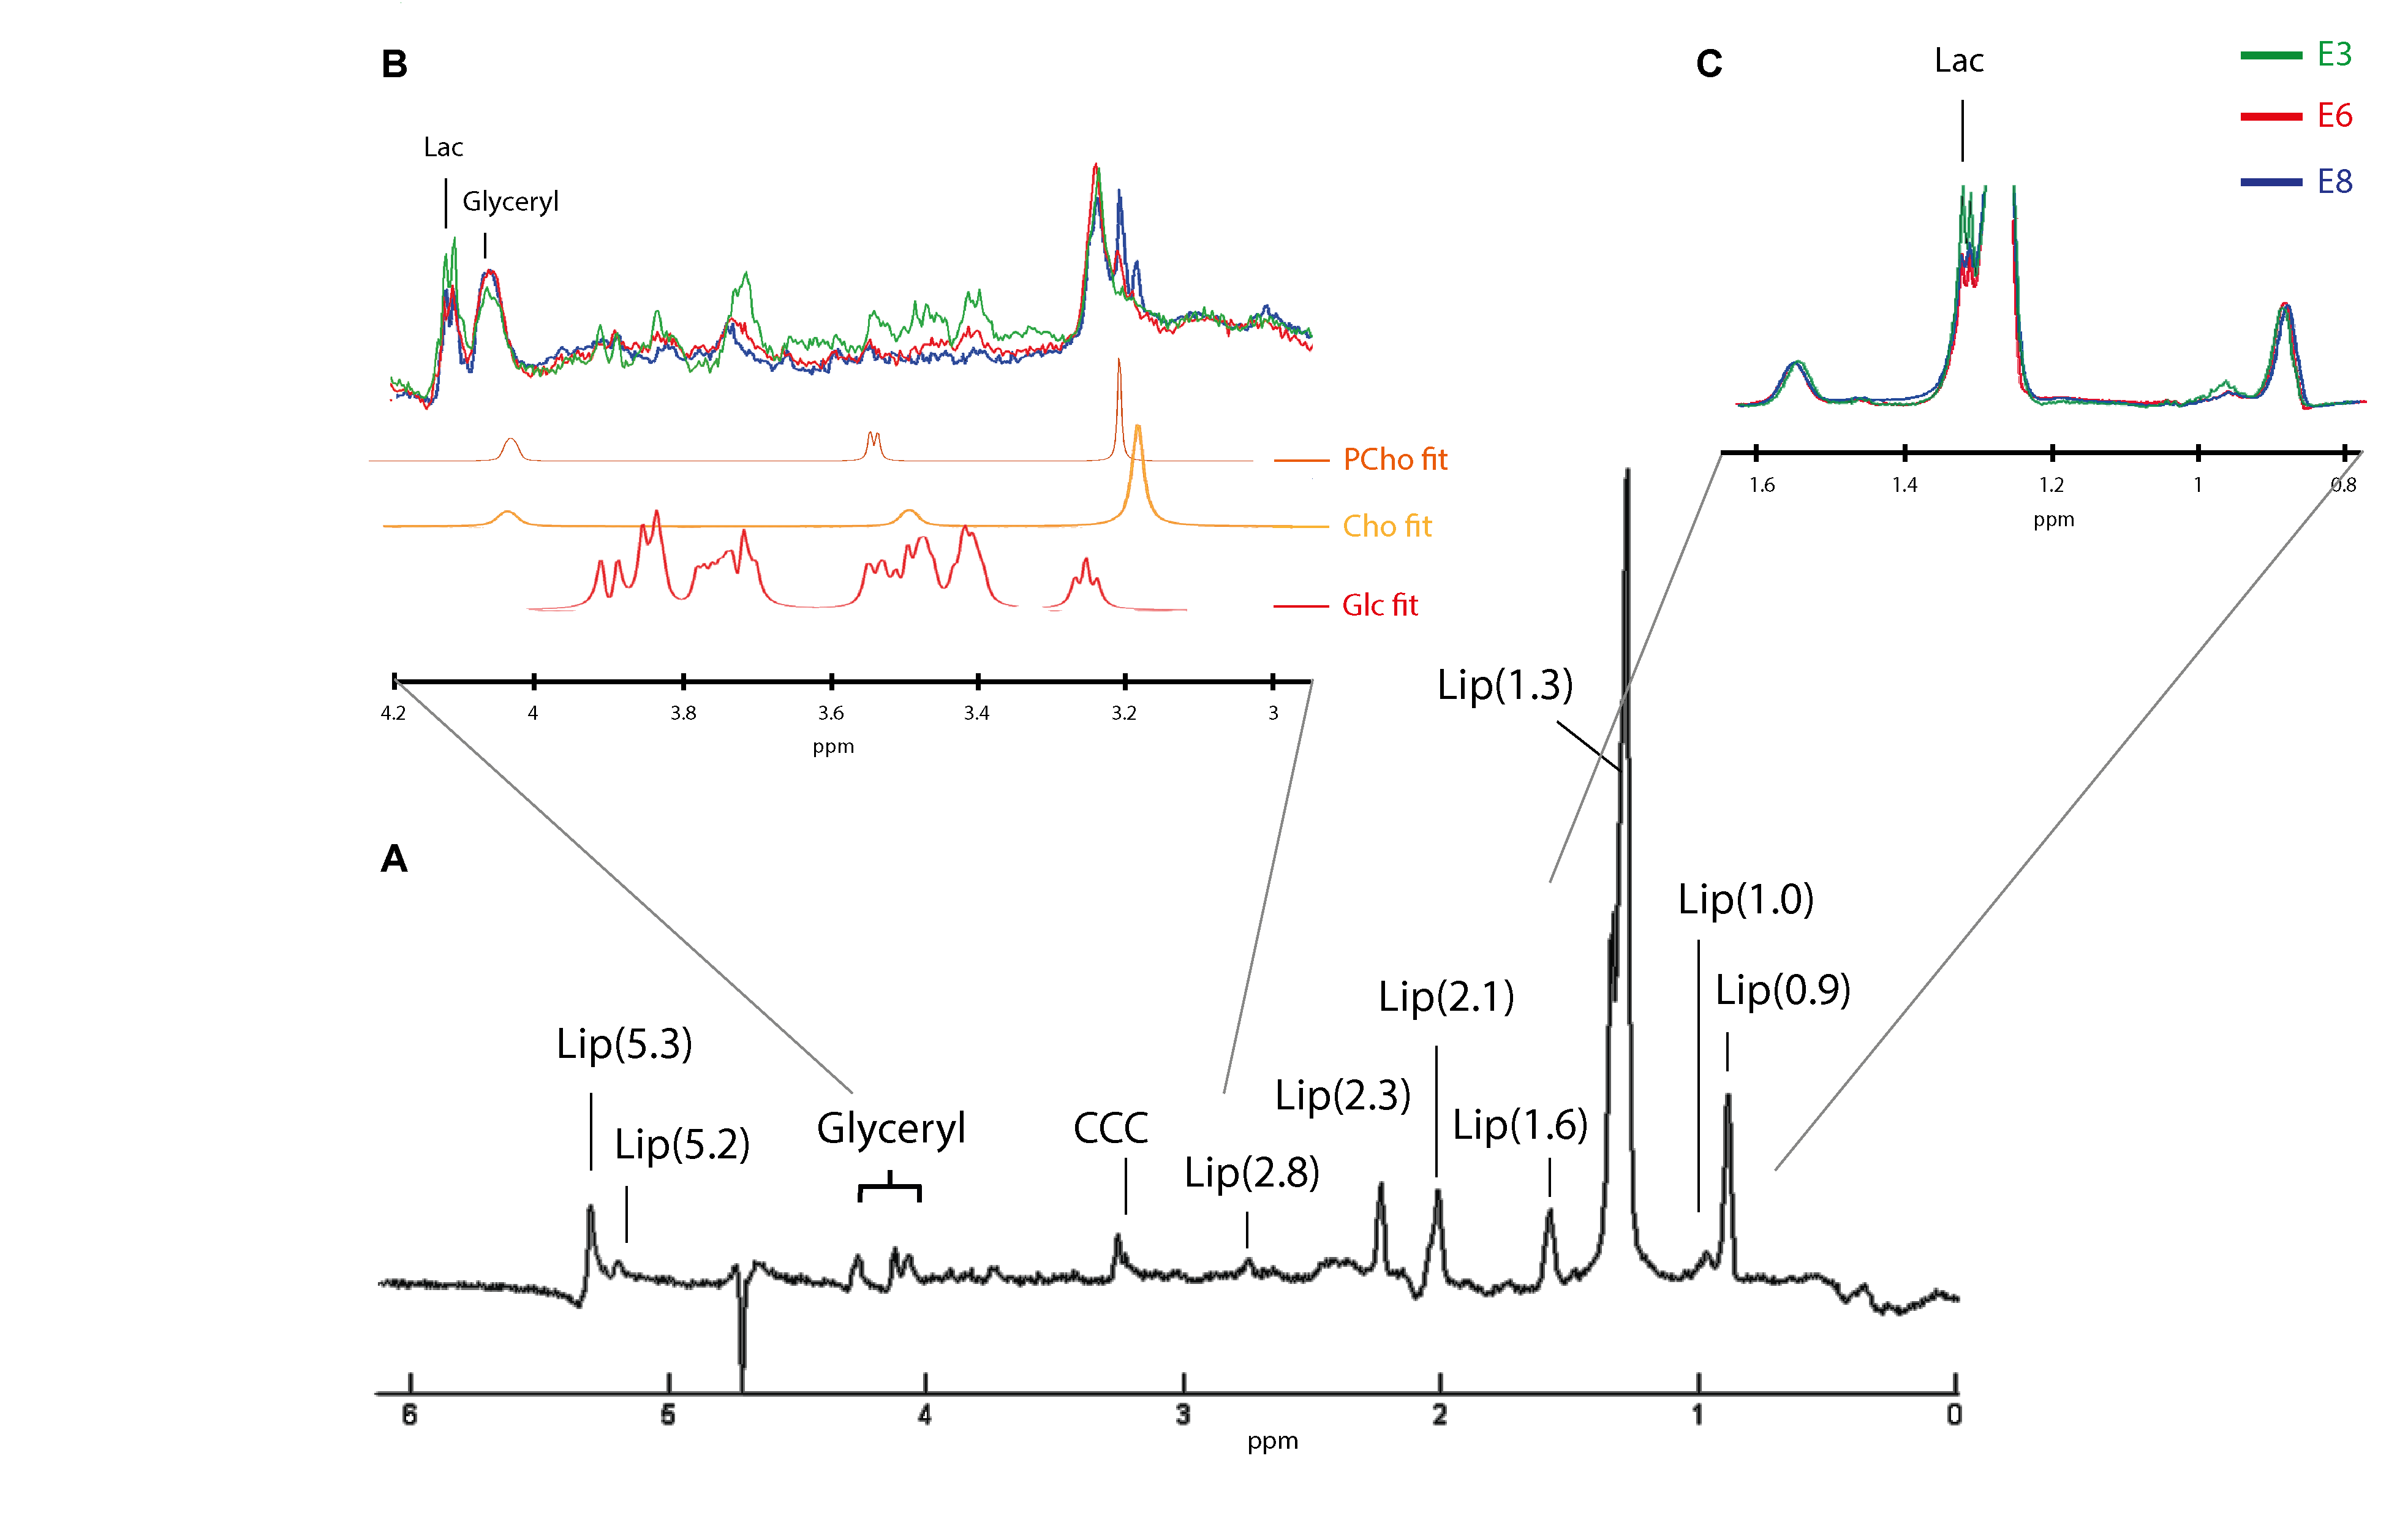
A. Typical spectra obtained in the egg yolk with
different lipid resonances labelled. B.
Zoom of the glucose and choline containing compound (CCC) region with fitting
used in the LCModel. C. Zoom of the lactate (1.33 ppm) region. No
linebroadening.
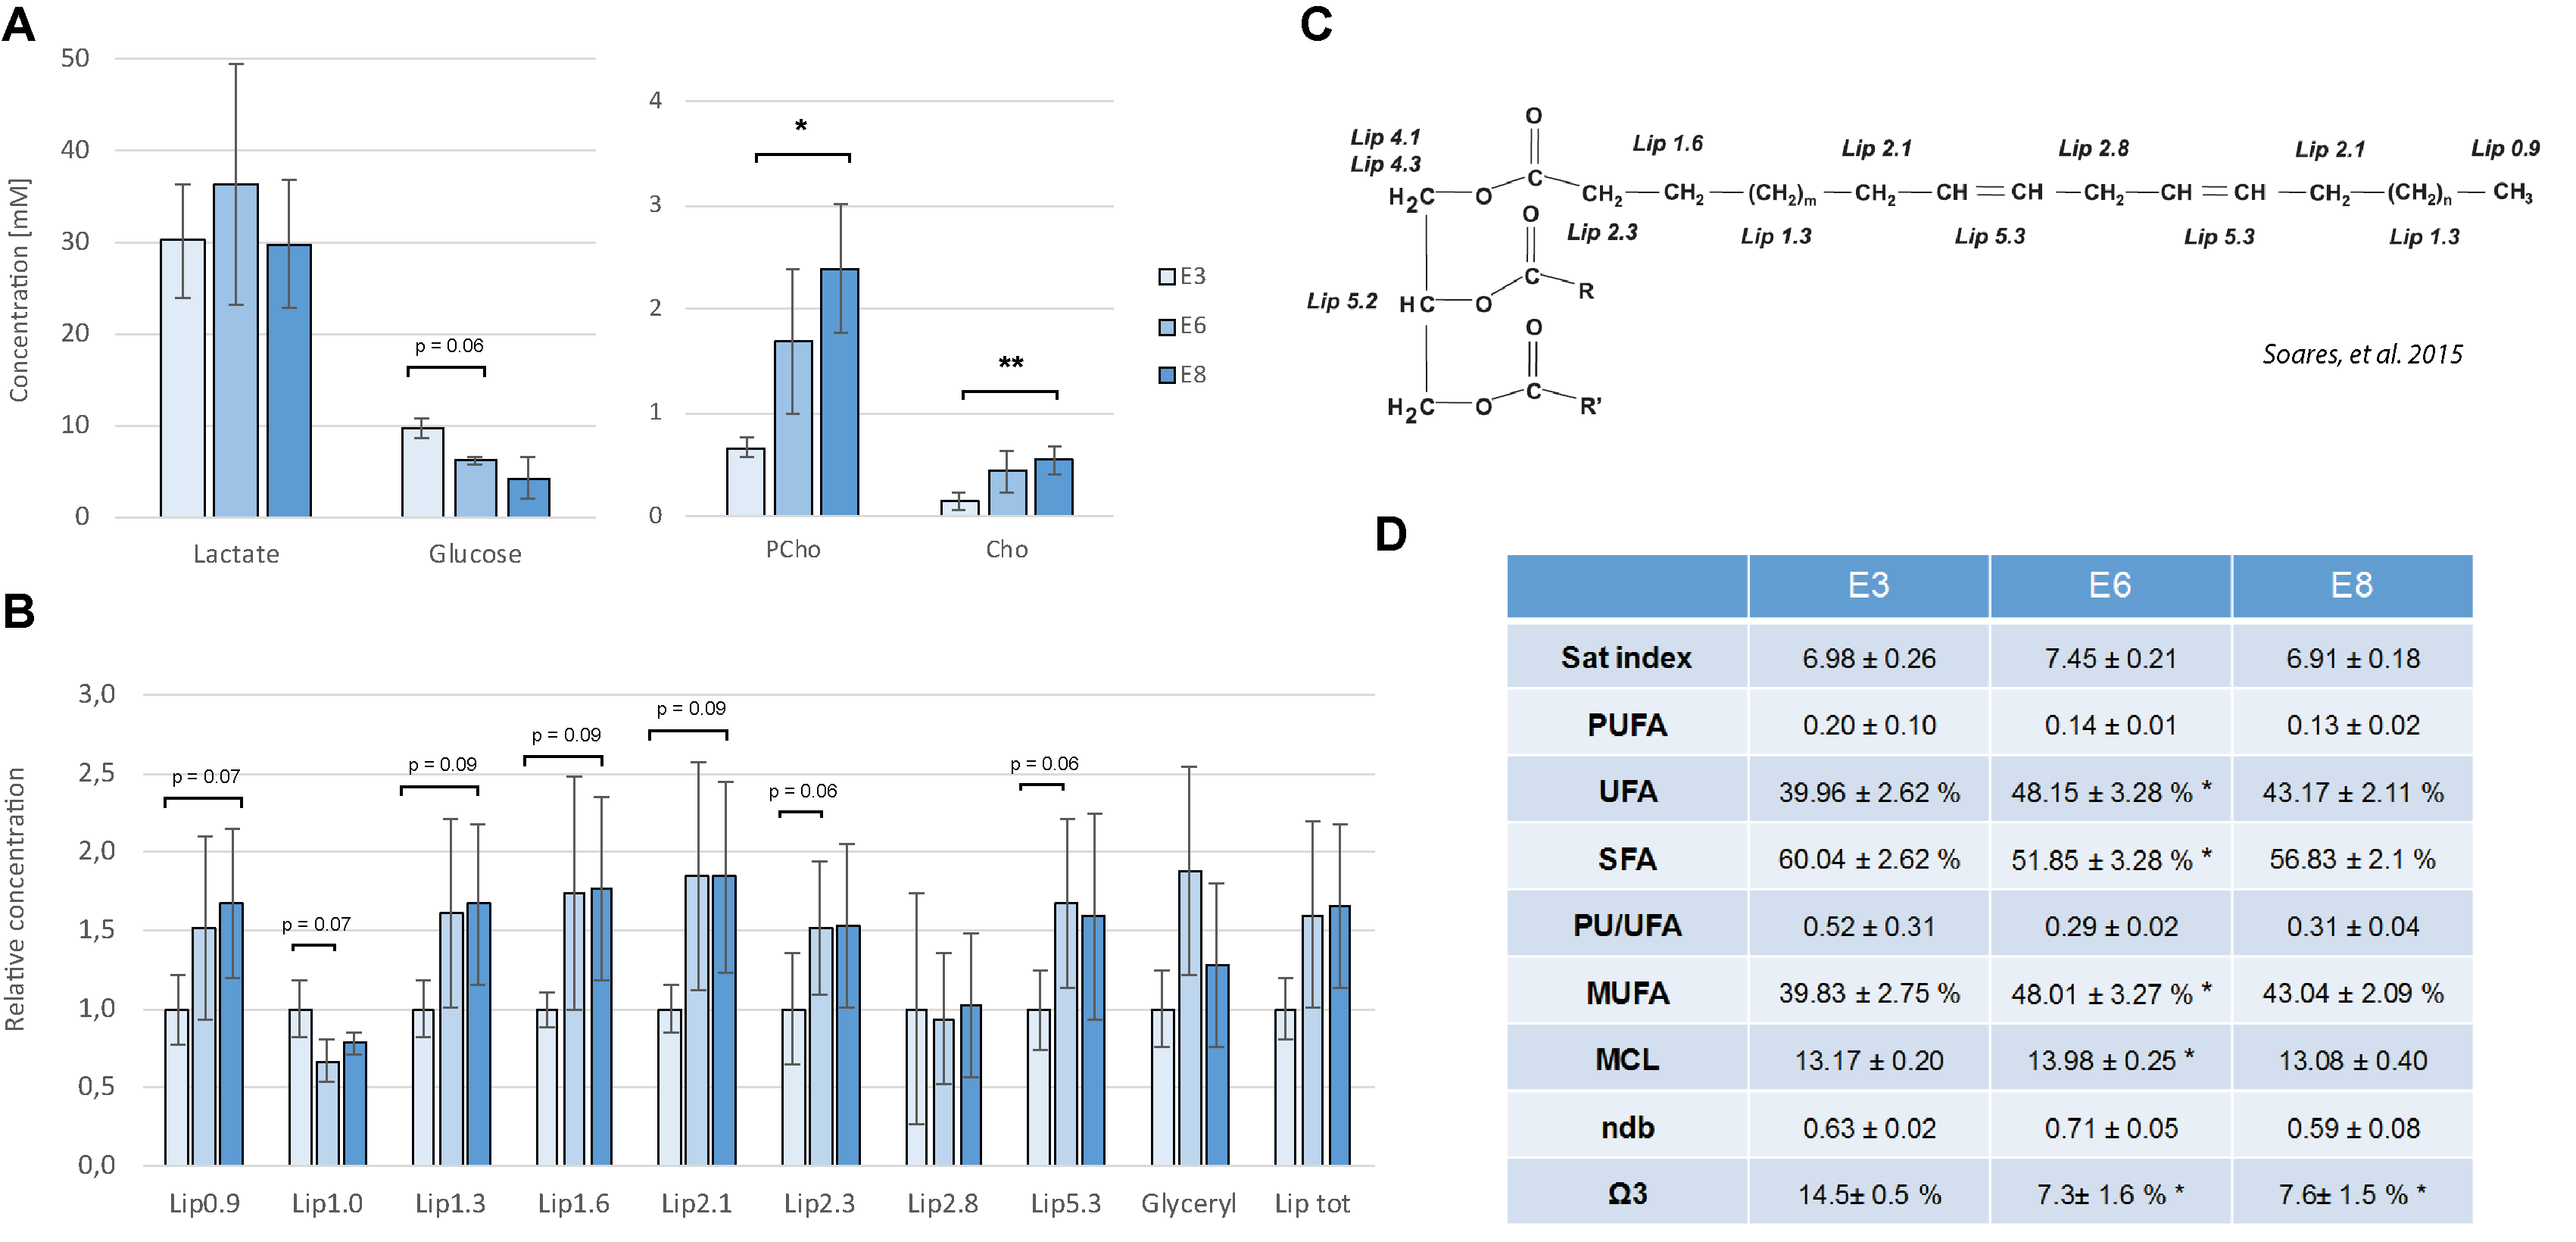
A. Yolk glucose, lactate and CCC composition in
mM. B. Relative lipid concentration
from the different resonances represented in C. Table D. represents the characterization
of fatty-acyl chains. Averages±SD. P value was determined with a paired t-test
(*P < 0.05, **P < 0.01).