5639
Mapping brain macromolecules in patients with multiple sclerosis using 1H-MRSI at 7T1Department of Biomedical Imaging and Image-guided Therapy, High Field MR Centre, Medical University Vienna, Vienna, Austria, 2Christian Doppler Laboratory for Clinical Molecular MR Imaging, Vienna, Austria, 3Department of Neurology, Medical University Vienna, Vienna, Austria
Synopsis
Multiple sclerosis (MS) is a disease of the central nervous system associated with demyelination and glial activation affecting large areas of white matter. 1H-MRSI may detect the metabolic changes induced by MS and facilitate the differentiation between MS lesions. Our study aimed to detect and map the signal of macromolecules in healthy controls and MS patients. 2D FID-based 1H-MRSI was used with measurement time under 6 minutes. We found increased macromolecules in the perilesional region and decreased macromolecules in most of the lesions. However, in some lesions, macromolecules were increased, which may be possibly related to pathological activation of lesion.
Purpose
Multiple sclerosis (MS) is a chronic disease of the central nervous system characterized pathologically by demyelination, axonal loss and focal inflammation1. Due to its variable clinical features, diagnosing of MS can be challenging. MR imaging as a core diagnostic tool provides high detection sensitivity, however several syndromes and diseases not related to MS may mimic an MS lesion, thus limiting the specificity2. Previous in vivo MRI and MR spectroscopic imaging (MRSI) studies have pointed out that inflammatory and metabolic changes are not restricted only to MS lesions but manifest diffusely across the normal appearing white matter (NAWM) and even affects the gray matter3. These changes are not always visible in conventional MRI. 1H-MRSI may be of clinical importance as it provides additional metabolic information. Several studies already mapped the altered metabolites in MS3,4. We aimed to compare the macromolecular signal detected at 0.91 ppm in healthy controls and MS patients.Methods
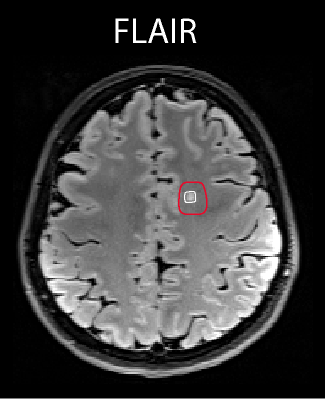
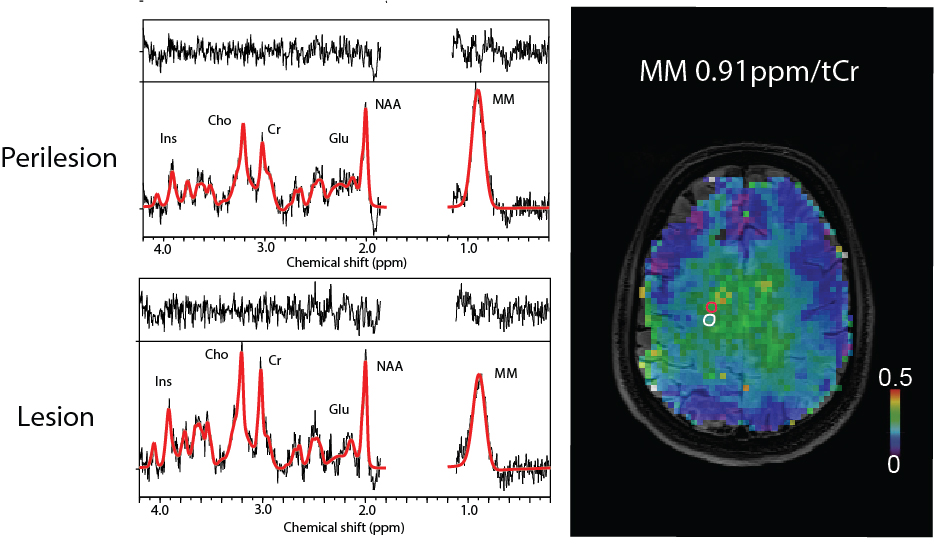
Thirteen MS patients (relapsing-remitting/ secondary progressive MS, 7 males, 36±9 years) and eleven healthy controls (6 males, 32±3 years) were measured on a 7T scanner (Siemens Magnetom) using a 32-channel head coil (Nova Medical). Written informed consent and IRB approval were obtained. Three patients were excluded from the study due to motion artifacts. T1-weighted MP2RAGE, FLAIR (patients only) and MRSI were measured. FID-based 2D 1H-MRSI5 was measured with the following parameters: TR=600ms, TE*=1.3ms, matrix size 64x64, FOV 220x220x8 mm³ (~3.4x3.4x8 mm³ nominal voxel size), 5-fold 2D-CAIPIRINHA acceleration6, measurement time 6 min. Data were coil combined using MUSICAL7 and Hamming filtered. L2-regularization was used to suppress skull lipids8. Obtained data were quantified with LCModel 6.39. Basis set consisted of the signal of metabolites and parameterized signal of measured macromolecules as described previously10. Due to the lipid suppression, signal in the 1.1-1.8 ppm range could not be reliably fitted and was excluded from the analysis with LCModel parameter PPMGAP. Regions of interest (ROI) containing lesion and perilesional area were drawn in patients (Fig.1). The MM0.91ppm/tCr (i.e. macromolecules at 0.91 ppm/creatine+phosphocreatine) within ROI was compared with white matter MM0.91ppm/tCr values of healthy controls. The macromolecular maps were created for every patient and compared to FLAIR images.Results
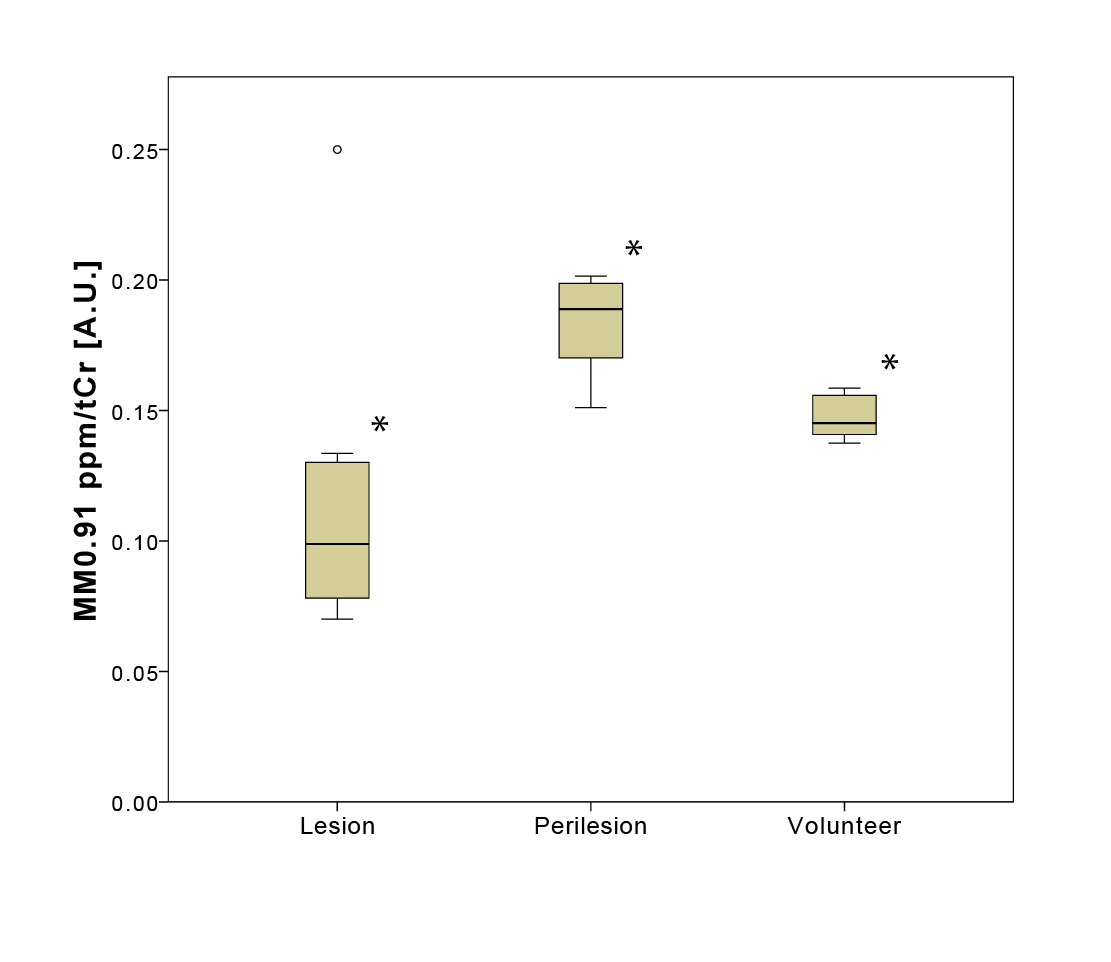
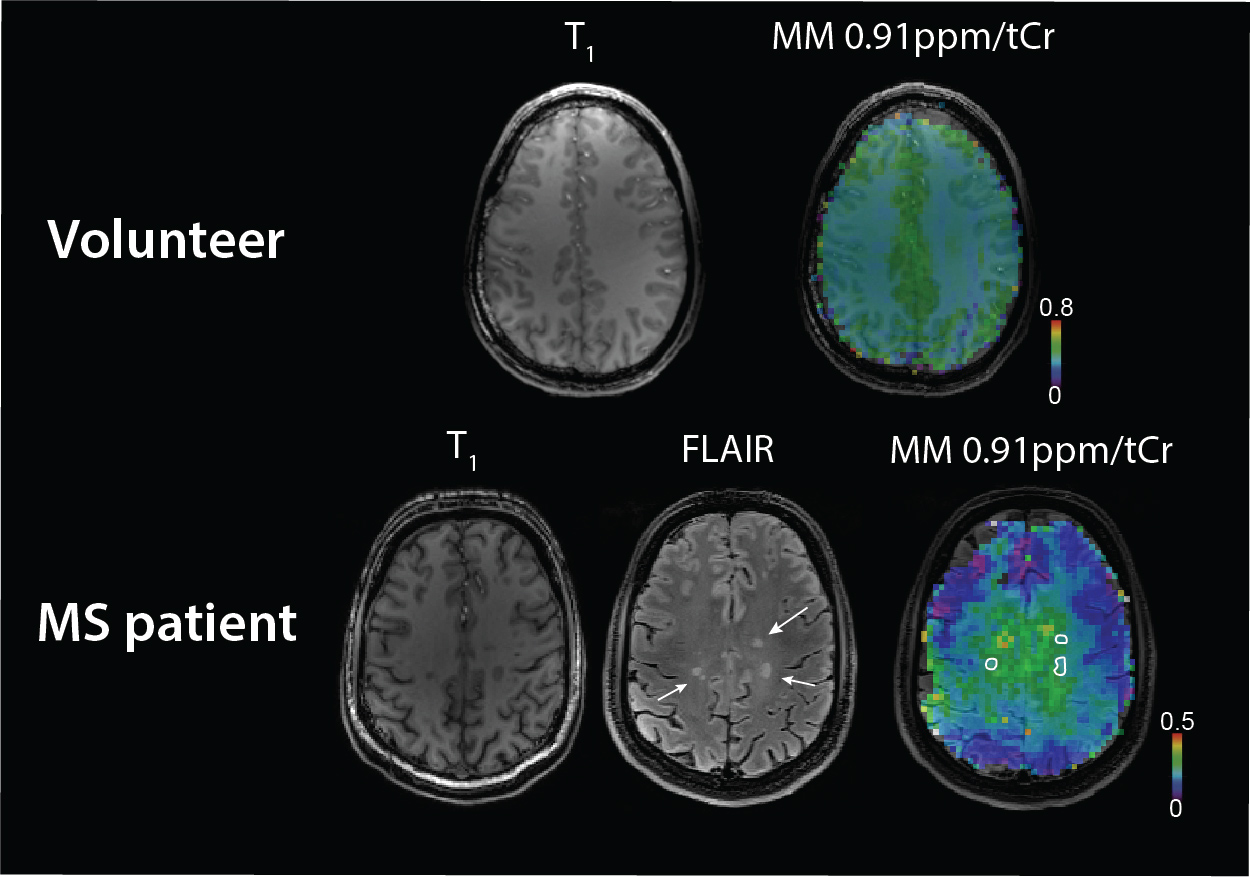
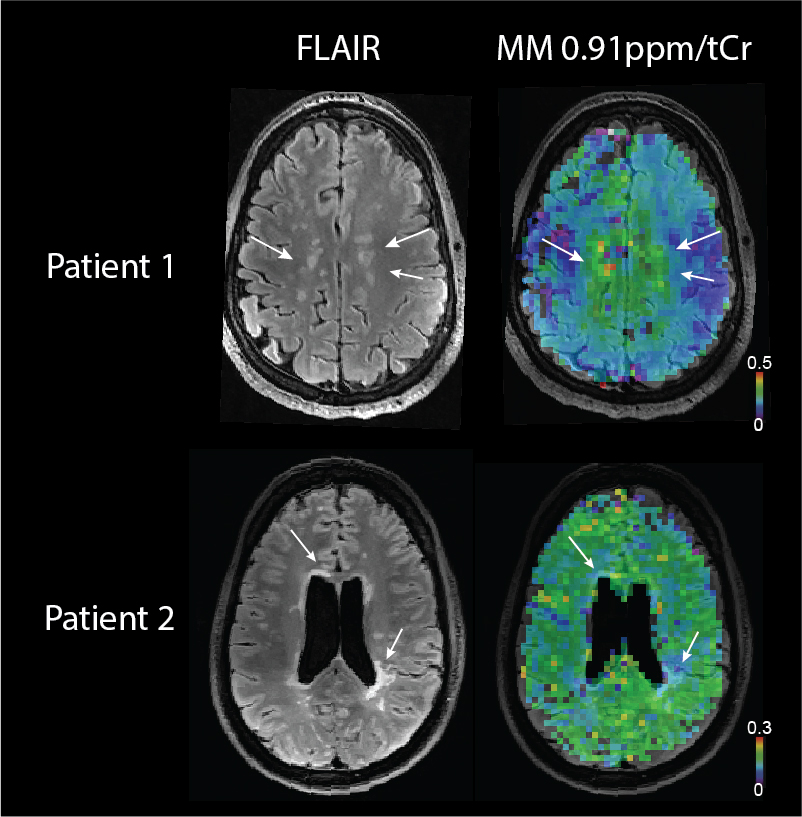
The ratio of MM0.91ppm/tCr in volunteers was found to be (mean±stdev) 0.15±0.02 for healthy controls, 0.12±0.04 for MS lesions and 0.21±0.05 for perilesional area(Fig.2). Significant differences were found between white matter (WM) voxels (>70% of WM) within ROIs of healthy volunteers, MS lesions, and in perilesional areas (p<0.05, One-way ANOVA, Tukey post-hoc test). All MS patients had lesions with decreased signal of MM0.91ppm/tCr inside lesions; however the WM macromolecules in close proximity to lesion (perilesional area) were increased compared to healthy controls (Fig.3). Three patients had also lesions with increased MM0.91ppm/tCr signal (Fig.4, Patient 1).Discussion/Conclusion
The macromolecular resonances contain mostly signals of methyl and methylene groups of cytosolic proteins11. Microglia activation and demyelination in MS lead to metabolic changes that are not restricted solely to lesion3. These changes may reflect the actual progression of the disease in particular brain region. The overall increased white matter MM0.91ppm/tCr in patients, in particular in the perilesional area can be a result of myelin breakdown. We hypothesize, that the difference between MM0.91ppm/tCr values of MS lesions that we have found may possibly indicate a status of an ongoing pathological activity within the lesion. Similar results were reported by Mader et al.12 who found elevated MM0.91ppm in acute lesions compared to chronic lesions and healthy controls. Nevertheless, the results of this study are preliminary and a deeper analysis needs to be carried out to approve our findings.Acknowledgements
No acknowledgement found.References
1. Compston, A. & Coles, A. Multiple sclerosis. Lancet 372, 1502–1517 (2008).
2. Chen, J. J., Carletti, F., Young, V., Mckean, D. & Quaghebeur, G. MRI differential diagnosis of suspected multiple sclerosis. Clin. Radiol. 71, 815–827 (2015).
3. Fleischer, V. et al. Metabolic Patterns in Chronic MS Lesions and Normal-appearing White Matter: Intraindividual Comparison by Using Two-Dimensional MR Spectroscopic Imaging. Radiology 281, 151654 (2016).
4. Strasser, B. et al. Ultra-high Resolution MRSI of Multiple Sclerosis at 7T. Proc. Intl. Soc. Mag. Reson. Med. 24, (2016).
5. Hangel, G. et al. Ultra-high resolution brain metabolite mapping at 7 T by short-TR Hadamard-encoded FID-MRSI. NeuroImage, doi 10.1016/j.neuroimage.2016.10.043 (2016).
6. Strasser, B. et al. (2+1)D-CAIPIRINHA Accelerated MR Spectroscopic Imaging of the Brain at 7 T. Magn. Reson. Med. [details will be added proofing] 00, 1–12 (2016).
7. Strasser, B. et al. Coil combination of multichannel MRSI data at 7 T: MUSICAL. NMR Biomed. 26, 1796–805 (2013).
8. Bilgic, B. et al. Fast image reconstruction with L2-regularization. J. Magn. Reson. Imaging 40, 181–191 (2014).
9. Provencher, S. W. Automatic quantitation of localized in vivo 1H spectra with LCModel. NMR Biomed. 14, 260–4 (2001).
10. Považan, M. et al. Parameterization of measured macromolecular background in ultra-short acquisition delay 1H MRSI in the brain at 7T. Proc. Intl. Soc. Mag. Reson. Med. 24, 0024 (2016).
11. Cudalbu, C., Mlynárik, V. & Gruetter, R. Handling macromolecule signals in the quantification of the neurochemical profile. J. Alzheimers. Dis. 31 Suppl 3, S101–15 (2012).
12. Mader, I. et al. Proton MR spectroscopy with metabolite-nulling reveals elevated macromolecules in acute multiple sclerosis. Brain 124, 953–61 (2001).
Figures