5638
Reproducibility for MRS-Based Relaxometry and Identification of Influential Parameters1Ludwig Boltzmann Institute for Clinical Forensic Imaging, Graz, Austria, 2BioTechMed-Graz, Graz, Austria, 3Department of Clinical Research (AMSM), University of Bern, Bern, Switzerland, 4Department of Forensic Medicine, University of Basel, Basel, Switzerland
Synopsis
The different relaxation times of the water and the fat compartment in human lumbar vertebrae make it necessary to determine these values for a correct calculation of the fat fraction, which is used as a biomarker for various applications. This study investigates the reproducibility of relaxometry in human lumbar vertebrae to serve as a basis for future studies. Furthermore, factors like age, sex, and physique are investigated for their influence on the derived T1 and T2 values to investigate whether relaxation times of the fat and water compartments can serve as biomarkers in addition to the fat fraction.
Purpose
The quantification of the fat content of lumbar vertebrae using 1H MR spectroscopy (MRS) is used as a tool for the determination of bone quality and the investigation of related parameters. The percentage fat fraction was shown to be connected to bone mineral density1, osteoporosis2, abdominal adipose tissue3 or bone health4. If not corrected, the quantification results are influenced by the relaxation times of the fat and water compartments, respectively, which are basically different5,6. Recently, the need to correct for T2 decay on MRS-based fat quantification was investigated7, concluding that the fat fraction should always be determined using a multi-TE approach.
This study aims to provide a basis for the estimation of the accuracy of relaxometry results provided by MRS measurements by investigating the reproducibility of the method. For this purpose T1 and T2 values of human lumbar vertebrae are quantified using a multi-TE/multi-TR MRS protocol and repeated measurements. Furthermore, influences introduced by volunteer sex, age and physique are investigated to identify potential biomarkers in addition to the fat fraction.
Material and Methods
Thirty healthy volunteers (15f, μ=27.19y, σ=6.11y; 15m, μ=30.07y, σ=6.59y) with no history of bone disease or vertebral abnormalities filled out a form on nutrition and exercise and were scanned in supine position on a clinical 3T scanner. The volume of interest was positioned in the center of vertebral bodies L2 and L3 for 1H-MRS using a STEAM-SVS sequence (20x20x20mm3, TE/TR=20,40,60,80,100/5000ms for T2 determination, TE/TR=20/600,1000,2000,3000,10 000ms for T1 determination, AVG=10). After the measurements the subjects were removed from the scanner and registered again to repeat the protocol two times.
Spectra were analyzed in the time-frequency domain using jMRUI software8 and the AMARES algorithm9. Five resonances were identified in the acquired spectra: CH3, CH2, CH2CH=CH, water, and CH=CH. These five peaks were included in the AMARES algorithm using multiple peaks for the water and the CH2 resonances to account for the non-Lorentzian shape of the peaks. Values for T1 and T2 were obtained fitting $$I=I_0 \cdot \left( 1-e^{-\frac{\text{T}_\text{R}}{\text{T}_1}} \right) e^{-\frac{\text{T}_\text{E}}{T_2}}$$ to the exported data using MATLAB and assuming a common relaxation time for all fat peaks.
Reproducibility was investigated comparing the results of the first measurement to the values derived from the remaining measurements and performing a linear regression. Statistical significance was tested with a paired-sample t-test. Finally, relaxation times were correlated with volunteer age, sex and physical parameters.
Results
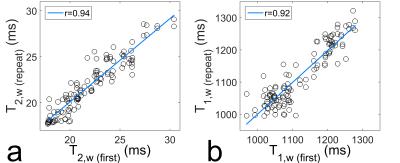
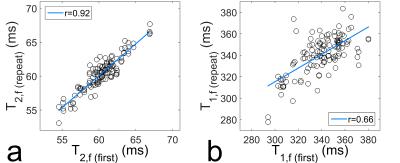
Figure 1 compares the relaxation times of the water compartment for each first measurement of each volunteer and vertebra (T2,w (first), T1,w (first)) with the results of the remaining two measurements (T2,w (repeat), T1,w (repeat)). Figure 2 shows the same analysis for the fat compartment (values for correlation coefficient r are shown in respective figures).
Figure 3 plots T2,w, T1,w and T2,f against volunteer age separated by sex. Averaged values of men and women differ significantly (p<0.01) for all three relaxation times. The T2 times of both compartments show a pronounced negative correlation with age for male volunteers.
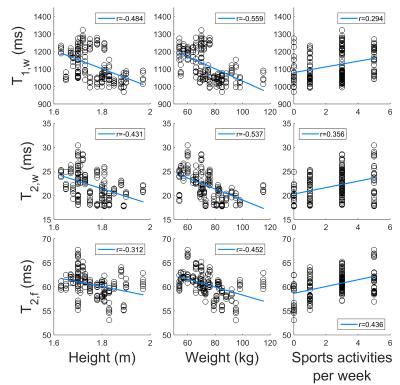
Figure 4 shows the correlation between relaxation times and volunteer physique. All values show a negative correlation with volunteer height and weight and a positive correlation with sports activities.
Discussion and Conclusion
The presented results show an excellent reproducibility of relaxometry for the water compartment and for T2 of the fat compartment. For T1 of fat the correlation factor is decreased and the correlation line deviates noticeably from identity; therefore, this quantity was not investigated further.
Since T2 effects represent the main influence on MRS data of human lumbar vertebrae, the high reproducibility for these values is an important basis for future studies applying T2-correction to acquired spectra. Furthermore, the high reproducibility of T2,w is of special interest, as this quantity is considered to be an additional parameter sensitive to the composition of the water compartment7.
Sex-specific differences were found for all three investigated relaxation times. For T2 only men showed increased correlation with age. As the fat fraction is well-known to increase with age10, this underlines the necessity to correct for T2 effects, since not correcting would introduce a sex-dependent bias into the age-related increase of the fat fraction. Additionally, the strong sex-specific difference in T1,w emphasizes the need for long enough repetition times to avoid different T1-weighting effects.
The correlations of all relaxation times with volunteer height and weight also suggest that using average T2 times for correction11 will introduce additional uncertainties. Finally, since more athletic people show higher values for all relaxation times, the presented results suggest that relaxation times may be considered as a marker for bone health.
Acknowledgements
No acknowledgement found.References
1. T. T. Shih, C. Chang, C. Hsu et al. Correlation of bone marrow lipid water content with bone mineral density on the lumbar spine. In: Spine (Phila Pa 1976) (2004) 29:2844–50
2. D. K. Yeung, J.F. Griffith, G. E. Antonio et al. Osteoporosis is associated with increased marrow fat content and decreased marrow fat unsaturation: a proton MR spectroscopy study. In: J Magn Reson Imaging (2005) 22:279-85
3. T. Baum, S. P. Yap, D. C. Karampinos et al. Does vertebral bone marrow fat content correlate with abdominal adipose tissue, lumbar spine bone mineral density, and blood biomarkers in women with type 2 diabetes mellitus? In: J Magn Reson Imaging (2012) 35:117–124
4. D. Schellinger, C. S. Lin, H. G. Hatipoglu et al. Potential value of vertebral proton MR spectroscopy in determining bone weakness. In: Am J Neuroradiol (2001) 22(8):1620–1627.
5. F. Schick, H. Bongers, W.-I. Jung, et al. Proton relaxation times in human red bone marrow by volume selective magnetic resonance spectroscopy. In: Appl Magn Reson (1992), 3:947–963.
6. B. Neumayer, A. Petrovic, T. Widek et al. Reproducibility of 1H MR Spectroscopy of Human Lumbar Vertebrae at 3 Tesla. In: Magn Reson Mater Phy (2013) 26:472.
7. M. Dieckmeyer, S. Ruschke, C. Cordes et al. The need for T2 correction on MRS-based vertebral bone marrow fat quantification: implications for bone marrow fat fraction age dependence. In: NMR Biomed (2015) 28:432–439
8. A. Naressi, C. Couturier, J.M. Devos et al. Java-based graphical user interface for the MRUI quantitation package. In: Magn Reson Mater Phy (2001) 12(2-3):141–152.
9. L. Vanhamme, A. van den Boogaart, S. Van Hu et al. Improved method for accurate and efficient quantification of MRS data with use of prior knowledge. In: J Magn Reson (1997) 129(1):35–43.
10. A. Piney. The anatomy of the bone marrow: with special reference to the distribution of the red marrow. In: The British Medical Journal (1922) 2:792–79.
11. H. Kugel, C. Jung, O. Schulte, W. Heindel. Age- and sex-specific differences in the 1H-spectrum of vertebral bone marrow. In: J Magn Reson Imaging (2001) 13:263–8
Figures


