5635
Neurochemical alterations in the hippocampus induced by high-fat diet: In vivo magnetic resonance spectroscopy1Department of Biomedical Engineering, and Research Institute of Biomedical Engineering. The Catholic University of Korea College of Medicine, Seoul, Korea, Republic of, 2Asan Institute for Life Sciences, Asan Medical Center, Seoul, Korea, Republic of
Synopsis
In this study, we investigated the neurochemical alterations in mouse hippocampus using in vivo proton magnetic resonance spectroscopy. We also examine the effect of high-fat diet on the levels of abdominal fat, plasma leptin, and corticosterone. The decrease in mIns concentration seen in HF diet mice without corresponding Gln-Glu alternation may reflect changes in glial function. In addition, the observed total choline levels indicate attenuated membrane turnover in HF diet mice. We therefore suggest that diets rich in saturated fats induce a stress-related response through metabolic disturbance and HPA axis dysfunction, which may indicate a relationship between obesity and depression.
Purpose
Obesity and high-fat diet are known to play a role in metabolic disturbances leading to impairments of the central nervous system. One of the risks associated with consuming excessive amounts of saturated fats is an increasing vulnerability to depression, anxiety, and cognitive decline1. In this study, we investigated the neurochemical alterations in mouse hippocampus using in vivo proton magnetic resonance spectroscopy (1H-MRS). We also examine the effect of high-fat diet on the levels of abdominal fat, plasma leptin, and corticosterone.Materials and Methods
Animal
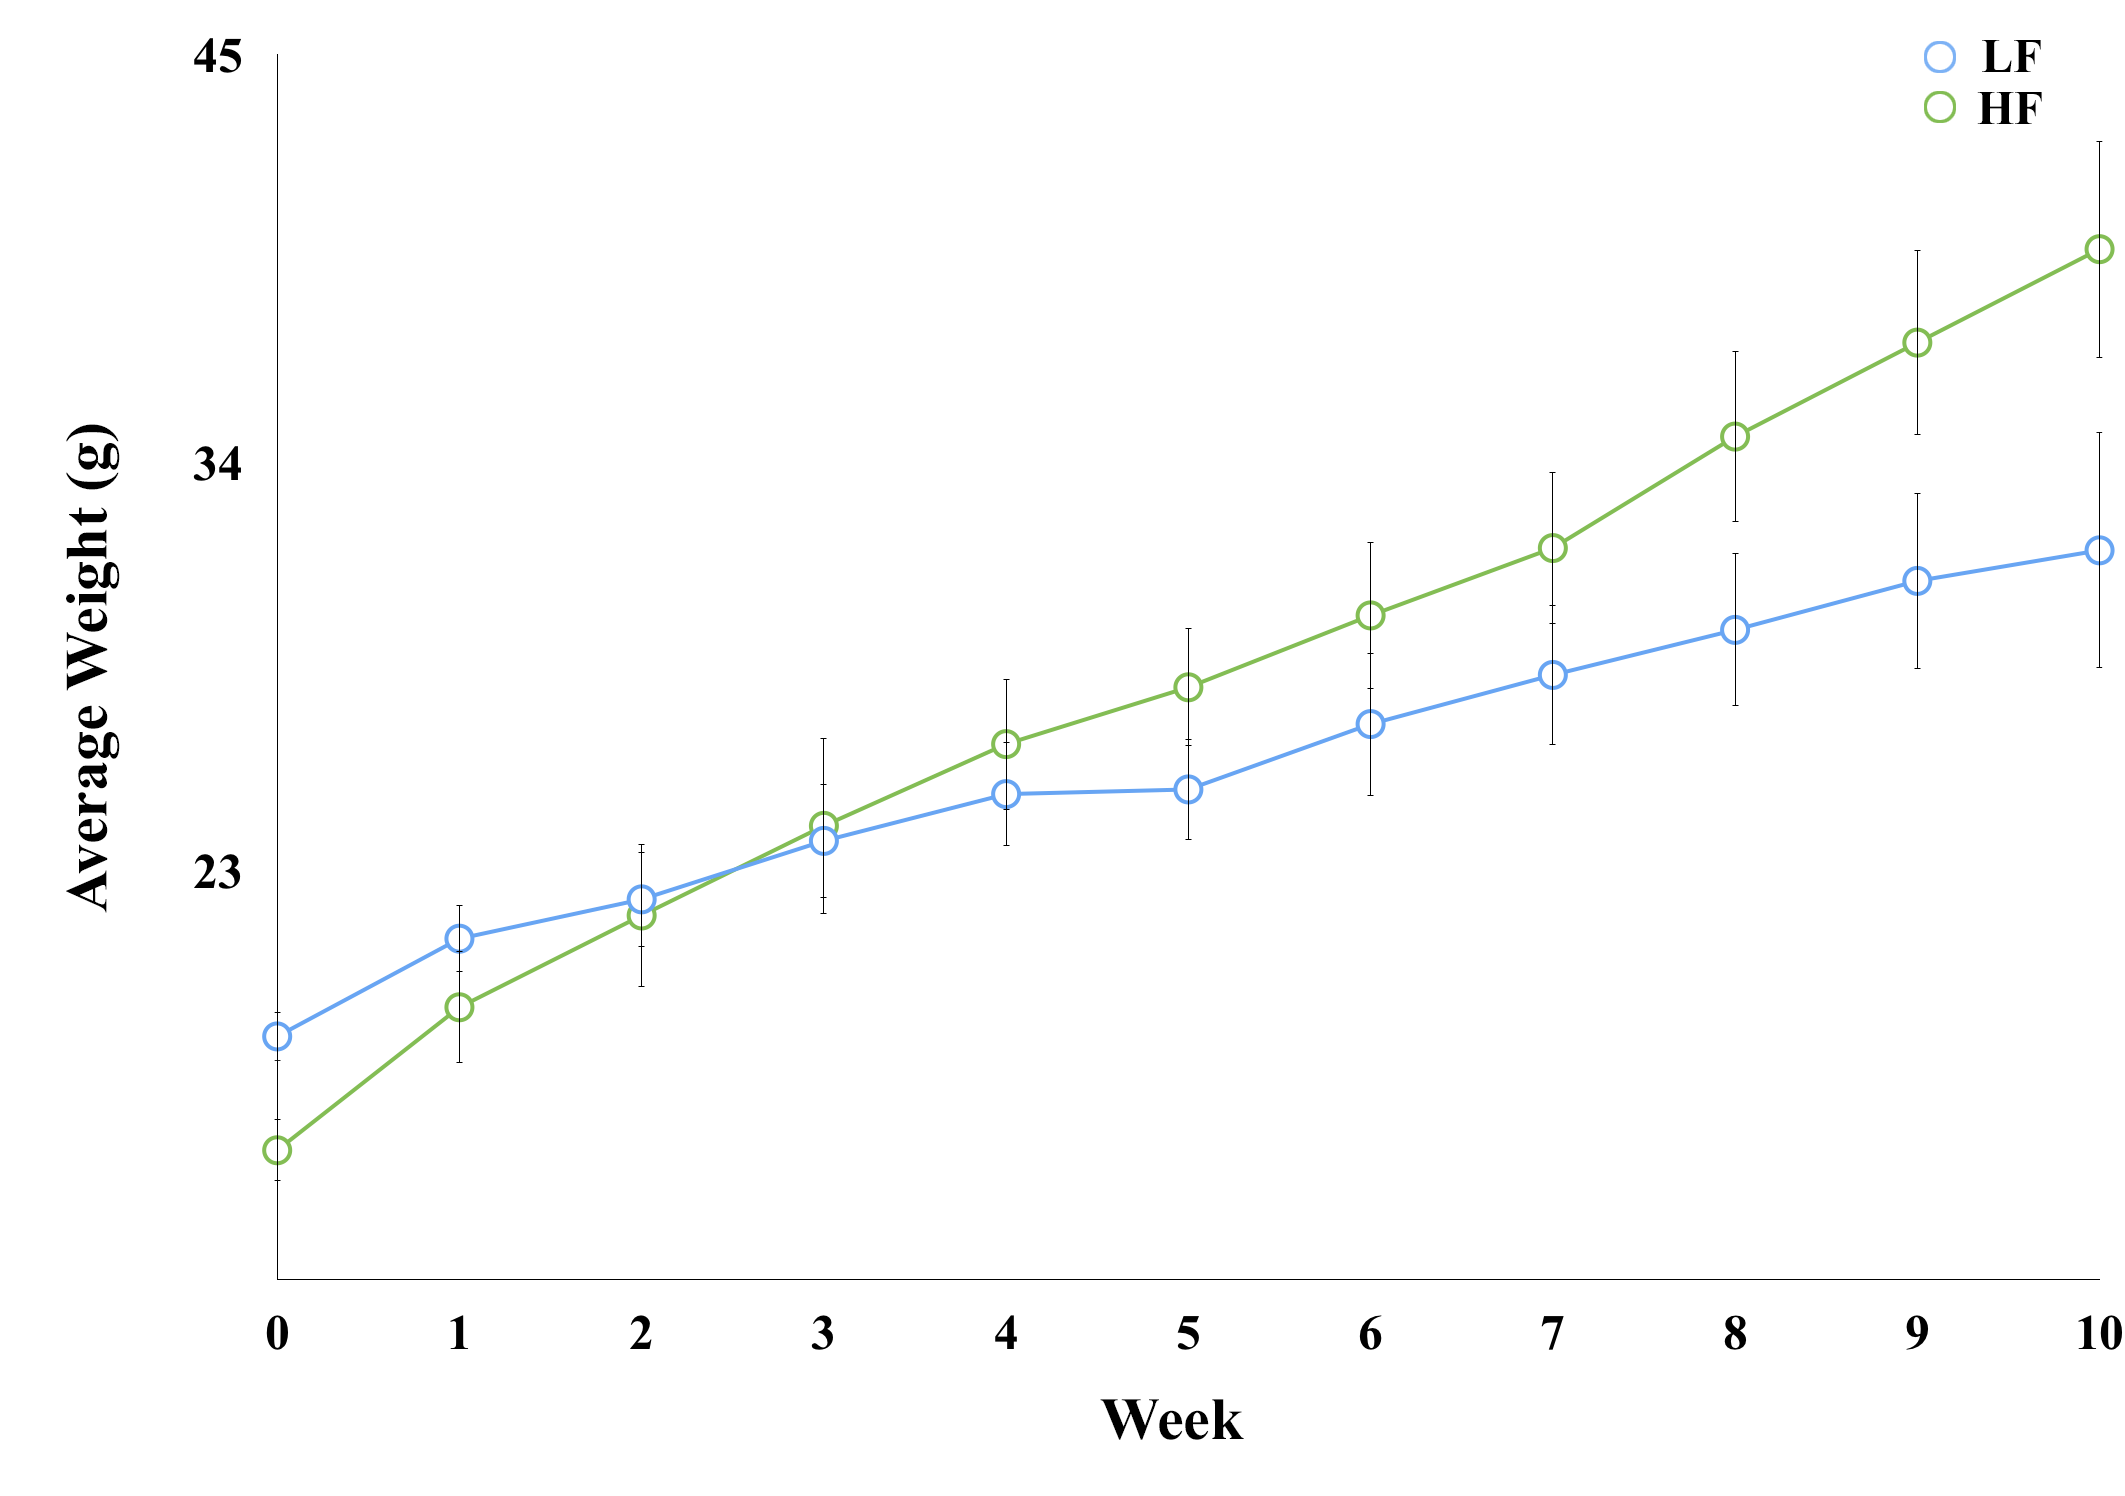
Fourteen male, 4 week-old, C57BL/6 mice (16–18g) were arbitrarily assigned into two groups: low fat (LF; n = 7) and high fat (HF; n = 7). LF and HF groups were fed diets consisting of 10% and 60% fat, respectively, for 10 weeks and weighed once per week.
Magnetic resonance imaging and spectroscopy
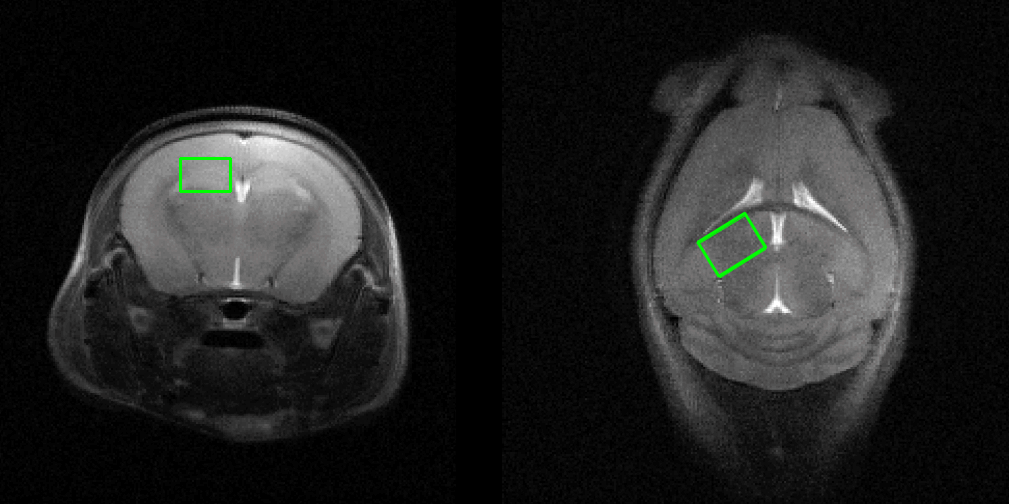
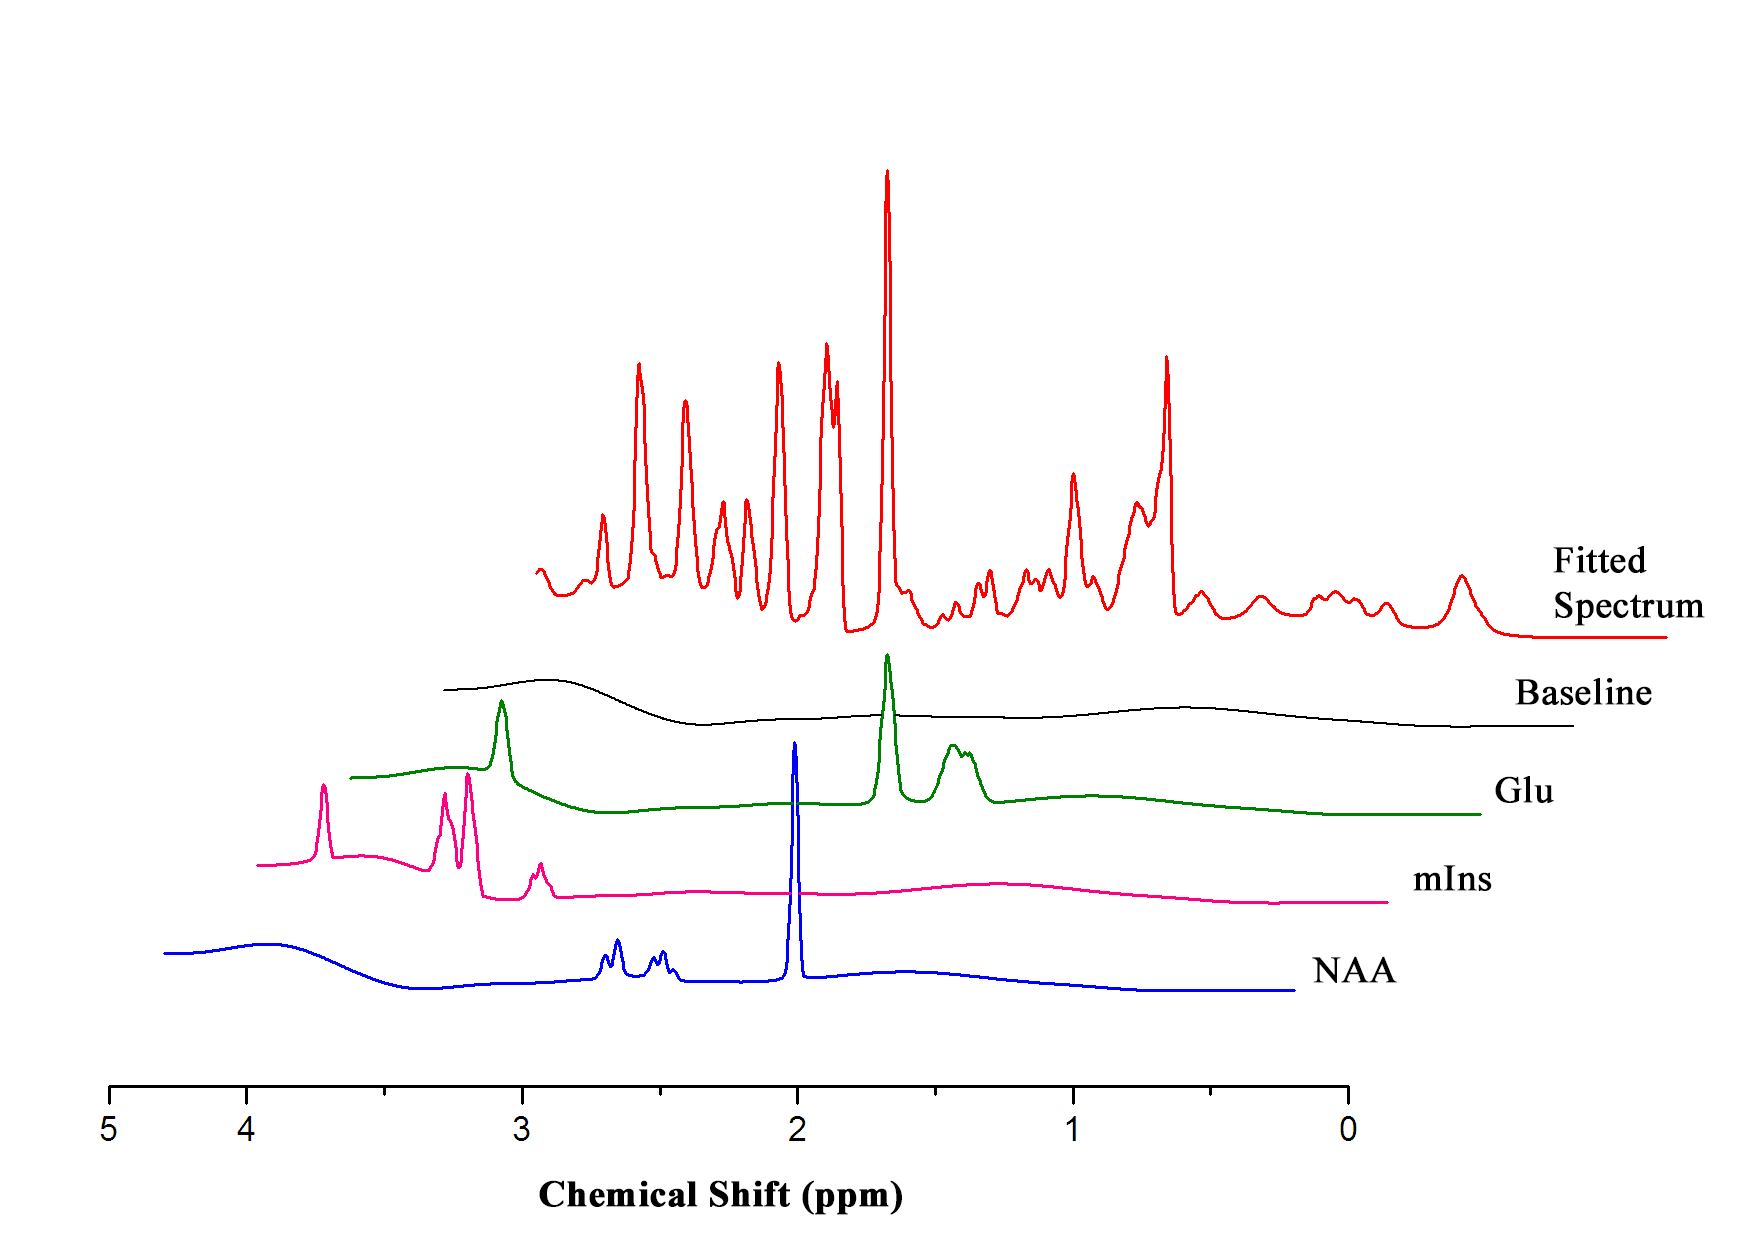
MRS scans were conducted following 10 weeks for each group. In vivo 1H MRS spectra were acquired using point resolved spectroscopy (PRESS) pulse sequences applied to the hippocampus with variable power and optimized relaxation delays. Parameters were as follows: TR = 5000 ms, TE = 13.40 ms, spectral width = 5.0 kHz, average = 384, number of data points = 2048, voxel size = 1.2*1.5*2.0 mm. During the MRI and MRS scans, mice were anesthetized using 1.5–2.5 % of isoflurane. In vivo spectra were analyzed using LC modeling software with a simulated basis set. Metabolite concentrations with a Cramer-Rao lower bound (CRLB) below 20% were regarded as acceptable. Figures 2 and 3 show representative T2-weighted images with their respective voxel plans and spectra.
Abdominal fat quantification MRI
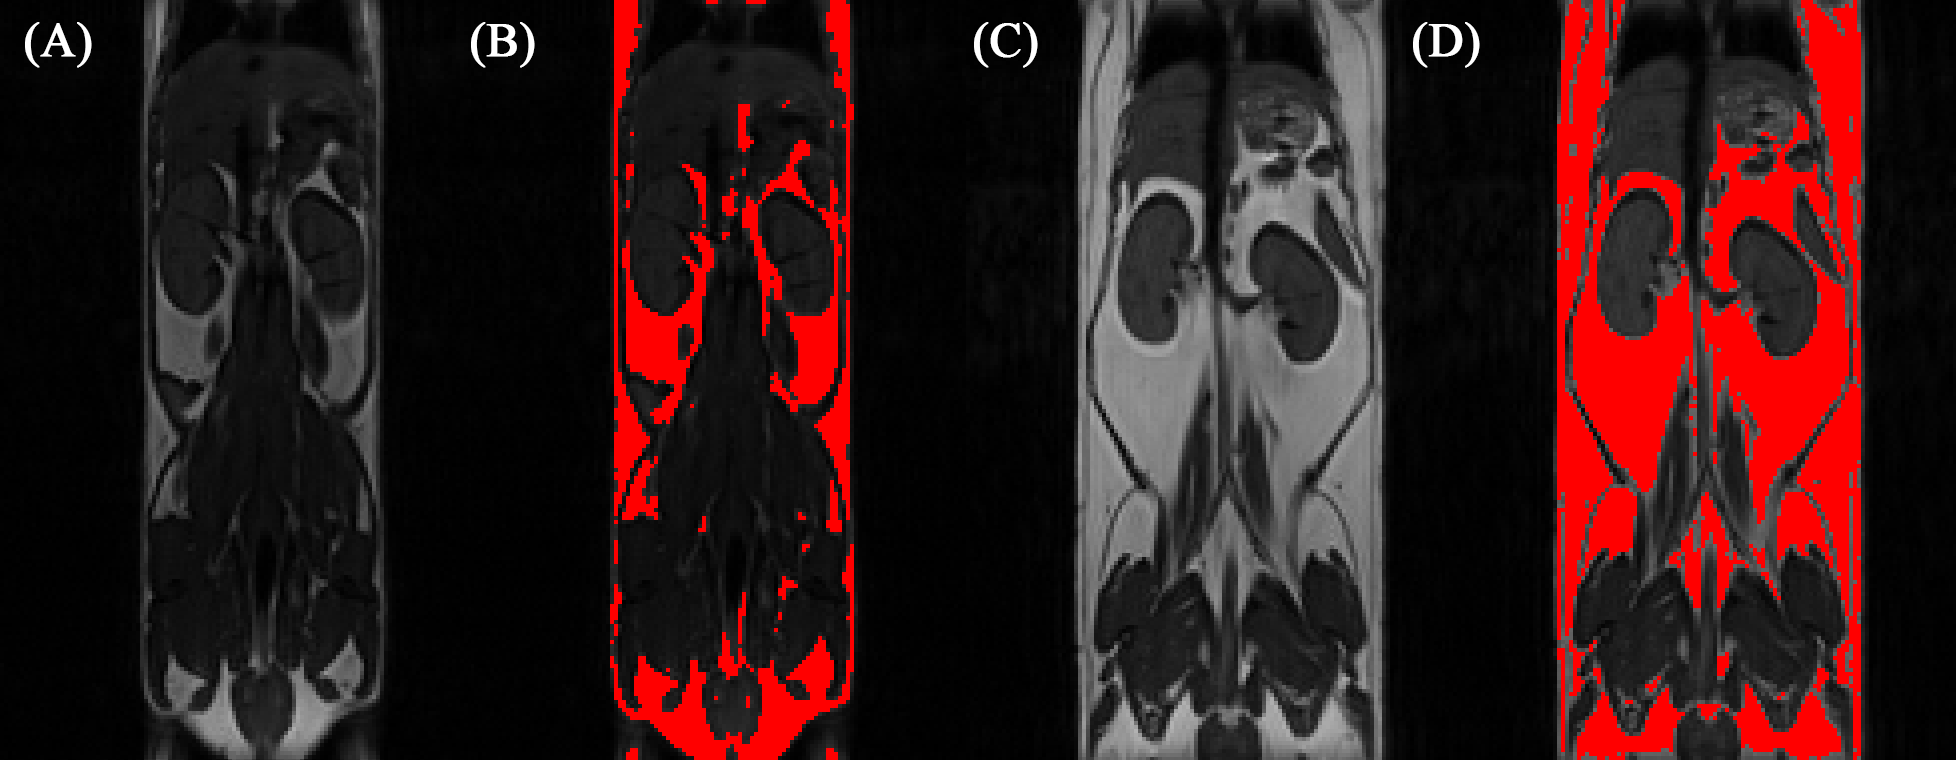
Abdominal fat MRI scans were performed 3 days following the brain MRS scan. T1-weighted images were acquired using the following parameters: TR = 900 ms, Average = 4, TE = 9.14 ms. Abdominal fat quantification was performed using Image J.
Enzyme-linked immunosorbent assay (ELISA)
Blood samples were obtained following the brain MRS scans. Plasma leptin and corticosterone levels were measured using an ELISA kit (Enzo Life Science) following the manufacturer’s protocol.
Statistical analyses were performed using the SPSS software. An independent t-test was used to compare differences between the two groups (* p< 0.05, ** p<0.01, *** p<0.001).
Results
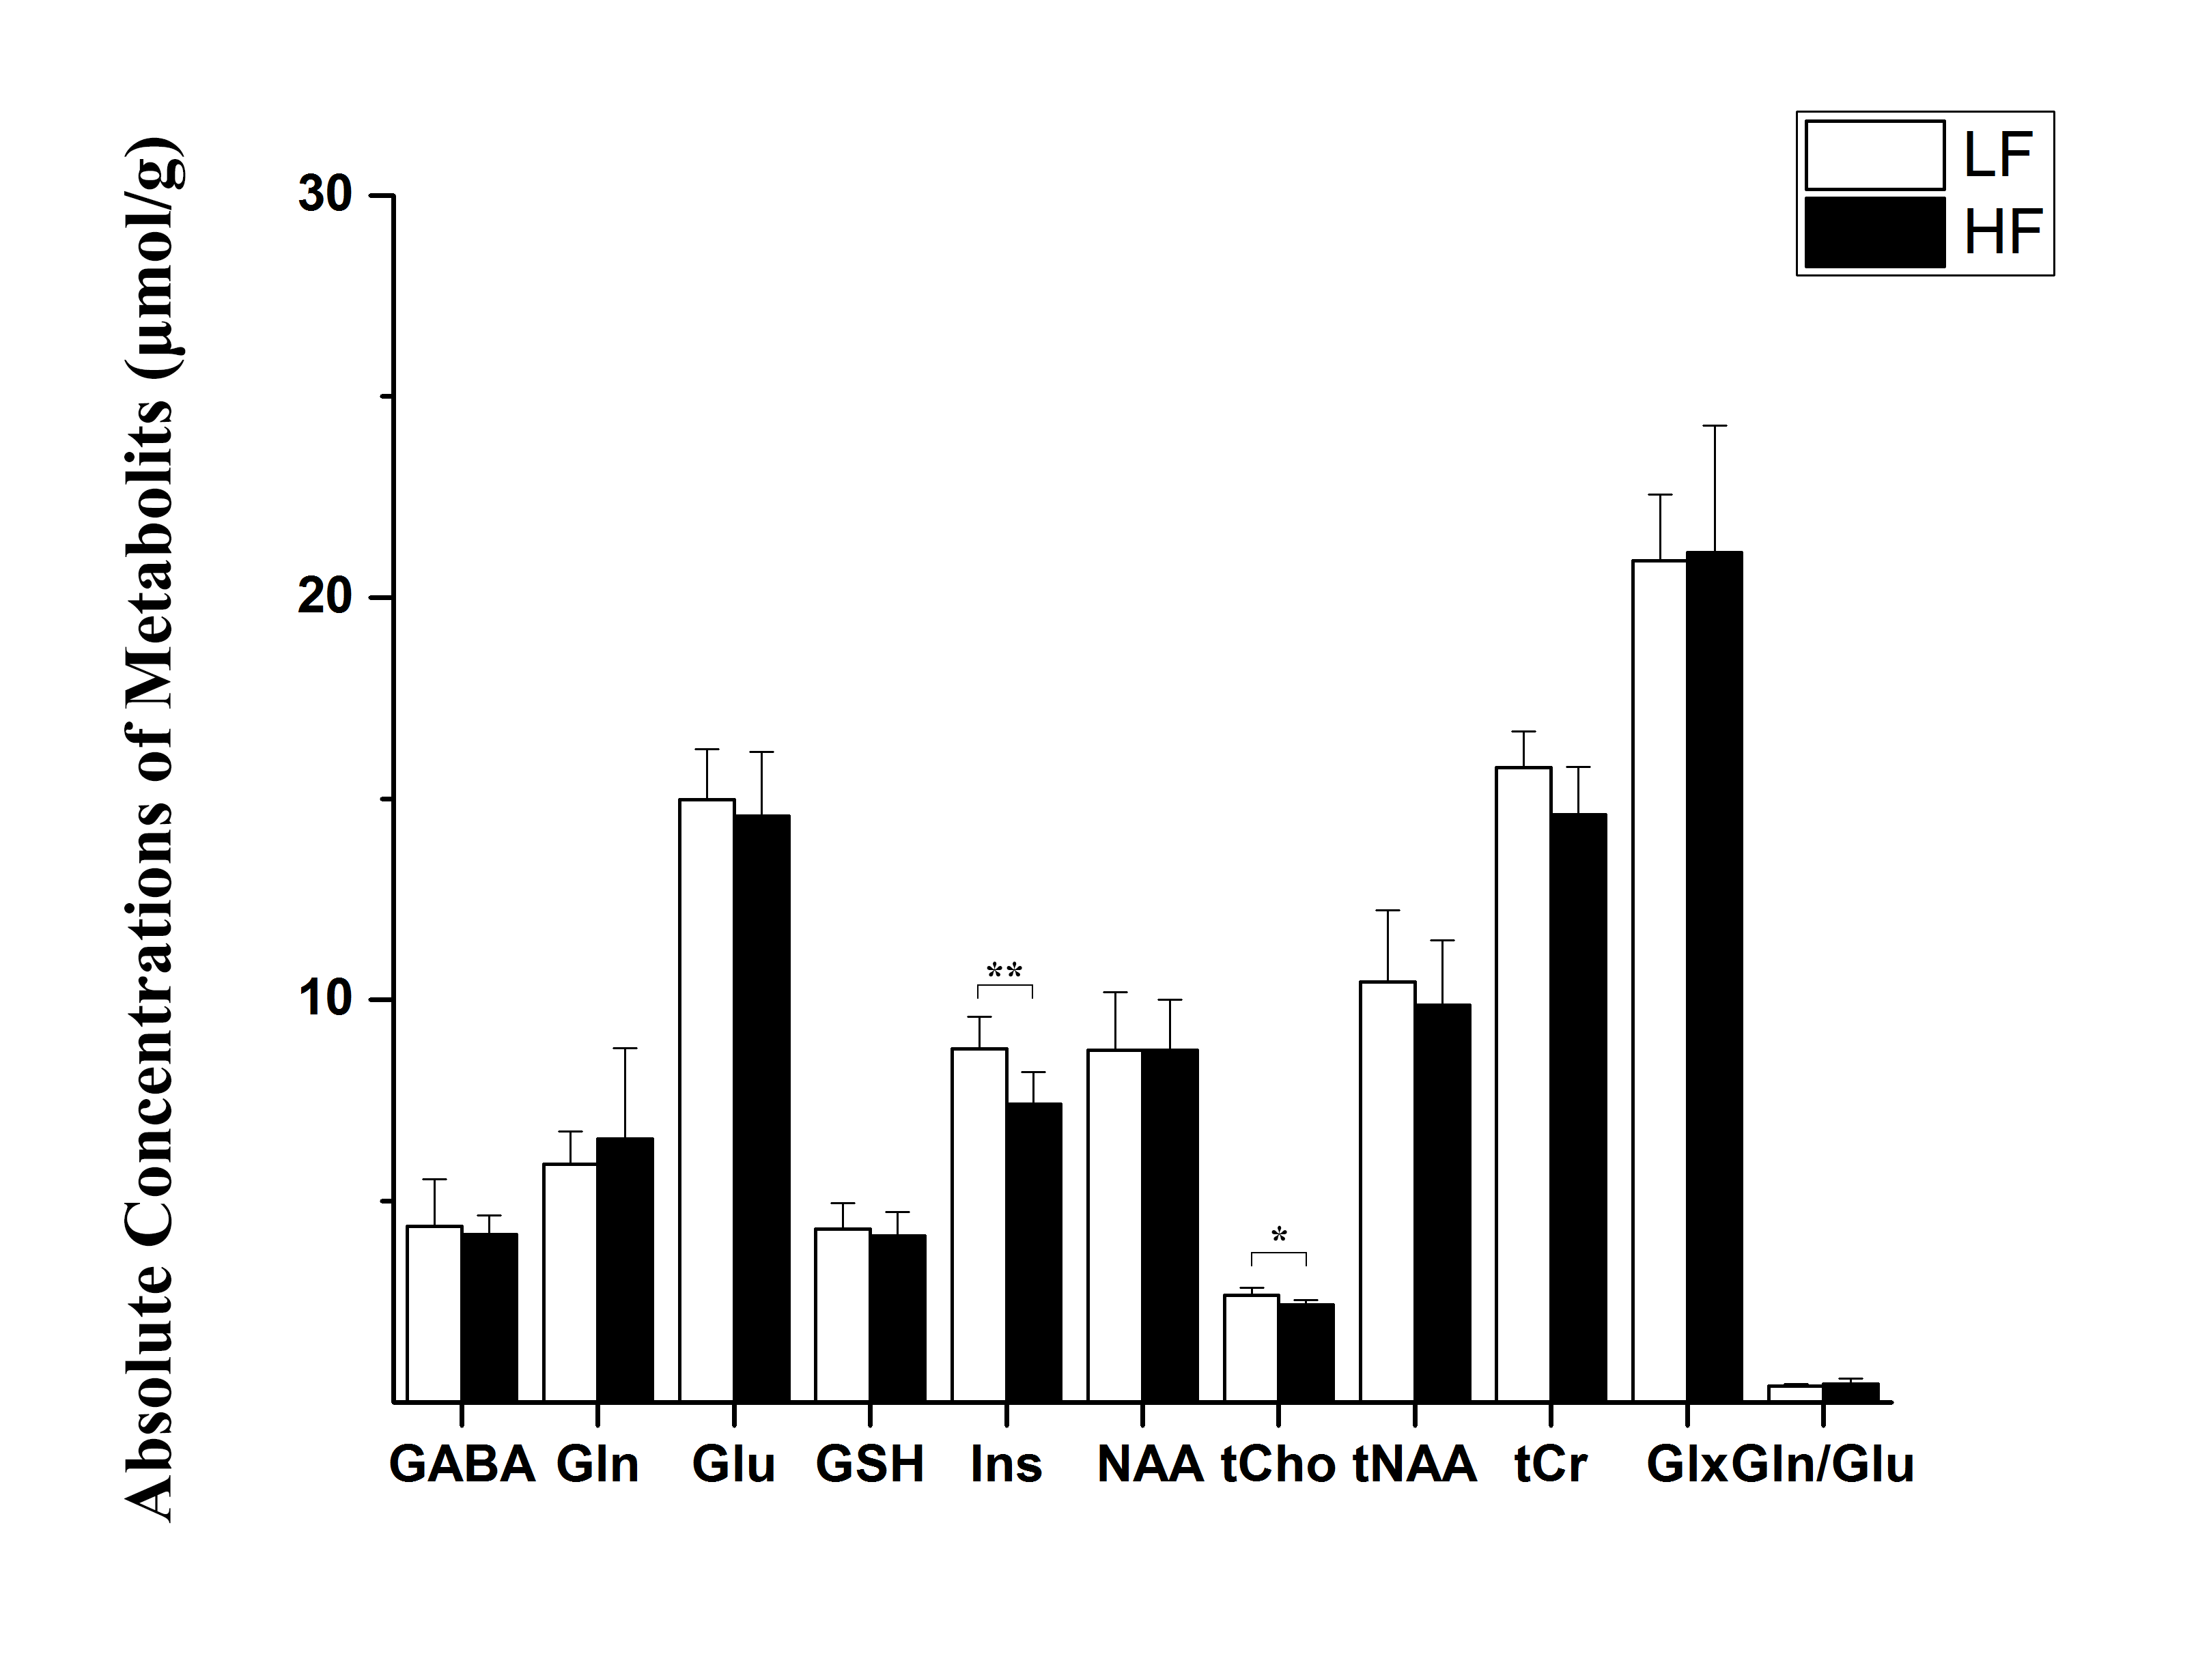
Throughout study, HF diet mice weighed significantly more than those in the LF group. The rate of weight gain was also higher in the HF group although there was no significant difference in average food intake. Figure 1 depicts mouse weight change. At week 10, mIns levels in the HF group were significantly lower than those in the LF group (p = 0.007). Total choline levels were also significantly lower in the HF group than in the LF group (p = 0.015). Figure 4 shows the mean metabolite concentrations for each group along with their standard deviations (SD). The average amount of abdominal fat in HF diet mice was significantly higher than that in LF diet mice (p < 0.000). Figure 5 displays representative abdominal coronal images. Plasma analysis revealed that both corticosterone and leptin levels in HF mice were significantly higher than those in LF mice (p = 0.03, p = 0.000 respectively). Table 1 displays mean plasma hormone levels.Discussions
Inhibitory (GABA) and Excitatory (Glu) mechanisms have been proposed to play an important role in mood depression and cognition. However, in our study we did not observe significant changes in glutamate-glutamine (Gln-Glu) cycling or GABA release2. We did find evidence of elevated hypothalamus-pituitary-adrenal (HPA) axis activity induced by increased plasma corticosterone levels. Altered corticosterone release and HPA axis dysfunction are related to the stress response, which has implications on the pathophysiology of both obesity and depression.
The hippocampus is regarded as a second site for glucocorticoid-mediated (corticosterone in the case of rodents) negative feedback regulation of the HPA axis. Choline containing compounds, derived from formation and degradation products of the cell membrane, as well as myo-inositol (mIns) are regarded as glial cell markers. The decrease in mIns concentration seen in HF diet mice without corresponding Gln-Glu alternation may reflect changes in glial function. In addition, the observed total choline levels indicate attenuated membrane turnover in HF diet mice. We therefore suggest that diets rich in saturated fats induce a stress-related response through metabolic disturbance and HPA axis dysfunction, which may indicate a relationship between obesity and depression.
Acknowledgements
This study was supported by grants (2012-007883) from the Mid-career Researcher Program through the National Research Foundation (NRF) funded by the Ministry of Science, ICT & Future Planning (MSIP) of Korea. And, this research was supported by a grant of the Korea Health Technology R&D Project through the Korea Health Industry Development Institute (KHIDI), funded by the Ministry of Health & Welfare, Republic of Korea (grant number: HI14C1135).References
1. Hryhorczuk C, Sharma S, Fulton SE (2013) Metabolic disturbances connecting obesity and depression. Front Neurosci 7:177. doi: 10.3389/fnins.2013.00177
2. Raider K, Ma D, Harris JL, et al (2016) A high fat diet alters metabolic and bioenergetic function in the brain: A magnetic resonance spectroscopy study. Neurochem Int 1–9. doi: 10.1016/j.neuint.2016.04.008
Figures